kitejunkiee
@t_kitejunkiee

What symbols does the trader recommend buying?
Purchase History
پیام های تریدر
Filter
kitejunkiee
Kaito - Big Sym Triangle forming
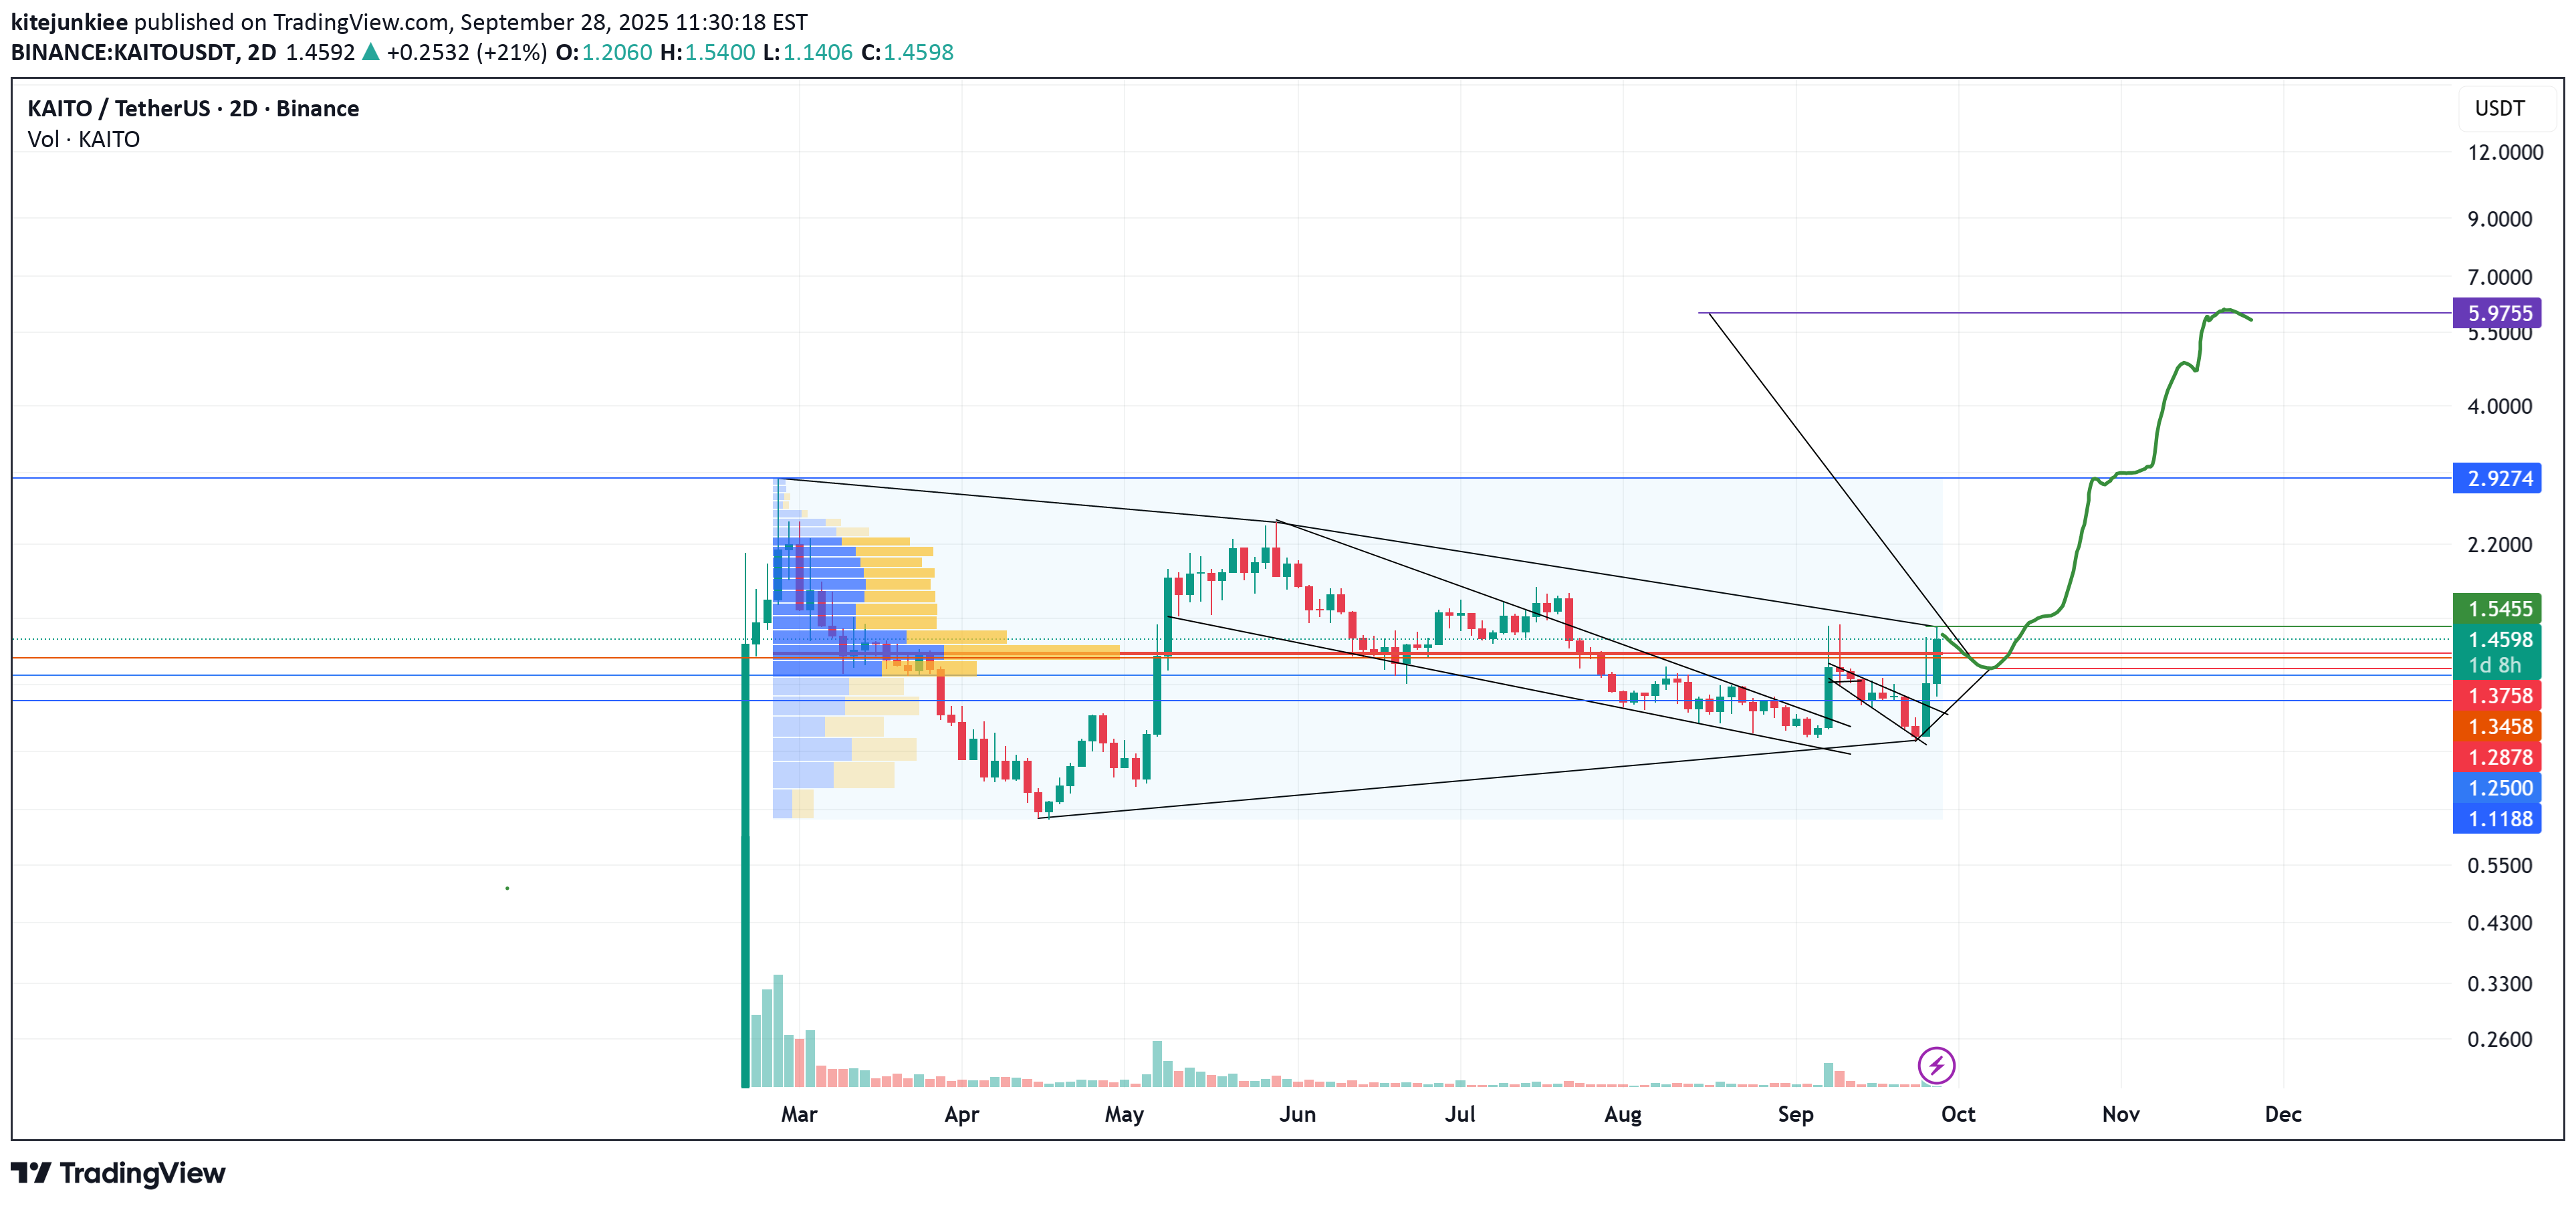
I entered early around $1.19, a few weeks ago, but this pattern is still forming. Expecting to go for a final low, thus giving a valid pattern. Targets close to $6. I will update once we have the complete pattern.
kitejunkiee
Chainlink Ignites: The Chain Reaction
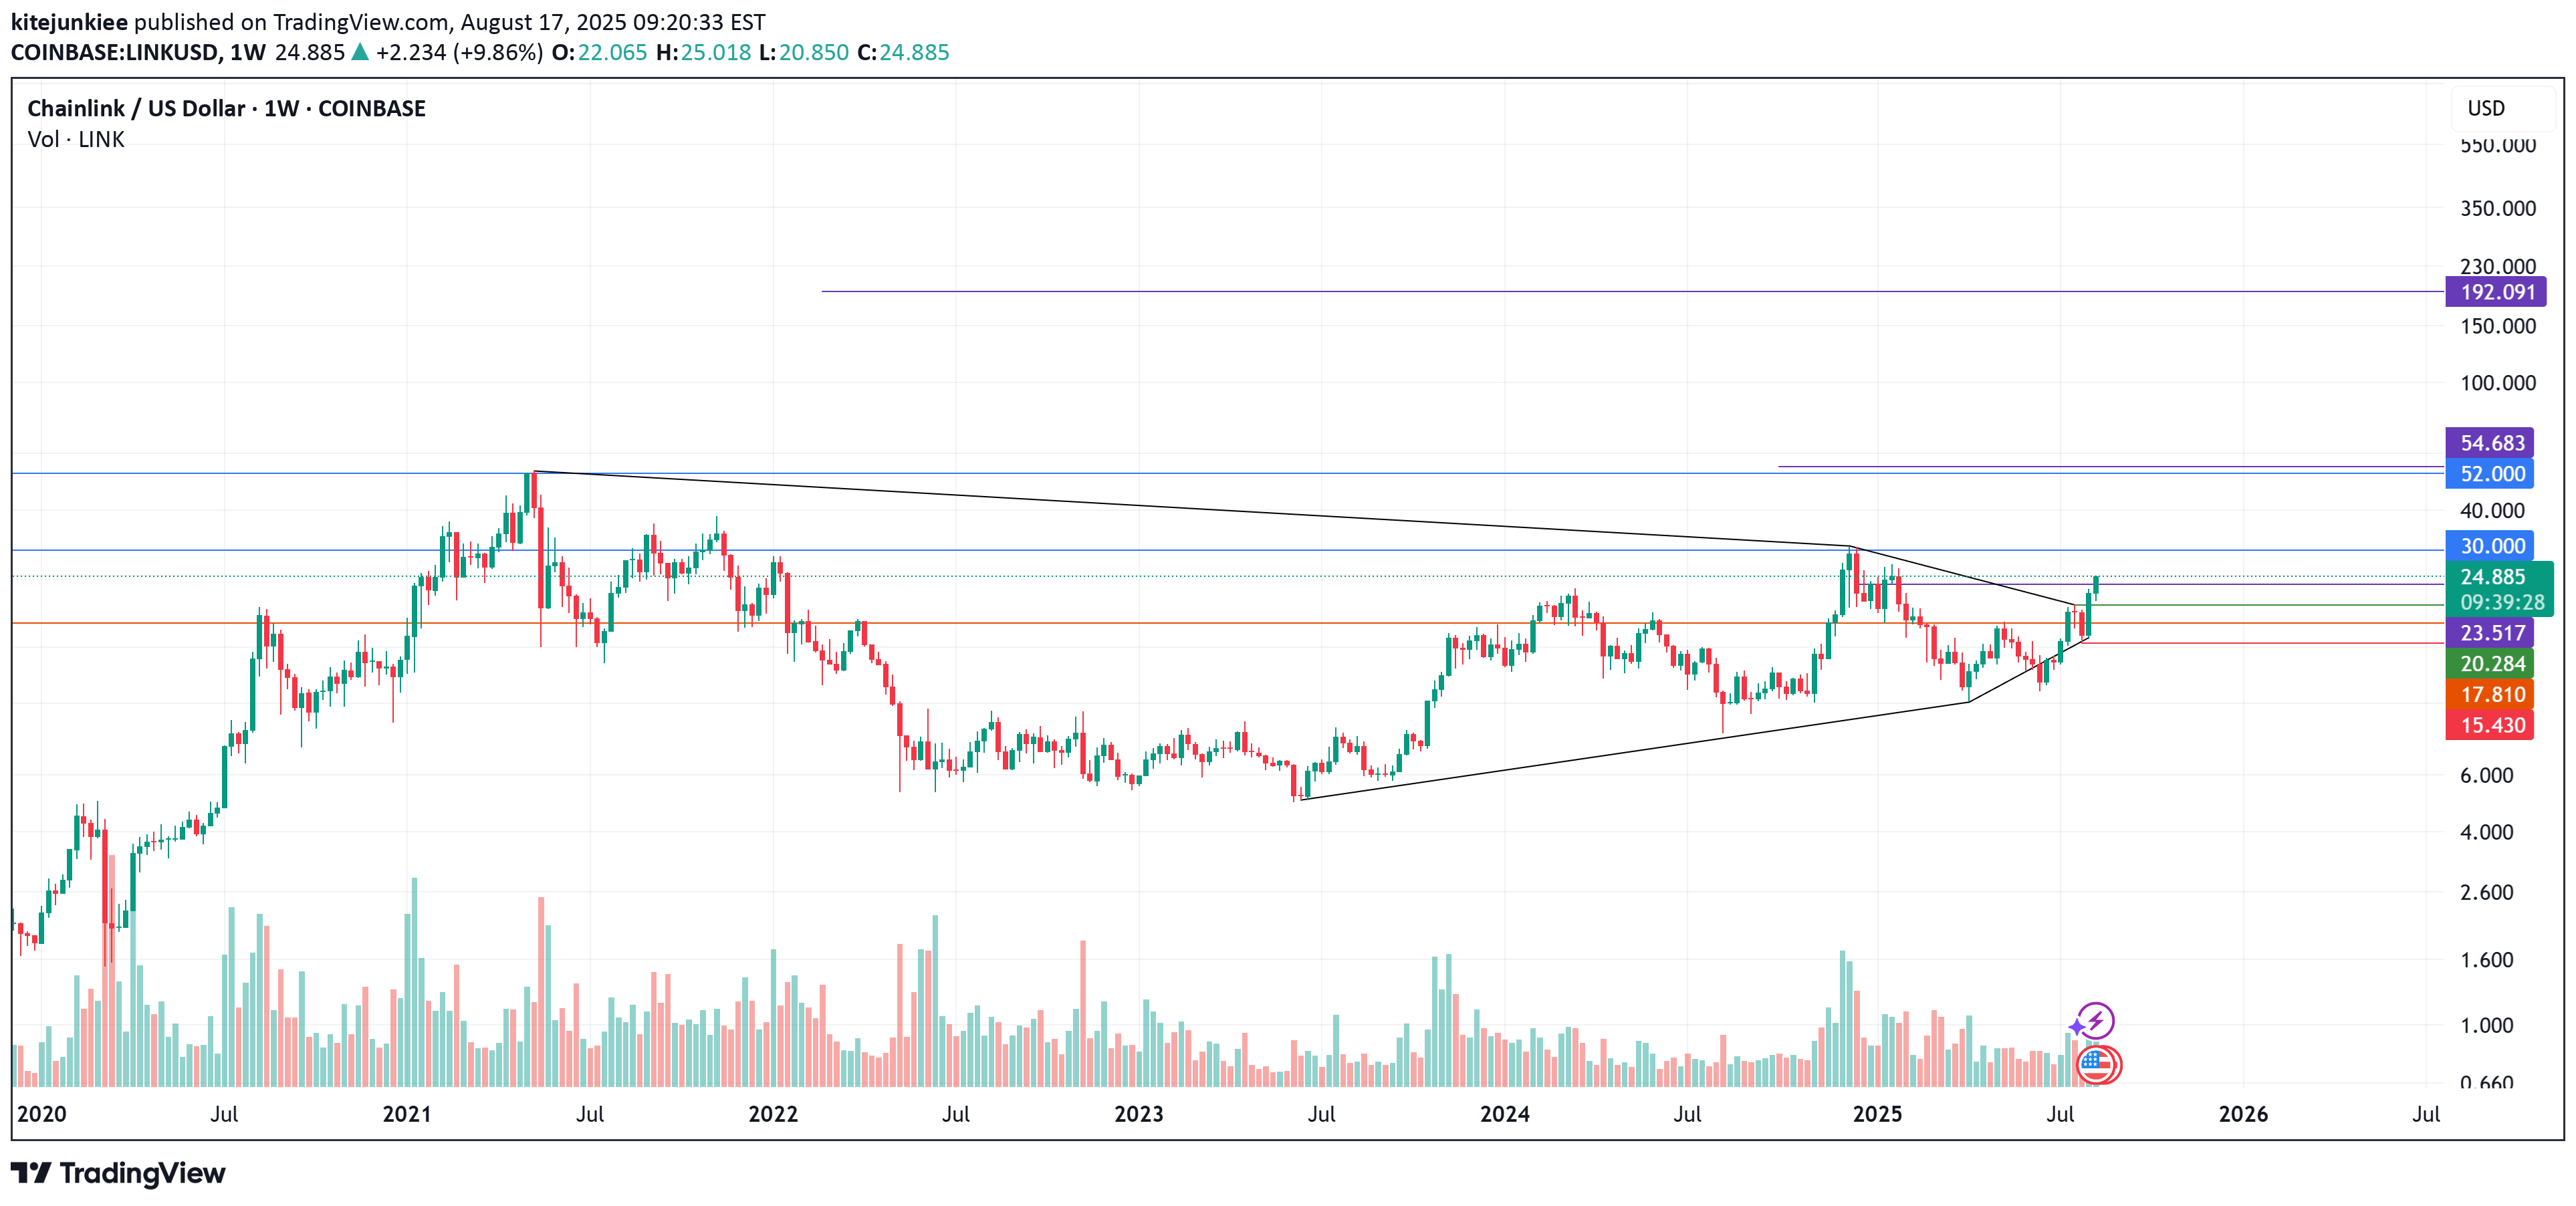
Chianlink macro pattern triggered, fundamentally strong. Even though link is known for wild swings this is a spot hold to target $192.091. I've posted a similar idea a few weeks ago with a target of $164.89, though after seeing the similar pattern on Coinbase which has higher volume, I will use this setup. I would not enter this on leverage the stop is to far away - spot holding only for me. Entry 20.284 Stop 15.430 Int1 23.517 Int2 54.684 Target 192.091
kitejunkiee
Ether.fi - Another squeeze - symmetrical triangle

So many tokens are squeezing ready to pop, can't be in them all. This is on a small timeframe (12HR). I will take this one, hopefully it runs quick and can get in and out. R/R 4.22 Enter 1.328 Stop 1.145 Int 1 1.419 Int 2 1.740 Target 2.101
kitejunkiee
BRETT - The #1 meme on BASE - Looking for breakout

R/R 9.25 Enter 0.06392 Stop 0.05327 Int 1 0.07 Int 2 0.086 Target 0.16240Don't think I will take this trade, just observe as already have enough trades open. May change my mind if it looks a bit better, for now looks average to good not ideal.Pattern still valid with New stop 0.5130, still forming, i have not entered
kitejunkiee
TRUMP - Tight Squeeze - 1000% upside & minimal downside

R/R 30. 10x from current levels a bit less if entering at entry point of 11.86. A bit of a wild card pattern, as it has developed a flat bottom. I entered this last time I posted, stopped out but have re-entered. Entry - 11.86 Stop - 8.686 Interval 1 - 14.39 Interval 2 - 20.186 Target - 111.969Current pattern still forming, if breaks 8.293 it has failed.
kitejunkiee
Symmetrical triangle on Onyxcoin setting up

XCN had a 18x pump in Jan 25 and has been forming this pattern for months. It looks like it wants to continue higher. I have entered with spot only, too much volatility for me on this token. R/R 38 and a Target 0.1125 is a 5x from the breakout entry point @ 0.02046. Entry - 0.02046 Stop - 0.01352 Interval 1 - 0.02570 Interval 2 - 0.0404 Target - 0.11258
kitejunkiee
BRETT - The #1 meme on BASE

It looks like Brett is setting up for continuation upside. Target around 0.11. Lets see if we get a final low to form this potential pattern. I'm keeping a close eye on this one as twice this year Brett has over performed similar patterns and by far my best two trades this year. The narrative behind this meme is also strong, with coinbase developing base and brett being the number one meme - yet coinbase has not listed Brett as yet - only a matter of time.I will stress this is not an IDEAL pattern, for symmetry. However it's past performance on similar patterns has me watching very closely and I do not want to miss this if it does break out.Pattern has formed - moved idea here
kitejunkiee

kitejunkiee
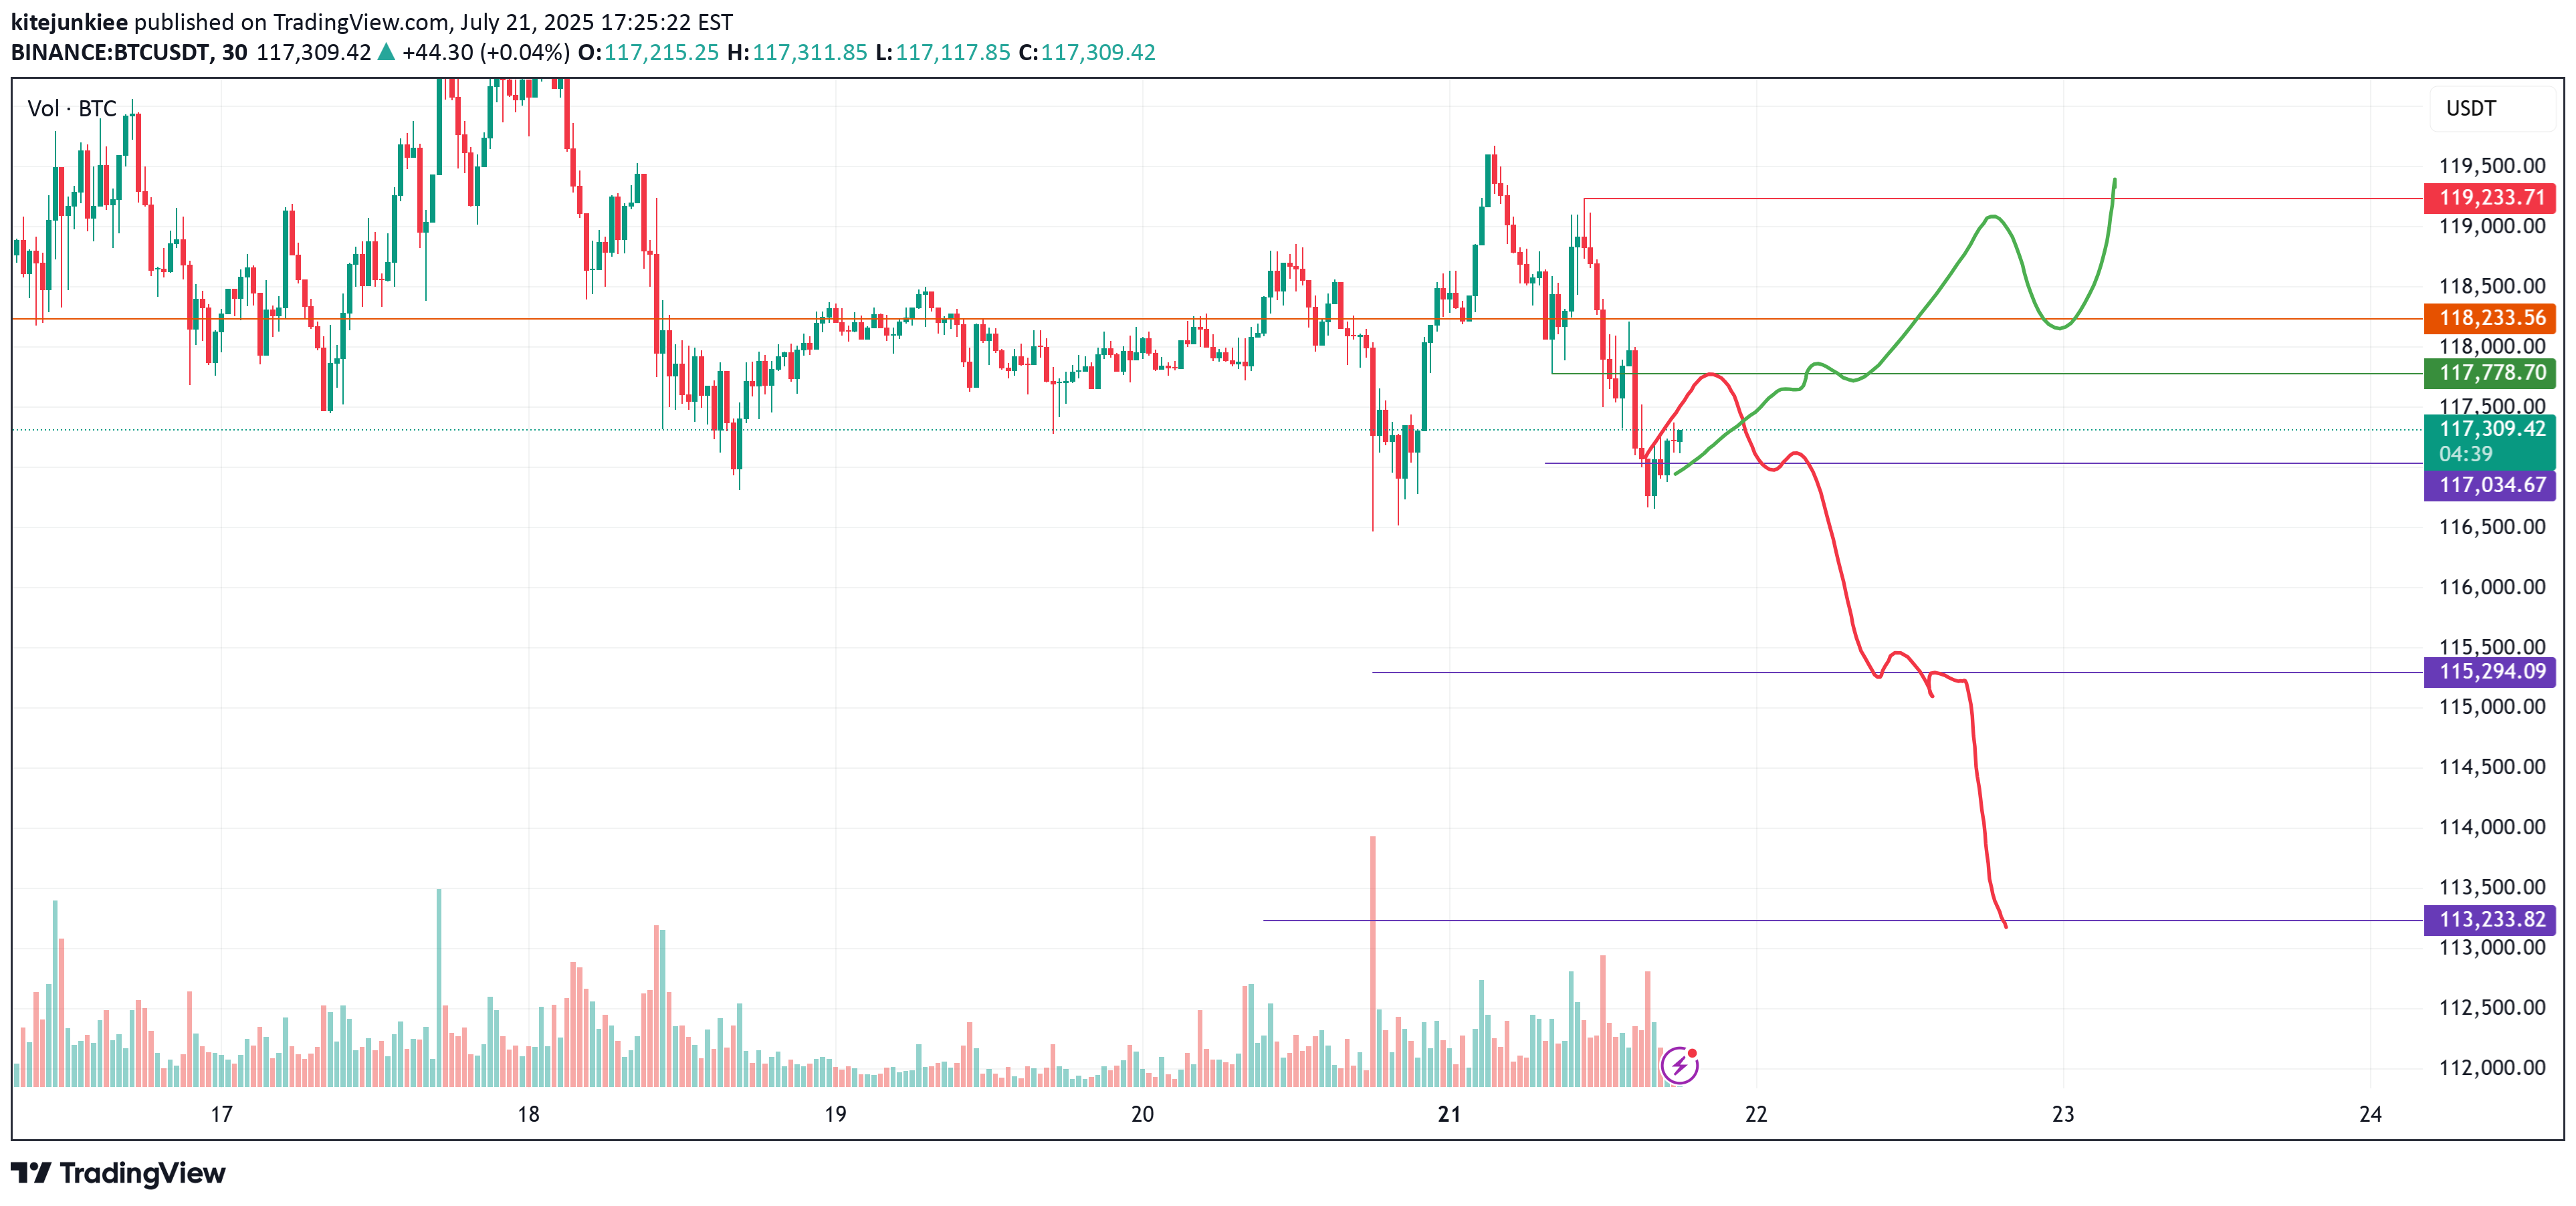
ETH H&S on the 30 min timeframe

Not trading this H&S if breaks, but just an watching for weaknessTarget reached, and back up we go, next stop $7400
kitejunkiee
Disclaimer
Any content and materials included in Sahmeto's website and official communication channels are a compilation of personal opinions and analyses and are not binding. They do not constitute any recommendation for buying, selling, entering or exiting the stock market and cryptocurrency market. Also, all news and analyses included in the website and channels are merely republished information from official and unofficial domestic and foreign sources, and it is obvious that users of the said content are responsible for following up and ensuring the authenticity and accuracy of the materials. Therefore, while disclaiming responsibility, it is declared that the responsibility for any decision-making, action, and potential profit and loss in the capital market and cryptocurrency market lies with the trader.