
kaydenhernandez
@t_kaydenhernandez

What symbols does the trader recommend buying?
Purchase History
پیام های تریدر
Filter
Signal Type
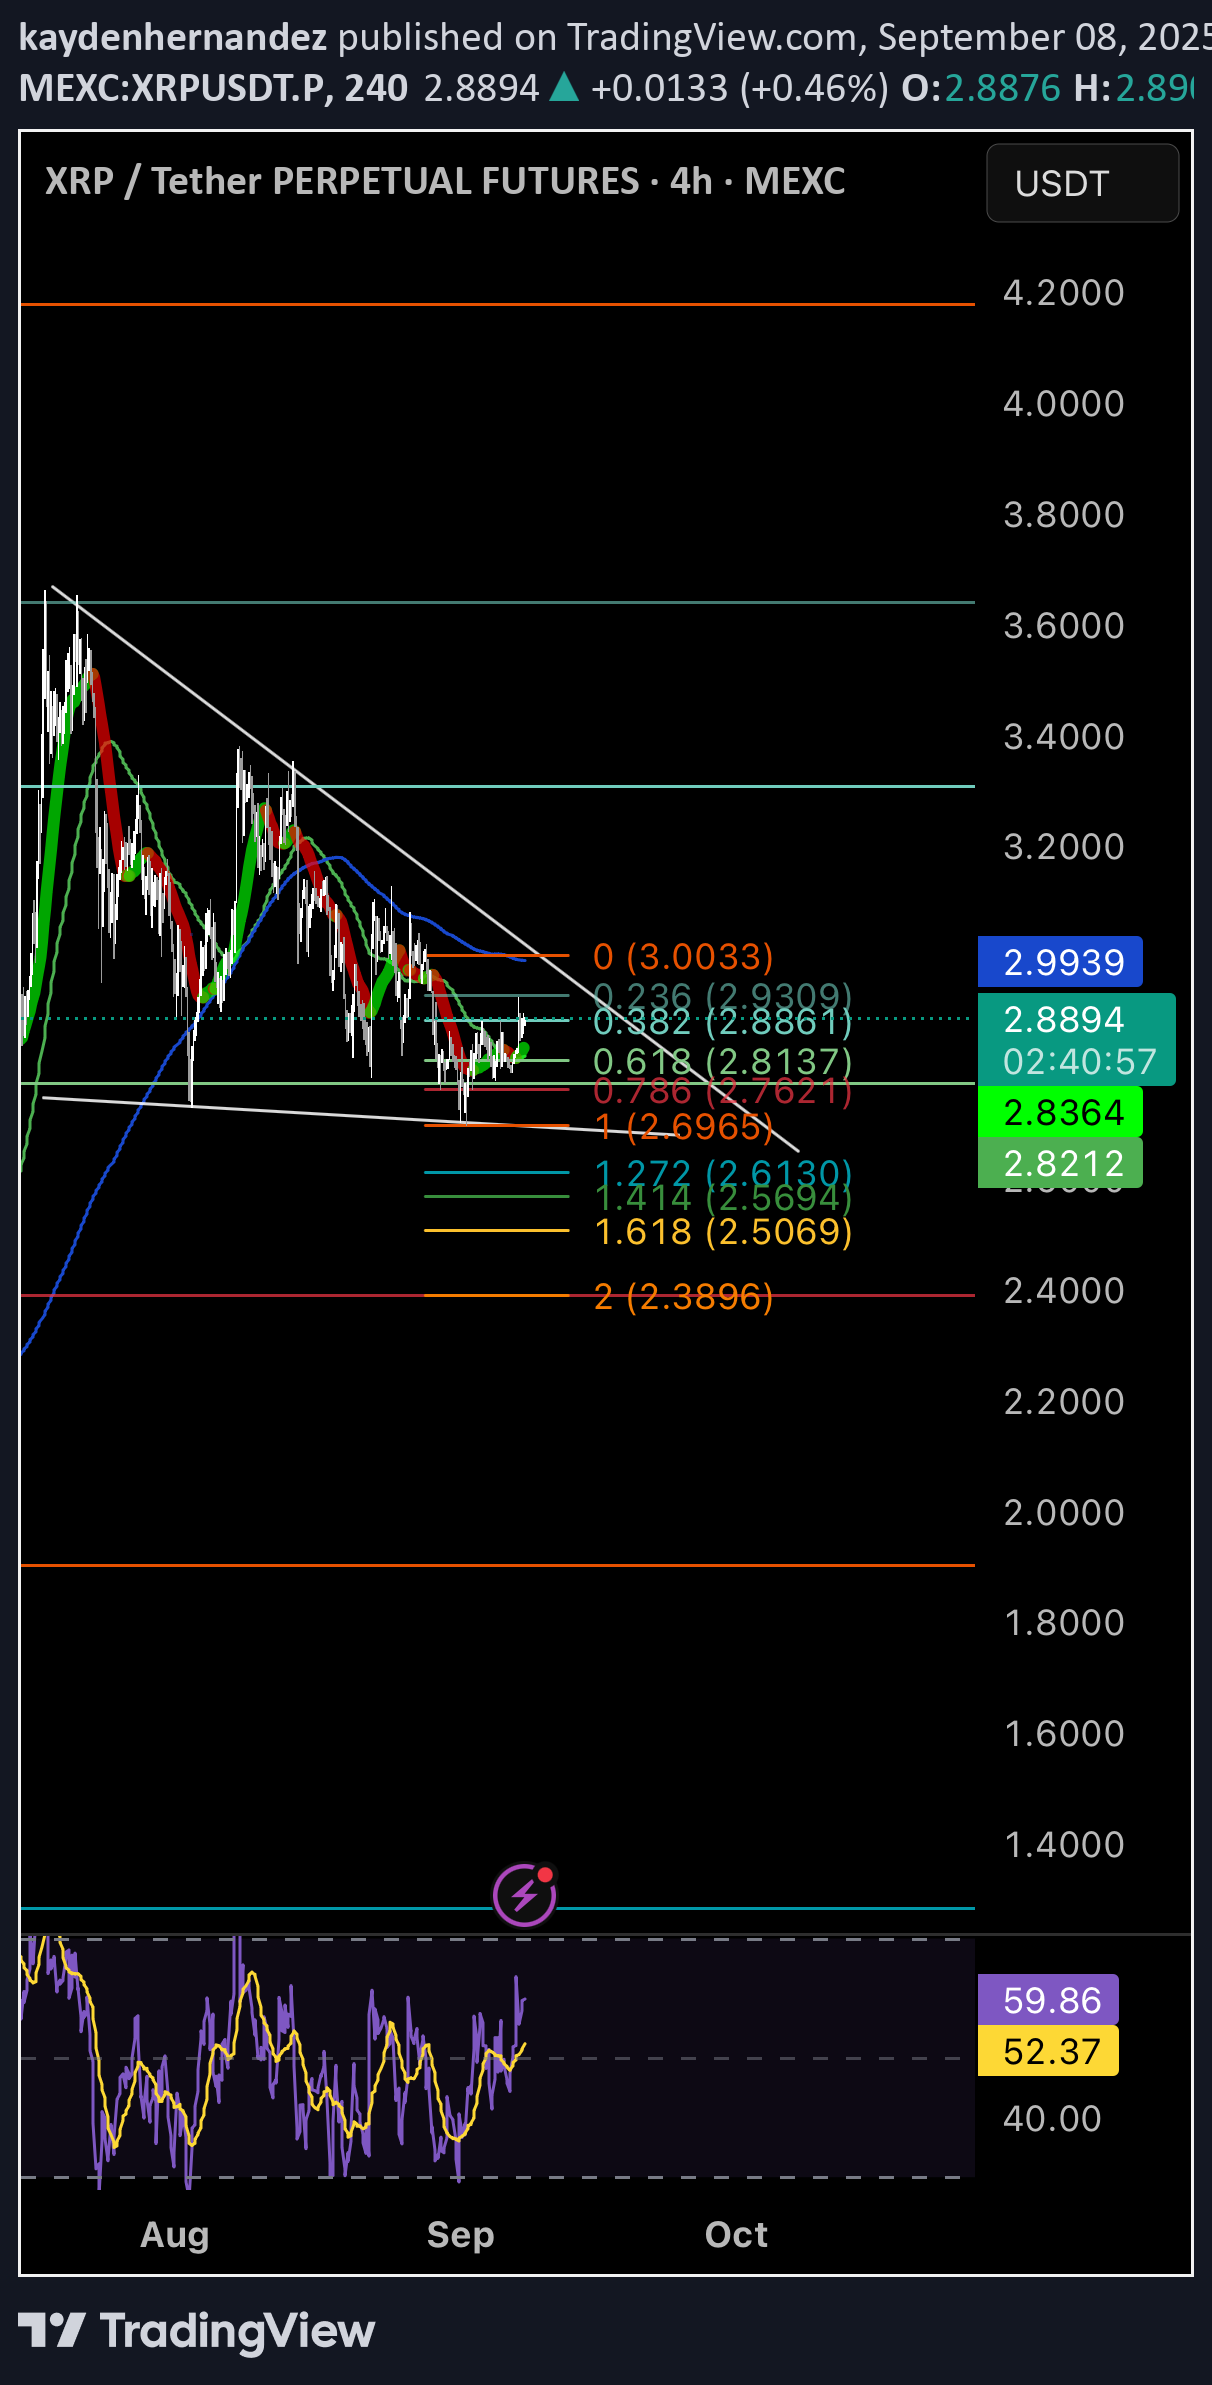
Over the past 2.5 months, XRP has been in a healthy retracement from its all-time highs, forming what I see as a bullish structure: •✅ Double Bottom confirmed on the daily 0.618 Fibonacci retracement •✅ I entered my long position near the 0.618 level on the second bounce and have been accumulating throughout this consolidation •✅ Structure is forming a falling wedge, which is typically a bullish reversal pattern •✅ On the 4H timeframe, we are approaching a golden cross, adding further confluence for bullish momentum As long as XRP holds the 0.618 Fib, I’ll continue to accumulate. A breakout from this wedge could open the door to higher targets, with key resistance levels at the 0.382 (≈2.88) and major resistance at 3.00+. ⸻ 💭 My take: This chart setup looks like controlled consolidation before the next leg up. Patience and holding the 618 are key.
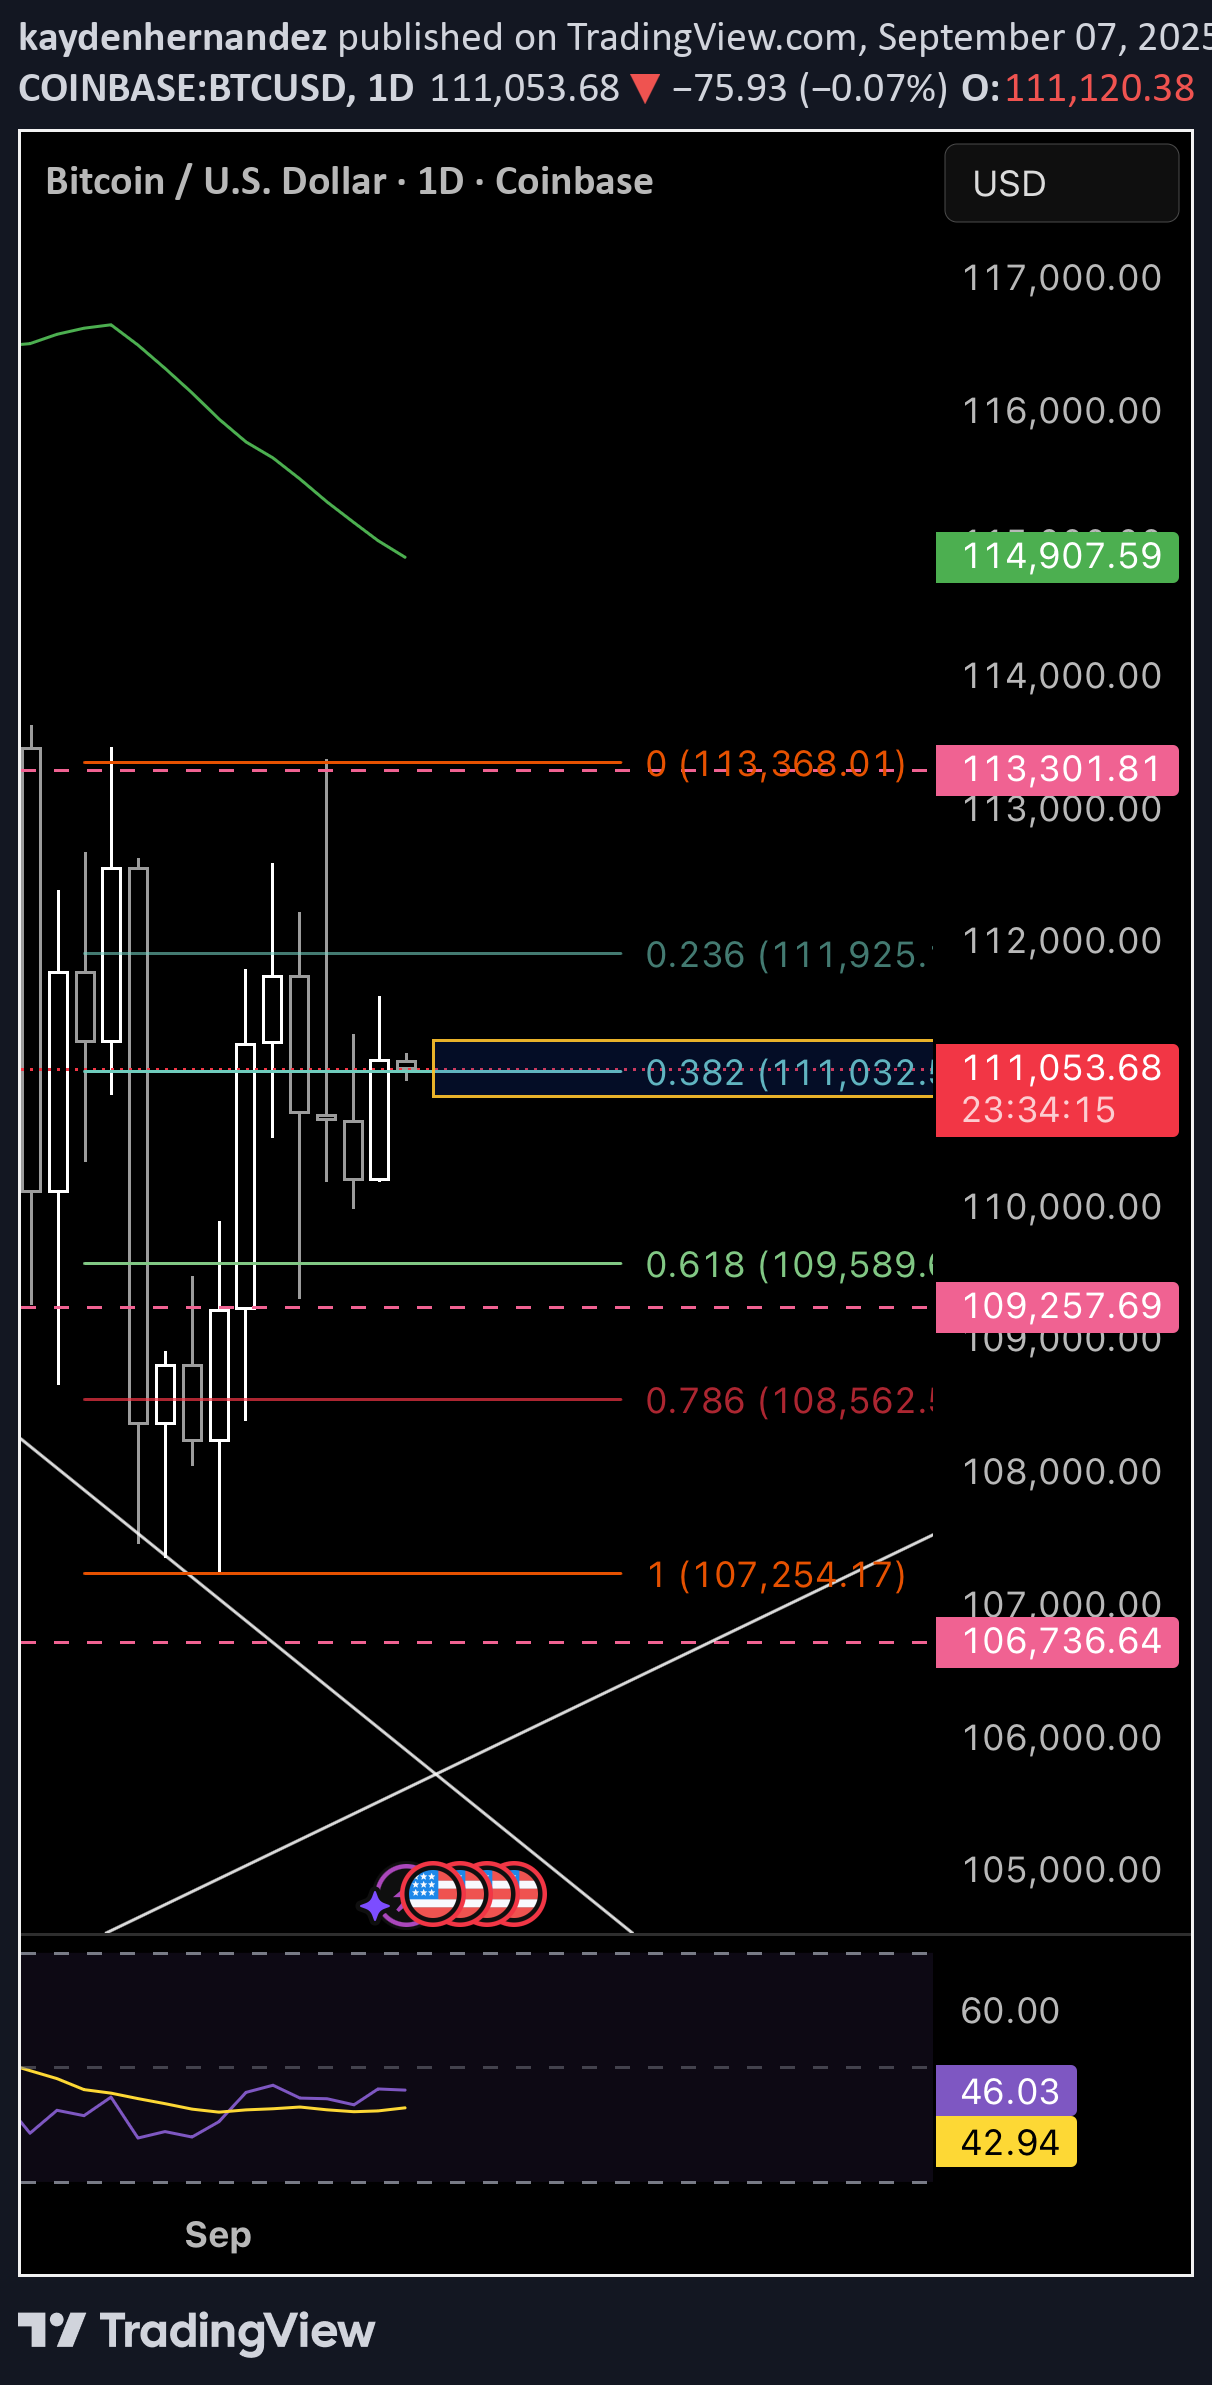
From the recent swing low to swing high on the daily timeframe, today’s daily candle closed right at the 0.382 Fibonacci retracement around $111,032. In my view, that’s a constructive sign – it suggests buyers are still stepping in to defend higher levels rather than letting price break deeper immediately. What’s also worth noting is that today marks the open of a new weekly candle. Starting the week with strength above the 0.382 level gives me a slightly bullish bias, not just for BTC but also across altcoins. Of course, the market doesn’t move in a straight line. If we do see more downside, I’m prepared for potential retests at the 0.618 ($109,589) or even the 0.786 ($108,562) levels – both of which are natural supports within the Fib structure. But overall, the structure here still looks bullish in the bigger picture. Key Levels to Watch: •0.382 Fib: $111,032 (holding for now) •0.618 Fib: $109,589 (next possible support) •0.786 Fib: $108,562 (deeper retest level) •Local high: $113,368 (break above here could accelerate momentum)
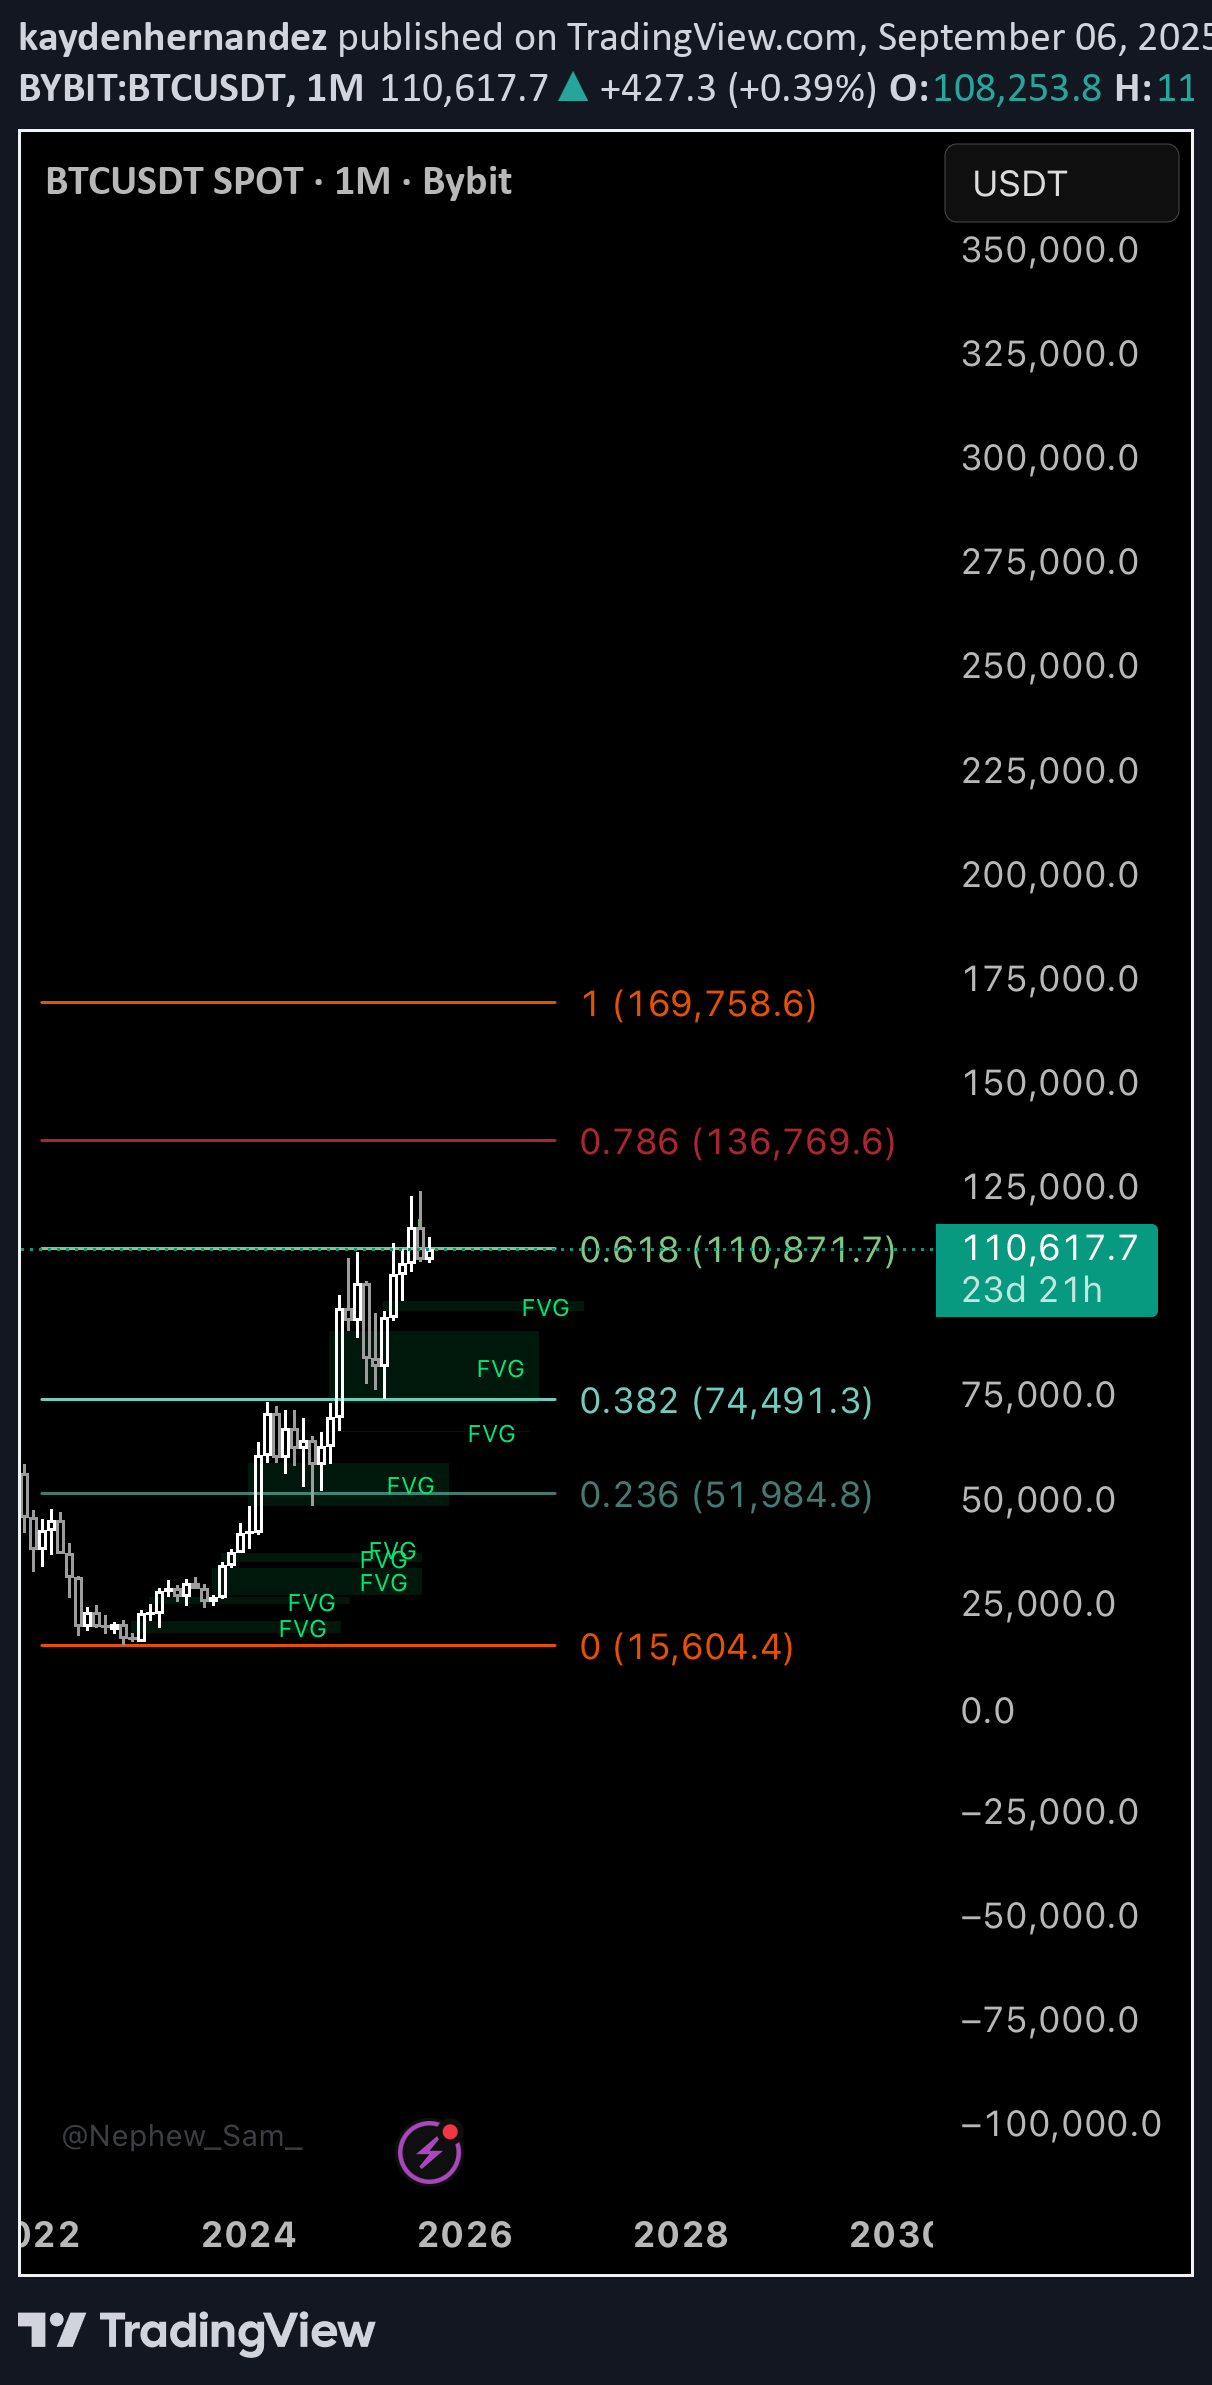
I’ve been testing a Fibonacci projection method that I believe uncovers hidden tops before they form. The premise is simple: if Fibonacci retracement levels don’t align with price action, the move isn’t finished. By adjusting the fib “top” until levels align with historical support and resistance, we can project where the true macro top should be. On Bitcoin’s monthly chart, this method points to an approximate top near $169,000. ⸻ The Theory: “Fib Alignment” •Normally, Fibonacci retracements are drawn from swing low → swing high. •But if the chosen top is not the true top, the retracement levels won’t “respect” historical pivots — price slices through or ignores them. •By dragging the fib higher until the levels snap into alignment with prior cycle resistances and supports, the eventual swing high is revealed. This isn’t classical fib usage. It behaves more like a hybrid between linear retracements and logarithmic fib extensions. ⸻ Bitcoin’s Current Setup 1.Fib from 2022 bottom → 124k (current high): •0.236, 0.382, and 0.618 do not align with key monthly levels. •Market structure feels “off.” 2.Fib from 2022 bottom → 169k projected top: •0.236 (~120k) matches current resistance zone. •0.382 (~85k–90k) aligns with prior rejection/support. •0.618 (~55k–57k) = dead-on with the 2021 cycle top. •0.786 (~39k) = historically critical demand zone. When extended to ~$169k, the fib levels align perfectly across the monthly structure — retroactively validating the projection. ⸻ Confluence With Log Extensions Interestingly, this “alignment top” also corresponds with the 0.618 extension target on log-scale fibs, which many traders use as long-term take-profit levels. In other words: •My method (drag until aligned) •Classical log fib extensions …both converge around $169,000 BTC. ⸻ Implications •If this framework holds, BTC’s current move is not complete. •A macro cycle top around $169k is the level where Fibonacci alignment finally “snaps into place.” •After such a top, retracements to 0.382, 0.5, and 0.618 would define the next bear market structure. ⸻ Conclusion This “Fib Alignment Theory” is experimental, but backtesting shows creepy accuracy on multiple assets and timeframes. Bitcoin’s monthly chart strongly suggests the true macro top lies around $169,000. If price respects this projection, the market will have validated a powerful new way to use Fibonacci — one that looks forward, not backward.
Disclaimer
Any content and materials included in Sahmeto's website and official communication channels are a compilation of personal opinions and analyses and are not binding. They do not constitute any recommendation for buying, selling, entering or exiting the stock market and cryptocurrency market. Also, all news and analyses included in the website and channels are merely republished information from official and unofficial domestic and foreign sources, and it is obvious that users of the said content are responsible for following up and ensuring the authenticity and accuracy of the materials. Therefore, while disclaiming responsibility, it is declared that the responsibility for any decision-making, action, and potential profit and loss in the capital market and cryptocurrency market lies with the trader.