Technical analysis by kaydenhernandez about Symbol BTC: Buy recommendation (9/7/2025)

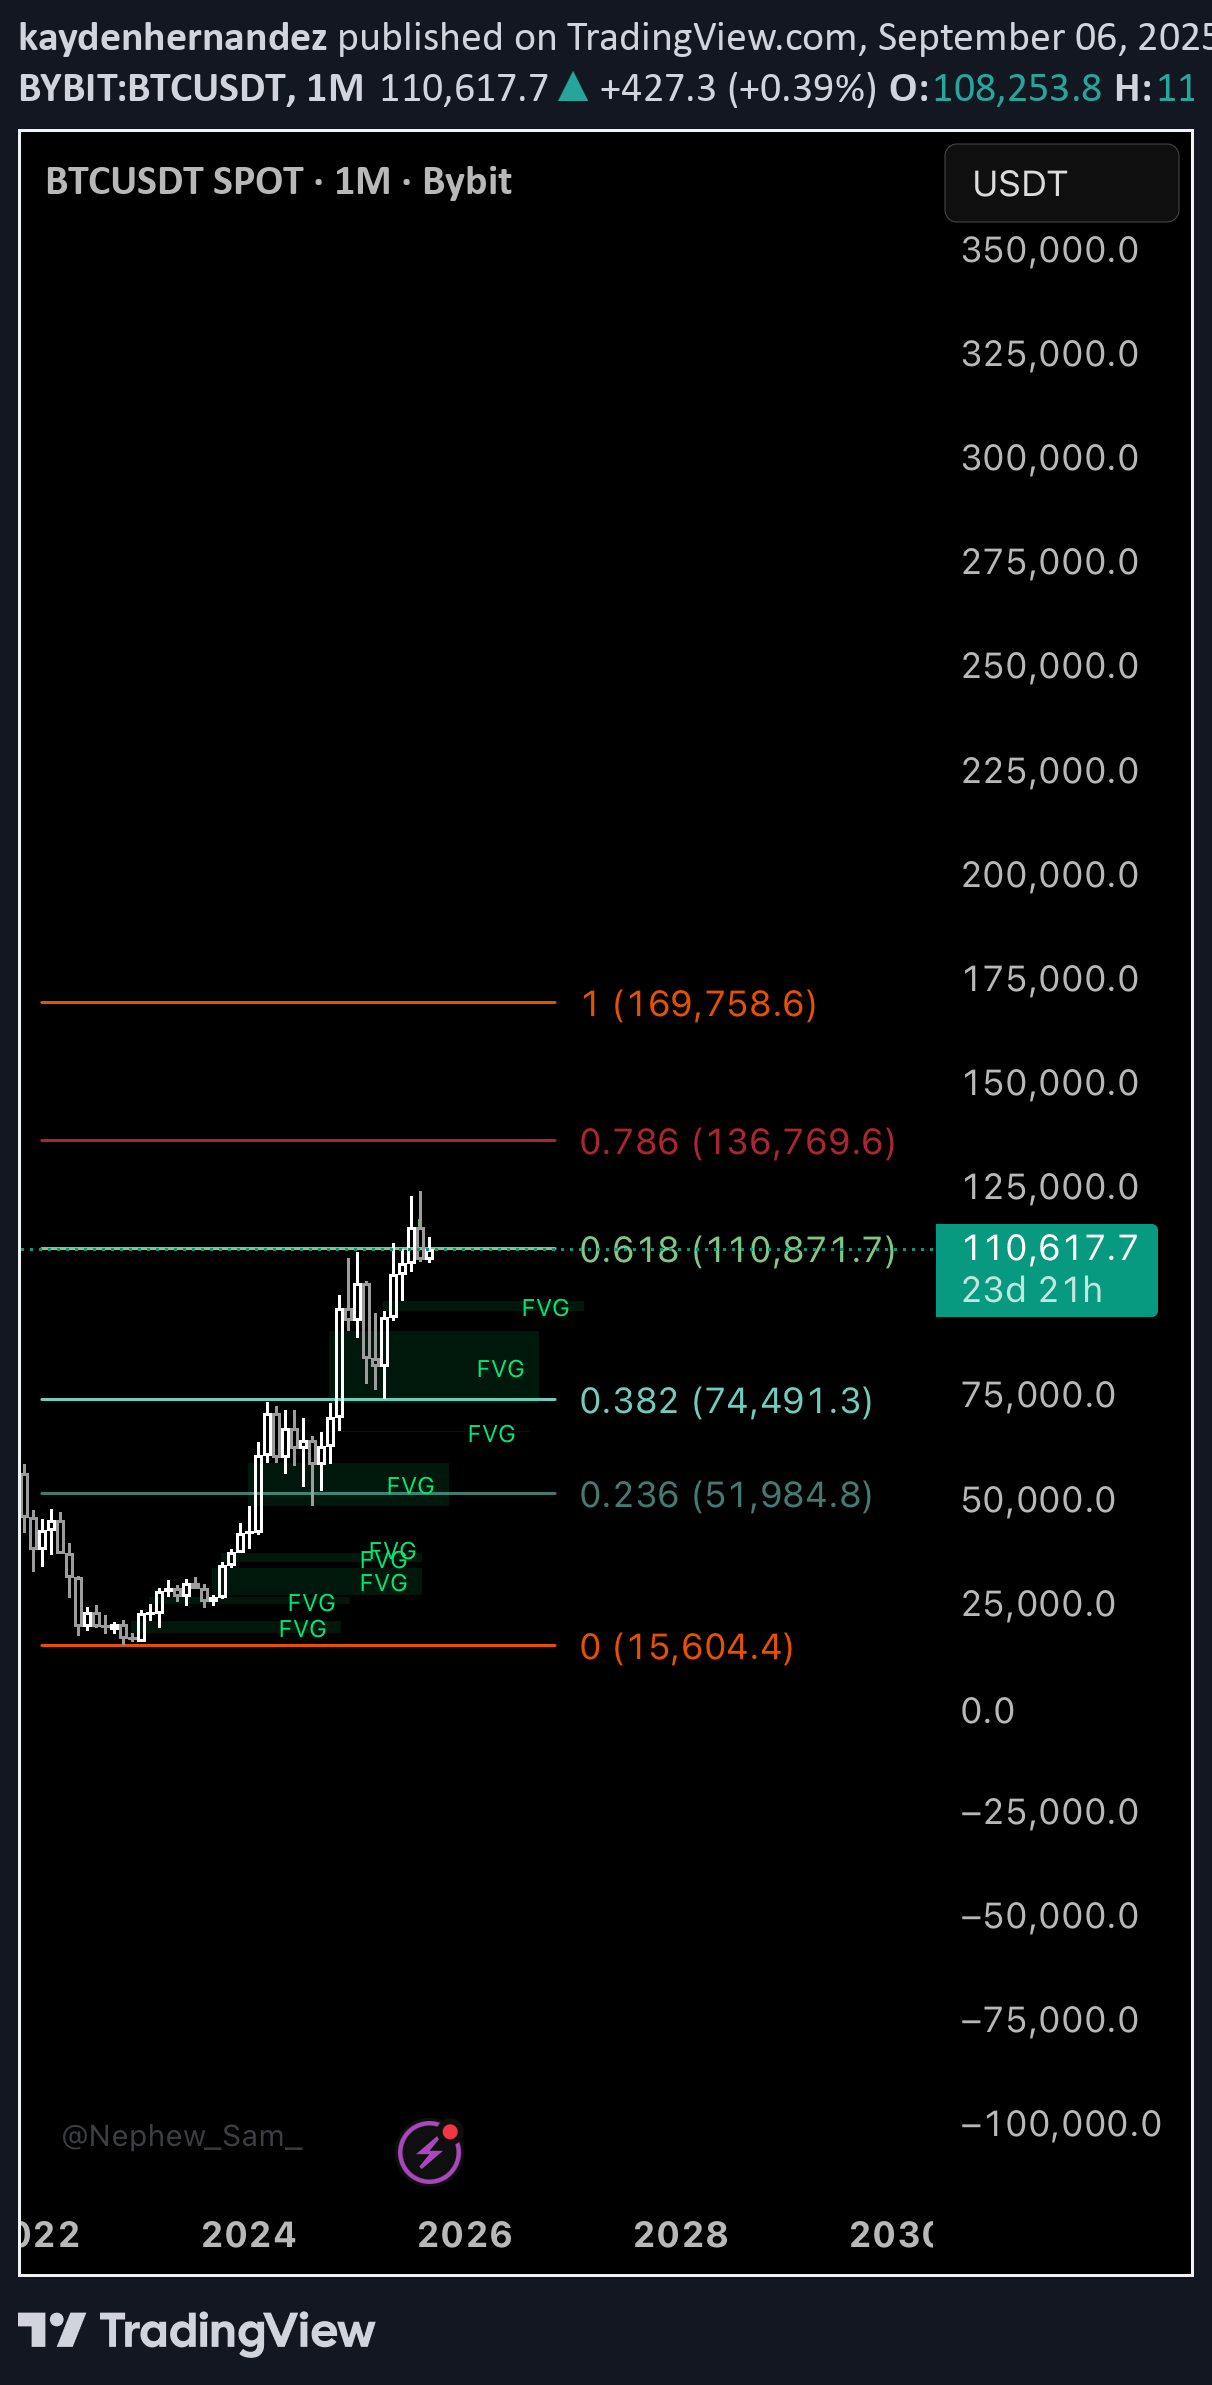
I’ve been testing a Fibonacci projection method that I believe uncovers hidden tops before they form. The premise is simple: if Fibonacci retracement levels don’t align with price action, the move isn’t finished. By adjusting the fib “top” until levels align with historical support and resistance, we can project where the true macro top should be. On Bitcoin’s monthly chart, this method points to an approximate top near $169,000. ⸻ The Theory: “Fib Alignment” •Normally, Fibonacci retracements are drawn from swing low → swing high. •But if the chosen top is not the true top, the retracement levels won’t “respect” historical pivots — price slices through or ignores them. •By dragging the fib higher until the levels snap into alignment with prior cycle resistances and supports, the eventual swing high is revealed. This isn’t classical fib usage. It behaves more like a hybrid between linear retracements and logarithmic fib extensions. ⸻ Bitcoin’s Current Setup 1.Fib from 2022 bottom → 124k (current high): •0.236, 0.382, and 0.618 do not align with key monthly levels. •Market structure feels “off.” 2.Fib from 2022 bottom → 169k projected top: •0.236 (~120k) matches current resistance zone. •0.382 (~85k–90k) aligns with prior rejection/support. •0.618 (~55k–57k) = dead-on with the 2021 cycle top. •0.786 (~39k) = historically critical demand zone. When extended to ~$169k, the fib levels align perfectly across the monthly structure — retroactively validating the projection. ⸻ Confluence With Log Extensions Interestingly, this “alignment top” also corresponds with the 0.618 extension target on log-scale fibs, which many traders use as long-term take-profit levels. In other words: •My method (drag until aligned) •Classical log fib extensions …both converge around $169,000 BTC. ⸻ Implications •If this framework holds, BTC’s current move is not complete. •A macro cycle top around $169k is the level where Fibonacci alignment finally “snaps into place.” •After such a top, retracements to 0.382, 0.5, and 0.618 would define the next bear market structure. ⸻ Conclusion This “Fib Alignment Theory” is experimental, but backtesting shows creepy accuracy on multiple assets and timeframes. Bitcoin’s monthly chart strongly suggests the true macro top lies around $169,000. If price respects this projection, the market will have validated a powerful new way to use Fibonacci — one that looks forward, not backward.
