
karaco2022
@t_karaco2022

What symbols does the trader recommend buying?
Purchase History
پیام های تریدر
Filter
karaco2022
ZEC Technical Outlook – Can It Reach $80?

ZEC Technical Outlook – Can It Reach $80? Can ZEC reach the $80 level, implying a +60% potential gain? It’s possible — but there are key resistance and support levels to watch closely. The first major resistance lies around $55, which might be tested soon. However, there is also a possibility of a fake breakout above this level, followed by a short-term correction. In such a case, price could pull back toward the $40 support zone, which may act as a stronger base for a more sustainable move to the upside. 📈 For now, the trend remains bullish, but price action around $55 will be critical in shaping the next move. 📌 This analysis is for educational and informational purposes only and does not constitute financial advice. 📝 Follow for more updates on ZEC and other crypto assets.ZEC Update – Testing Key Resistance ZEC has now reached the key resistance zone, and there is a possibility of a fake breakout before a potential correction. If you entered based on the previous analysis, this could be a good moment to consider partial profit-taking (secure some gains). However, if the resistance is broken with strong confirmation, the price may continue to rise without a significant pullback. 📌 As always, price action around resistance levels will provide more clarity in the coming sessions. 📘 This update is for educational purposes only and does not constitute financial advice.
karaco2022
SPX Technical Analysis – Bullish Structure
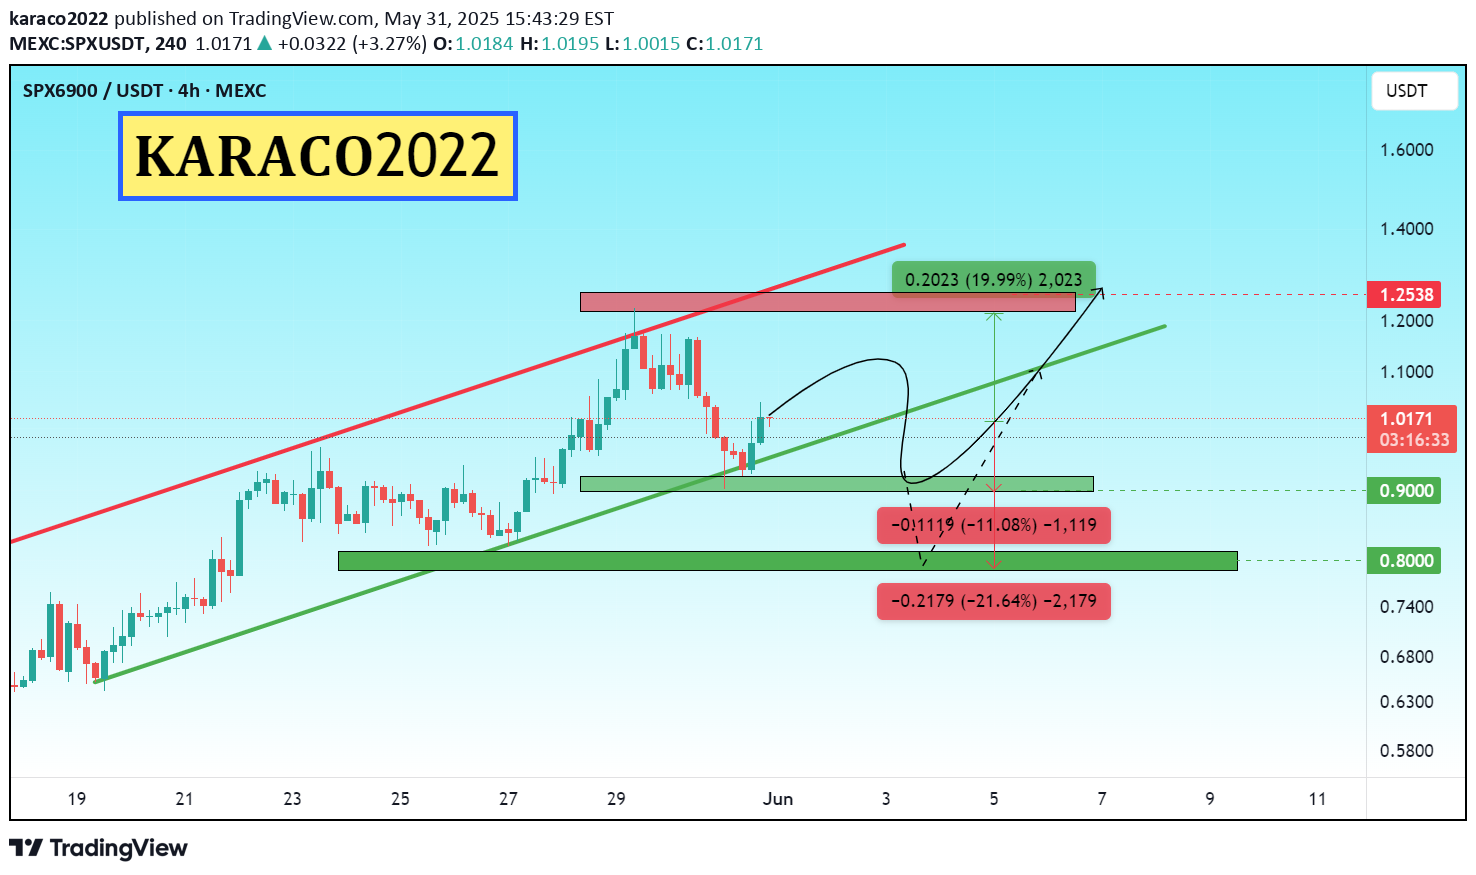
SPX Technical Analysis – Bullish Structure The overall trend of SPX appears bullish, and based on the current structure, the asset shows potential for a 20% upside, with a possible move toward the $1.25 level. Key support zones to watch are: $0.90, which is approximately 11% below the current price $0.80, which is around 21% below and can be considered the main support As long as the price holds above these key levels and the bullish trend remains intact, the outlook stays optimistic for further upward continuation. 📌 This analysis is for educational and informational purposes only and does not constitute financial advice. 📝 Follow for more updates on SPX and other assets🔄 SPX Update – Target Reached SPX has now reached the previously mentioned target. Those who entered based on the earlier analysis may consider securing some profits at this level. The key support zone mentioned earlier remains valid and intact. There is a chance that SPX may pull back from this resistance area and retest the support zone below. As long as the support holds, it can still act as a strong base for future price action. On the other hand, if the current resistance is broken with confirmation, we could see further upside movement from here. 📘 This update is for informational purposes only and not financial advice. 📝 Follow for further SPX updates and crypto analysis.
karaco2022
Bitcoin Monthly Outlook – Long-Term Perspective

Bitcoin Monthly Outlook – Long-Term Perspective Regardless of the daily fundamental noise—ranging from institutional interest to global policy shifts—technical analysis also supports the possibility of further growth in Bitcoin over the long term. Currently, Bitcoin remains in its primary bullish trend and is still moving within a rising channel structure. Even if a pullback occurs toward the $39,000 level, the overall trend structure would remain intact, and the risk-to-reward ratio could still be considered favorable (approximately 4:1 in this context). Of course, the market is driven by probabilities, and deeper corrections are always possible. However, both positive news and technical structure continue to signal a potential continuation of the upward movement. 📌 Based on this structure, key long-term support levels to watch are: $70.000 $50,000 $40,000 📌 This analysis is for educational and informational purposes only and does not constitute financial advice. 📝 Follow for updates and long-term crypto insights.
karaco2022
PEPE Technical Analysis – Daily Timeframe

PEPE Technical Analysis – Daily Timeframe PEPE is currently forming two strong bullish technical patterns, both suggesting significant upside potential if a key resistance level is broken with confirmation. 📌 Scenario 1 : Bullish Flag Pattern If the price breaks and holds above the $0.00001500 resistance on the daily timeframe, the bullish flag pattern may become active. This pattern projects a potential move toward the $0.00003000 level, which aligns with the previous all-time high (ATH). 📈 Estimated upside: +90% from the current price. 📌 Scenario 2 : Cup Formation In the broader structure, PEPE appears to be forming a cup pattern. A confirmed breakout above $0.00001500 could open the door to a new all-time high around the $0.00004000 level. 📈 Estimated upside: +170%, assuming full pattern completion. ✅ In both scenarios, a strong breakout above $0.00001500 with volume is the key condition for bullish continuation. Until then, short-term volatility or consolidation remains possible. 📌 This analysis is for educational and informational purposes only and does not constitute financial advice. This cryptocurrency has two key support levels. As long as the price remains above these supports, there is still hope for a potential reversal and continuation of the uptrend. The first support is at $0.00001200 The second support is at $0.00001050 📝 Follow me for updates and more crypto analyses.
karaco2022
JUP Technical Analysis – Daily Timeframe

JUP Technical Analysis – Daily Timeframe Currently, JUP is in a corrective phase. To confirm a trend reversal, the price needs to break above the key resistance at $0.60 with strong momentum. 🔸 There is a possibility of a move toward this level and even a false breakout, but for a safer entry, a valid breakout with strong volume is preferred. If the price fails to break this resistance, a pullback toward lower support levels may occur: The first support lies around $0.47 on the 4-hour timeframe. In a more bearish scenario, the price might drop to the daily support at $0.40, which is roughly 25% below the current level. 🔄 However, a bullish reaction from these support zones could potentially reignite the upward trend. 📝 This analysis will be updated as the chart develops. Stay tuned.Upon reaching the aforementioned resistance, there is a possibility of correction for this currency. If you make a profit, it is better to save your profit because there is a possibility of correction.
karaco2022
FET/USDT – Daily Technical Analysis

FET/USDT – Daily Technical Analysis On the daily chart , FET has key weekly support at $0.340 and weekly resistance at $2.00. After a strong upward move, the price has now reached the top of its descending trendline, which may lead to a potential short-term correction. This correction could extend down to the daily support level at $0.50, which is around 20% below the current price. However, if the price manages to break above the daily resistance at $0.80, it would signal bullish continuation, with a short-term target at $1.00. 🟢 Support Levels: $0.50 (daily support – potential correction target) $0.340 (weekly support – major long-term level) 🔴 Resistance Levels: $0.80 (daily resistance – key breakout level) $1.00 (initial bullish target after breakout) $2.00 (weekly resistance – major long-term barrier)It reached its resistance level at 0.800 and a correction is possible.
karaco2022
On the zero line of the border

ACTUSDT – Daily Technical Analysis After experiencing a 74% correction, ACT has reached a major support level at $0.0480 , where the price has currently stabilized. From this zone, there is a potential upside move of 26%, targeting the resistance at $0.0650. However, traders should closely monitor the support level, as a confirmed breakdown below $0.0480 could trigger a bearish flag continuation pattern, potentially leading to another 74% drop. 🟢 Support: $0.0480 (major level) 🔴 Resistance: $0.0650 (26% above current price) ⚠️ Risk: Breakdown could activate a bearish flag and resume the downtrendThis cryptocurrency reached its target and grew by 26%. You can save your profit and hold this cryptocurrency. There is also a possibility of its correction now.
karaco2022
Flight wish for TRX currency

TRXUSDT – 4H Technical Analysis TRON is showing signs of a potential bullish move on the 4-hour chart, with upside potential of around 2%, targeting the $0.25 resistance level. Once this key resistance is tested, the analysis should be updated to reflect the next possible direction. The main support level lies at $0.2428, which aligns with the bottom of the ascending channel and also acts as a static support zone in this timeframe. 🟢 Support: $0.2428 (channel support + static support) 🔴 Resistance: $0.25 (short-term target)An unprecedented growth and touching of the target was said. You can save your profit and stay with this currency. There is a possibility of correction now.
karaco2022
ONDOUSDT – Short-Term Technical Outlook

ONDOUSDT – Short-Term Technical Outlook ONDO is currently bouncing from its key support level, indicating a possible short-term upside move of 3.67%, targeting the $0.8854 resistance. If the price breaks above this resistance with strength, the bullish outlook could extend further, and the analysis will be updated accordingly. The nearest support zone lies at $0.8213, which is approximately 3.84% below the current price and could act as a secondary entry level in case of a pullback. 🟢 Support: $0.8213 🔴 Resistance: $0.8854Wow, this currency has made a lot of profit and as we said, we saw its growth continue after the resistance was broken. Now save your profit and you can be with this currency. But there is a possibility of its correction.
karaco2022
TRUMPUSDT – Daily Technical Analysis

TRUMPUSDT – Daily Technical Analysis The price has reached a key daily support level at $10, showing potential signs of a bullish reversal. If the support holds, we may see a move toward the resistance area around $14, offering a decent upside opportunity. In a more bearish scenario, the price could extend its correction to the $9 support zone, which may serve as a stronger foundation for the next upward impulse. 🟢 Key Support Levels: $10 (daily), $9 (secondary support) 🔴 Resistance Zone: $14 Stay tuned for more technical insights and updates.This cryptocurrency has not yet reached the target we mentioned, but it has the potential to grow further. You can save your profits now.🎯 TRUMP Update – Analysis Played Out Perfectly! You're now witnessing a spot-on analysis for TRUMP – the price followed the plan exactly as expected and has successfully hit the target. If you’ve been following our analyses, you know how much we value technical accuracy and discipline. 🔔 For more updates like this, feel free to follow and support the page — your engagement helps us keep sharing quality content! 📘 This update is for informational and educational purposes only and is not financial advice.
Disclaimer
Any content and materials included in Sahmeto's website and official communication channels are a compilation of personal opinions and analyses and are not binding. They do not constitute any recommendation for buying, selling, entering or exiting the stock market and cryptocurrency market. Also, all news and analyses included in the website and channels are merely republished information from official and unofficial domestic and foreign sources, and it is obvious that users of the said content are responsible for following up and ensuring the authenticity and accuracy of the materials. Therefore, while disclaiming responsibility, it is declared that the responsibility for any decision-making, action, and potential profit and loss in the capital market and cryptocurrency market lies with the trader.