
joerivdpol
@t_joerivdpol
What symbols does the trader recommend buying?
Purchase History
پیام های تریدر
Filter
Signal Type

joerivdpol
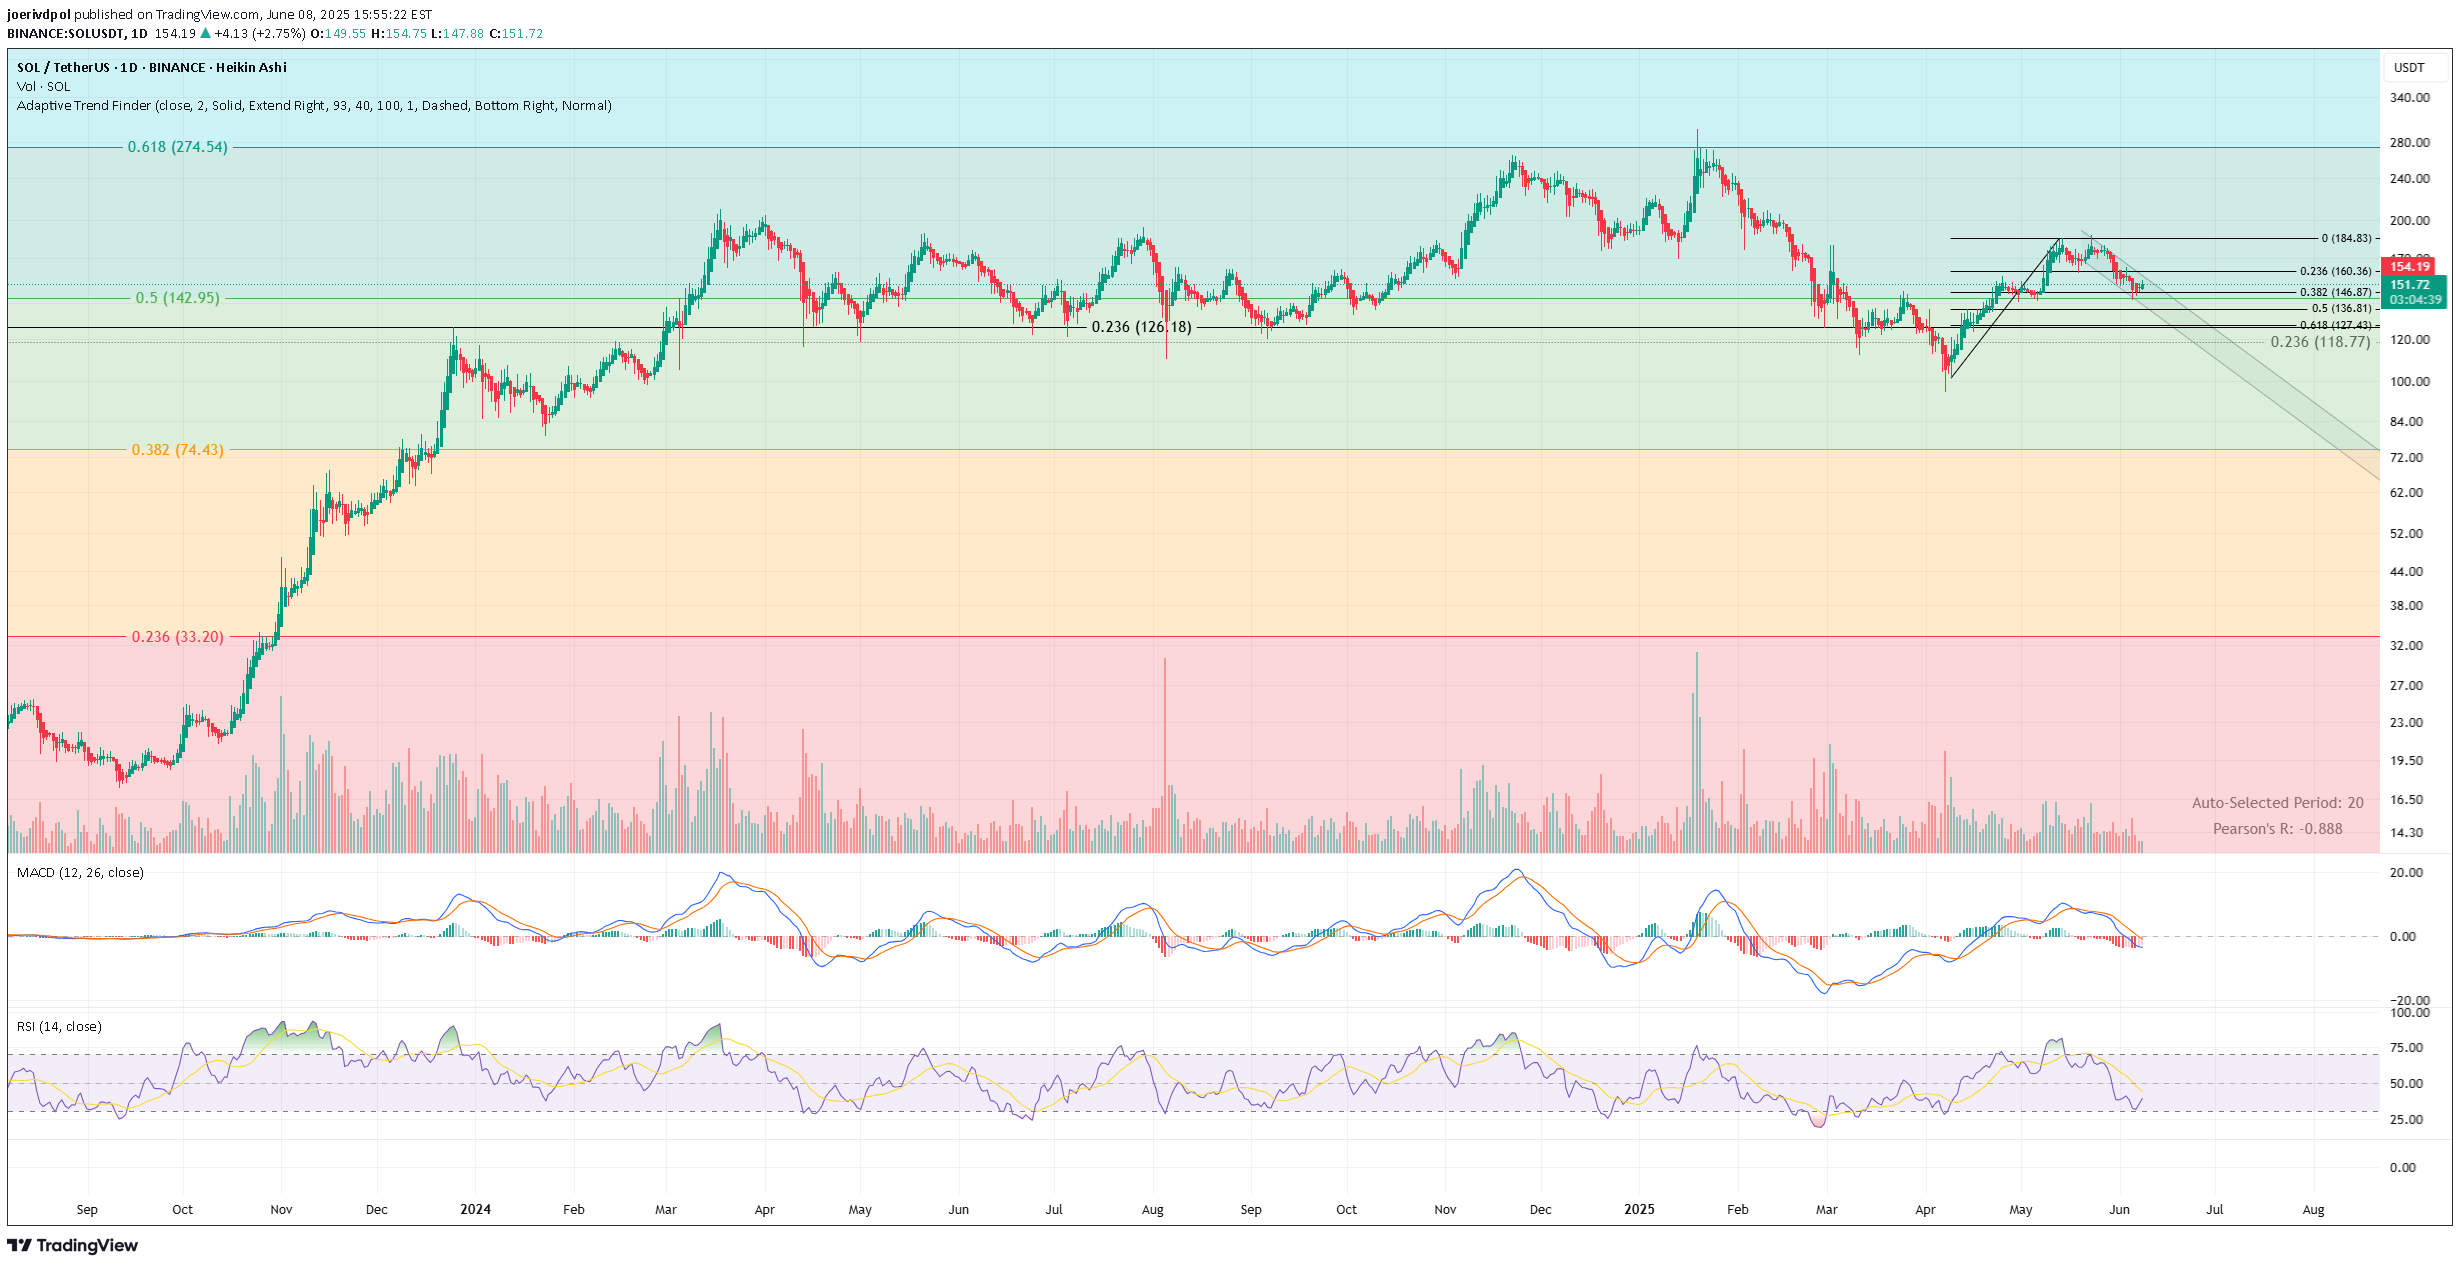
📊 SOL Daily Chart Price bounced from confluence support around $126 (0.236 fib + local structure), but remains below all key retracements from the $184 high. – RSI hovering around 39 → oversold but no bullish divergence – MACD still below signal line, weak momentum – Structure remains inside a descending channel BTC is testing $106K into weekly close. If Bitcoin confirms a breakout, SOL could follow with a push above $160.3 (0.236 fib). Reclaim of $160 → $184 next Failure → $126 retest, with risk of break toward $118 Trend bias: bearish → neutral Watching BTC for confirmation.📊 SOL 4H Chart Price broke out of the descending channel with a strong push above the 0.382 retracement ($146.8). Now facing initial resistance at $160.3 (0.236 of full move down). – RSI rising to 58.6 with room to expand – MACD bullish crossover, momentum building – Volume increasing slightly on breakout attempt Break and close above $160.3 → opens up $172 and $184 Rejection = likely retest of $146–148 zone Short-term momentum favoring bulls, but confirmation requires a clean 4H close above $160.📊 SOL Weekly Chart Price currently ~$154 — hovering below key resistance near $160, and holding well above the 0.236 Fib retracement ($138.11). – RSI = 52.3 → neutral, slightly rising – MACD crossing upward, early bullish momentum – Structure still trending upward since 2023, higher lows intact A weekly close above $160 would break local downtrend and unlock targets at $188 and $203. Break below $138 = structural damage, $126 next support. Bias = neutral → bullish if $160 flips to support Watching Bitcoin for confirmation.📅 SOL Monthly Chart Price is holding the 0.5 Fibonacci extension ($142.95) after rejection from the 0.618 level ($274.5). – RSI = 55.6 → mid-range, trending sideways – MACD still red but flattening – Heikin Ashi candles suggest slowing momentum, not reversal $142 = key monthly support Break and hold above $160 → flips structure back to bullish continuation Bias: long-term bullish above $126, but momentum needs confirmation Eyes on Bitcoin monthly close to confirm trend acceleration.

joerivdpol
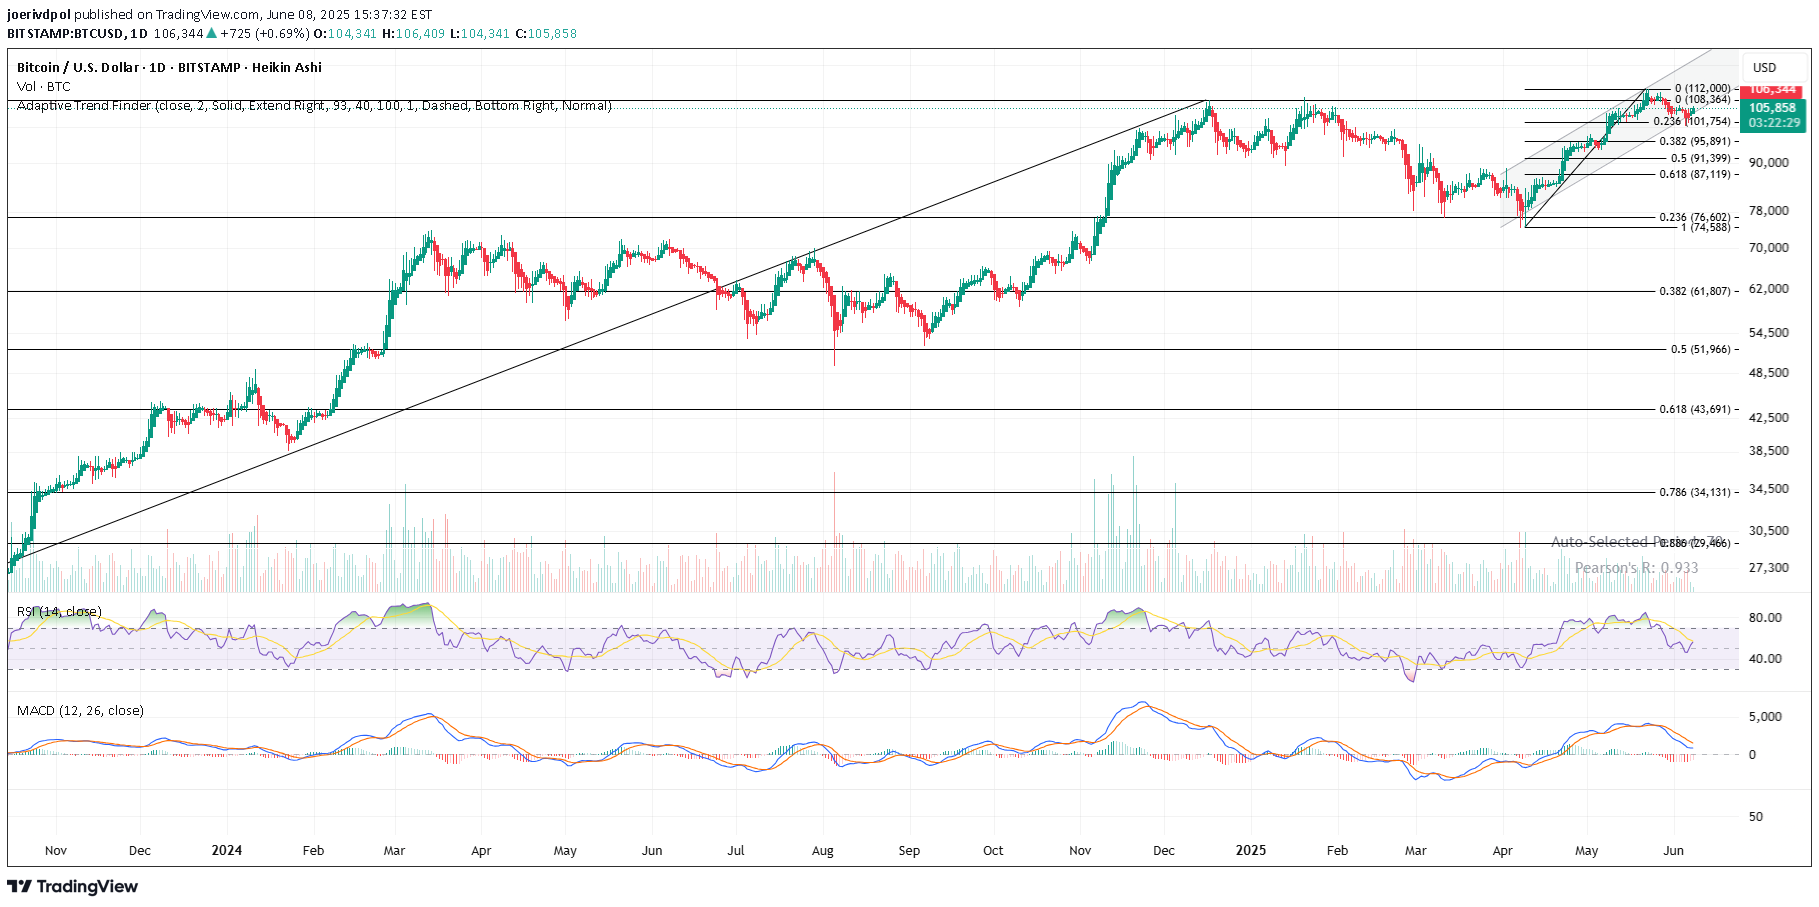
📊 BTC Daily Chart Price bounced cleanly off the 0.236 Fibonacci retracement at $104.6 and is now pressing into local resistance. – Heikin Ashi candles turned green – RSI is curling upward – MACD remains weak, no confirmation yet Key levels: → Break above $106.3 could open the way to $112K → Drop below $104.6 puts $100K back in play 📅 All eyes on tonight’s weekly close. A candle close above $106K would confirm strength into next week.📊 BTC 4H Chart Bullish momentum accelerating into diagonal resistance around $106.3. RSI rising with room to run; MACD just crossed up. Price trades inside a rising channel after reclaiming $101.75 support. Break → $108.3 / $112K Rejection → $104.6 retest Weekly close tonight could seal the direction.📊 BTC Weekly Chart Price rejected at ~$106.3, the local top of the rising channel and key horizontal resistance. – RSI at 66 → approaching overbought, but no divergence – MACD trending higher with solid momentum – Heikin Ashi candles remain green and rising Structure remains bullish as long as $100K holds. Weekly close above $106K would confirm continuation toward $112K and beyond. Key support: $100K Key breakout level: $106.3📆 BTC Monthly Chart Momentum remains strong with consistent green Heikin Ashi candles and a clear uptrend channel. – TD Sequential count: 6 green bars, no exhaustion yet – RSI at 75.9 → overbought, but stable – MACD remains strongly bullish with wide spread and rising histogram Price is riding the upper trendline of the long-term channel. Break and monthly close above $108K would position BTC for a new ATH run. Current structure remains bullish unless price breaks below $92K on a monthly close.

joerivdpol
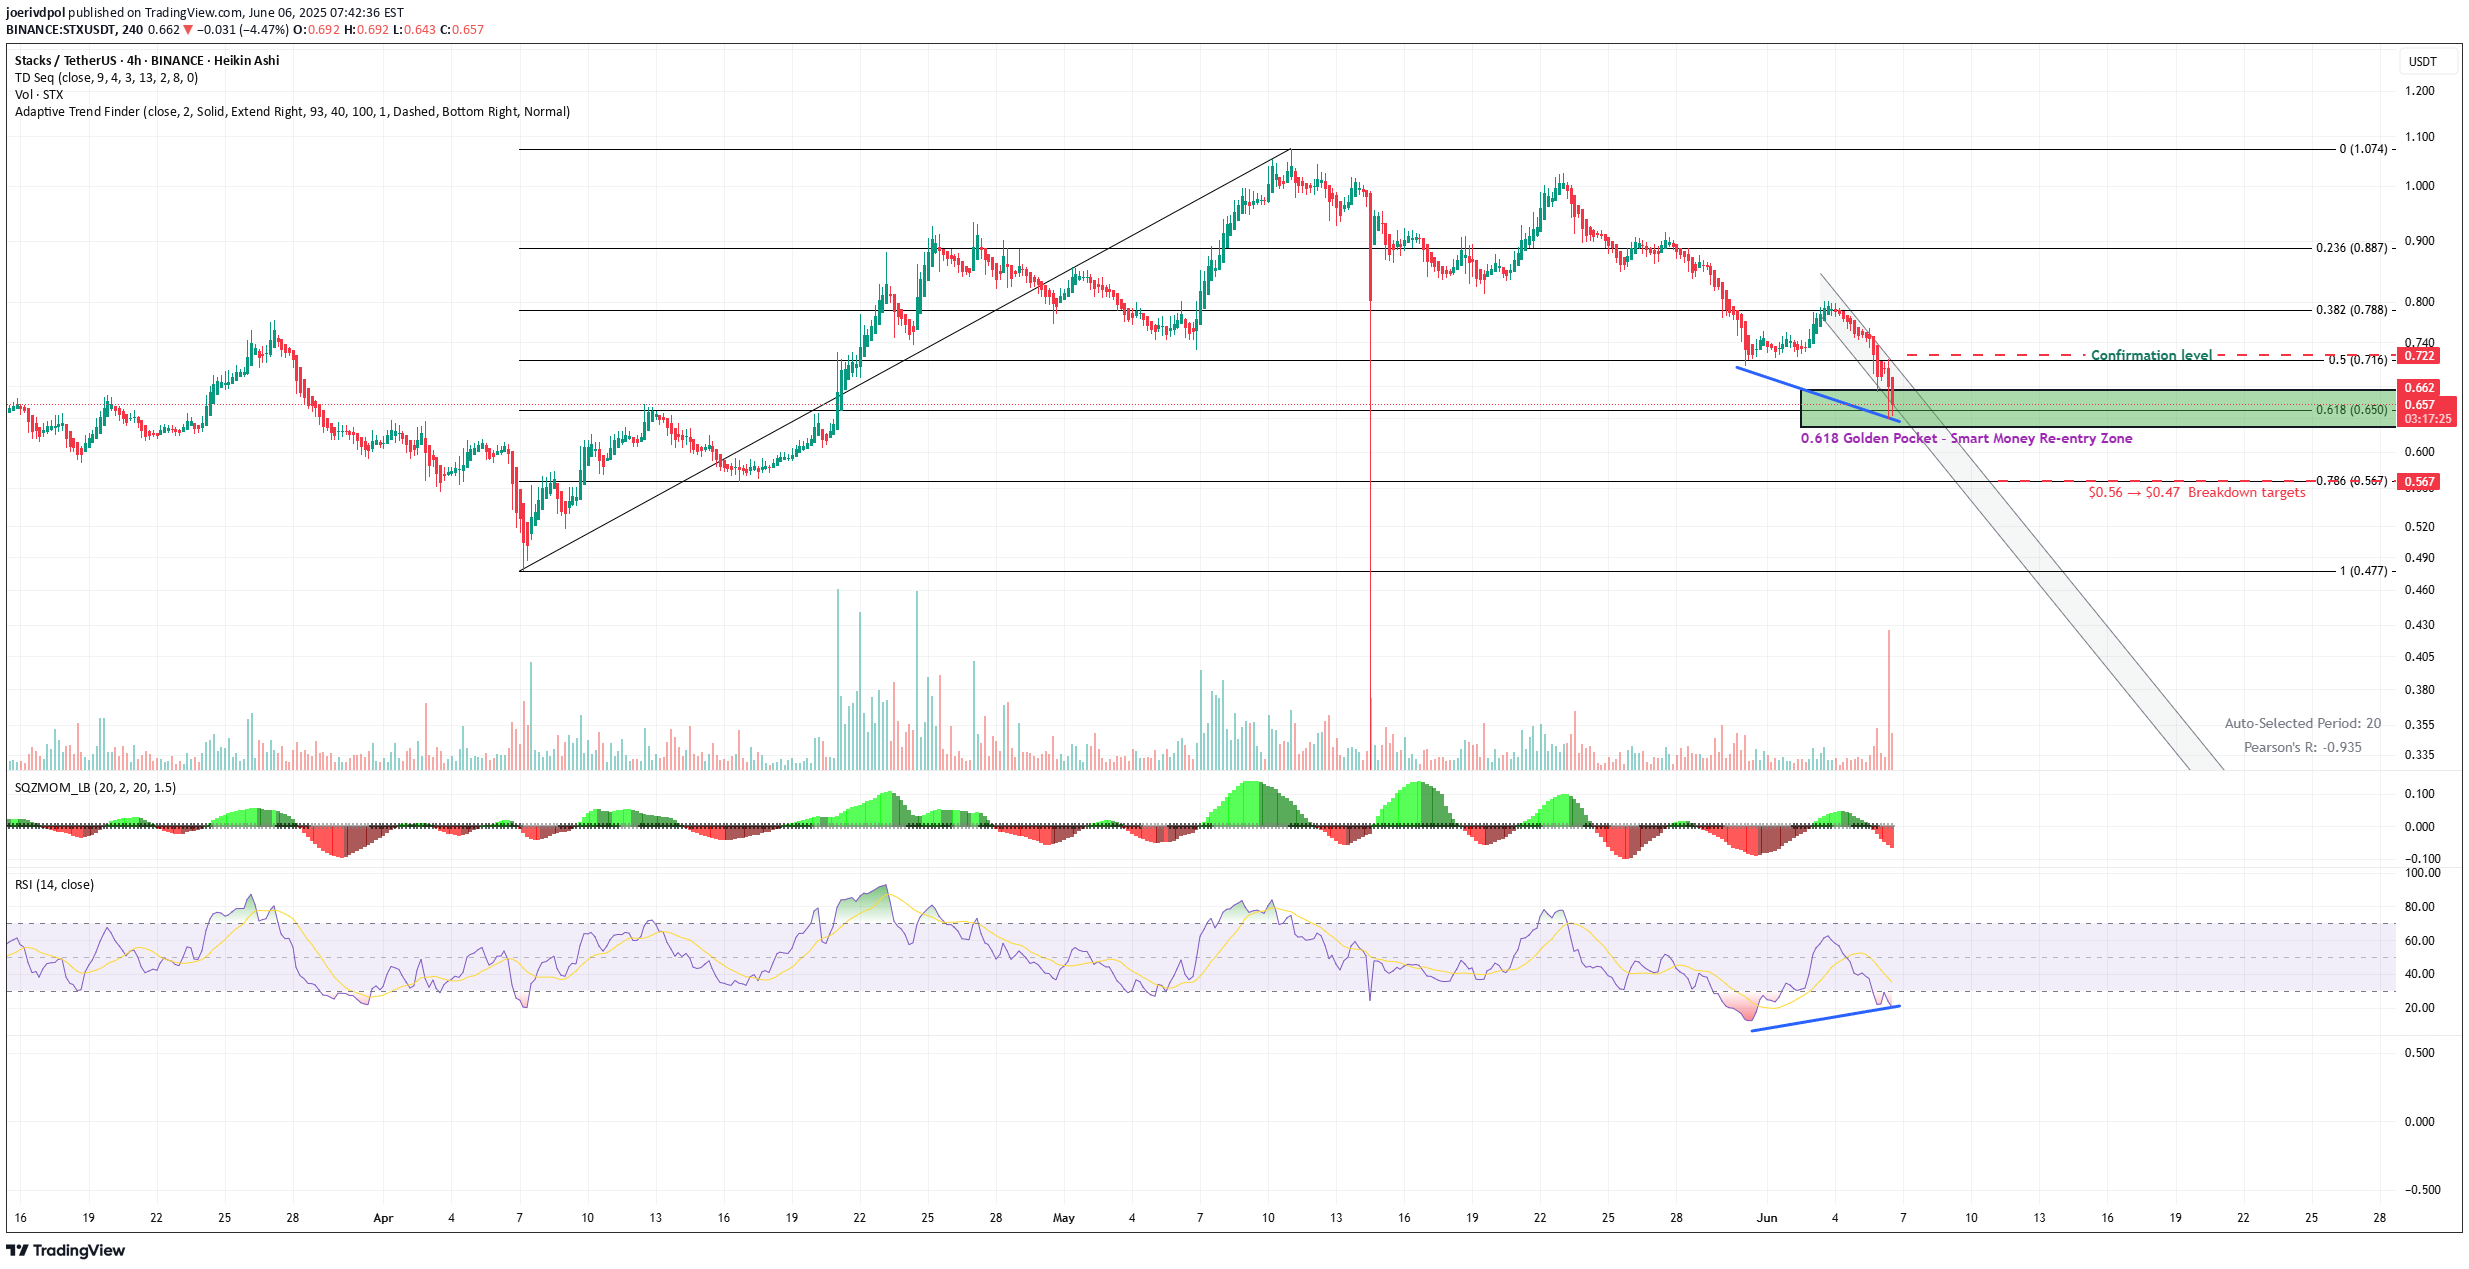
STXUSD is testing the 0.618 Fib retracement ($0.65) A zone where smart money often re-enters after corrections. Confluence: 🔹 TD9 buy 🔹 RSI divergence 🔹 Fading momentum 🔹 Volume pickup near support = early demand? Reclaim $0.72 could trigger a relief rally to $0.78–$0.80 Break $0.65 opens $0.56 and $0.47.

joerivdpol
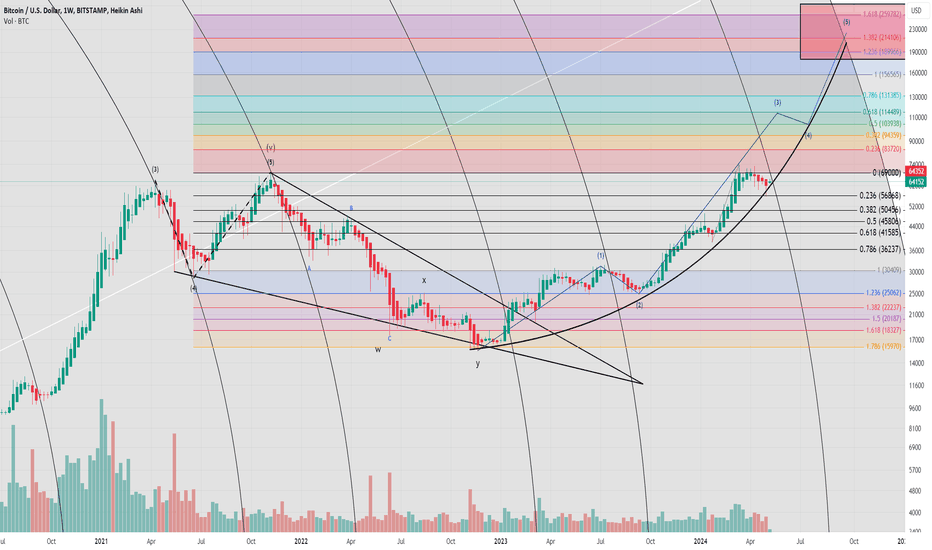
Here's a wallpaper for you to print out and hang above your bed, doubling as a piece of art and guaranteeing a good night's sleep. Bull market 2024. I have mentioned this idea previously beginning 2023 and was first mentioned here: https://www.tradingview.com/chart/BTCUSD/f8Y94TMX-Exciting-times-ahead-for-Bitcoin/ tradingview.com/x/89xHQFsZ]https://www.tradingview.com/x/89xHQFsZ I nailed my prediction on April 15th on another platform, which I can't mention, when Bitcoin was trading at $66,762, at which point I exclaimed: "weekly chart keeps saying no to $69,000 for five weeks now. The daily chart is struggling with its important $62,300 support, and it's starting to look weak. I think we're heading down again to $56,868". Pretty accurate, huh? :) BTCUSD 114k next.BTCUSD targets 🚀 - 103k - 114k - 131k -156k - 189k - 214k - 259k (cycle end: Nov '25) Stay focused. Stay humble. Stack sats and STXUSD 🟧 BTC #Stacks

joerivdpol
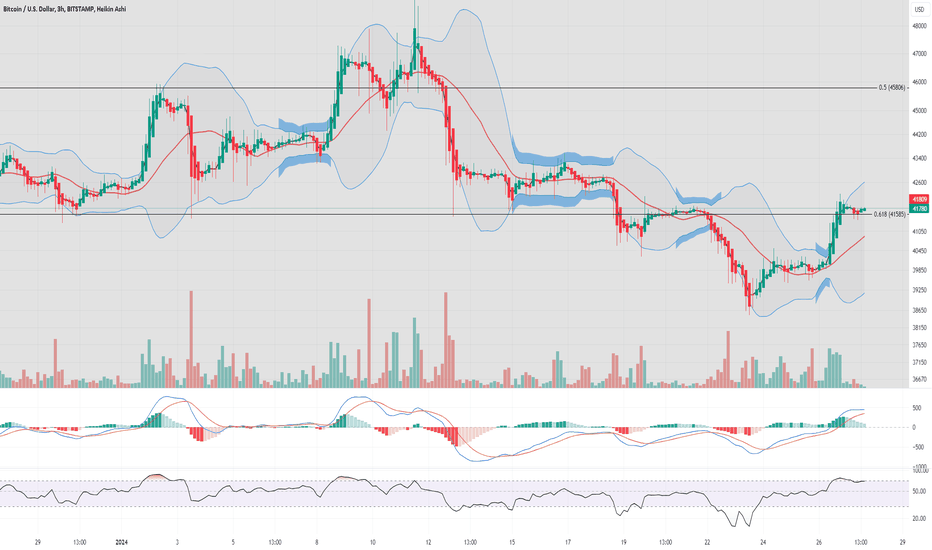
My current insights on the BTCUSD market: The 0.618 Fib is once again acting as support, signaling strength from the bulls. A short squeeze might happen soon, as it aligns with 'max pain' scenario. If this support level doesn't hold, we might see a dip towards 36K , marked as the 0.786 Fib. Weekly chart suggests this possibility, although i'm leaning more towards an upward trend now. https://www.tradingview.com/x/BMbU8POl/ The 3-day chart touched the lower Bollinger Bands, and the candles display elongated wicks, suggesting buying activity and a potential reversal point. https://www.tradingview.com/x/eqJbXpLF/ The 12-hour chart displays a MACD crossover and RSI in oversold territory, supporting my bullish outlook. https://www.tradingview.com/x/ybhobwhE/ Closing the weekly candle above $41,331 would be a significant and powerful move for BTC , highlighting the strength of the bulls 💪 https://www.tradingview.com/x/JFsGNb6H/

joerivdpol
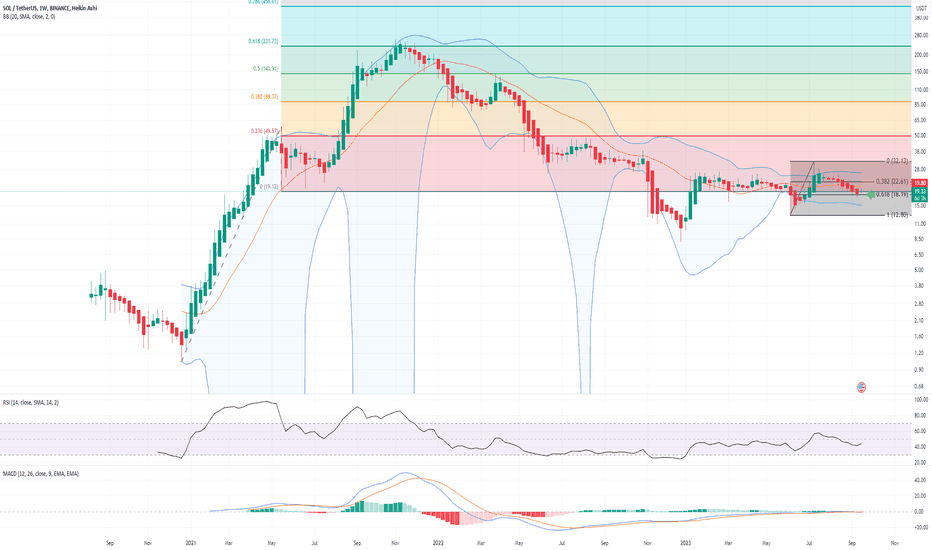
SOLUSDT is all set. We've got strong support at the 0.618 Fibonacci level. Looking back at the Fibonacci extension from the start of the first wave in early 2021 and the correction down to $19.21, we can see a crucial support zone that SOL has consistently held. In my view, this marks the start of a new upward trend for SOL , suggesting potential upward momentum and bullish opportunities for SOL in the near futureUpward trend confirmed.SOL has already made an impressive jump to $39 and is consistently advancing towards its next resistance level at $49.5. My earlier prediction was spot on with a perfect call at $19.33. SOLUSDT SOLUSDSometimes a picture is worth a thousand words.SOLUSD is almost at its all-time high. From here, it looks ready to target the next resistance at $617.

joerivdpol
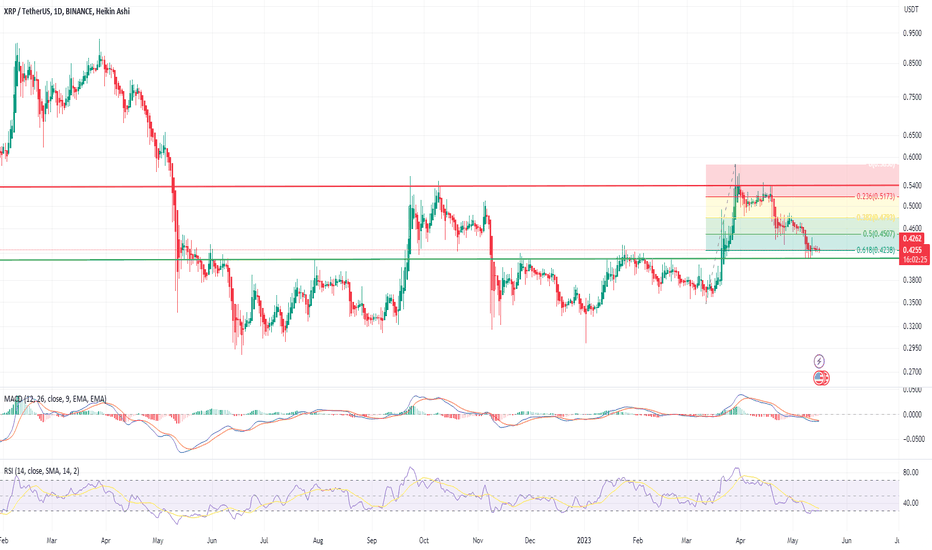
XRP/USDT: Profitable Swing Trade Potential The current price level of XRP/USDT has caught my attention, and I believe it presents a conservative entry point for a swing trade that could be profitable. Let's analyze the daily chart, where the RSI indicates oversold conditions and the MACD indicator is on the verge of a bullish crossover. But that's not all! Another significant development has unfolded: XRP has established a strong support level near the 0.618 Fibonacci Retracement. This measurement encompasses the price movement from March 13, where it reached a low of $0.34, to the high of $0.59 on March 29. Despite my reservations and aversion towards XRP, I must acknowledge that the compelling factors cannot be ignored. The enticing buying signal that is emerging has the potential to result in a profitable and conservative swing trade.

joerivdpol
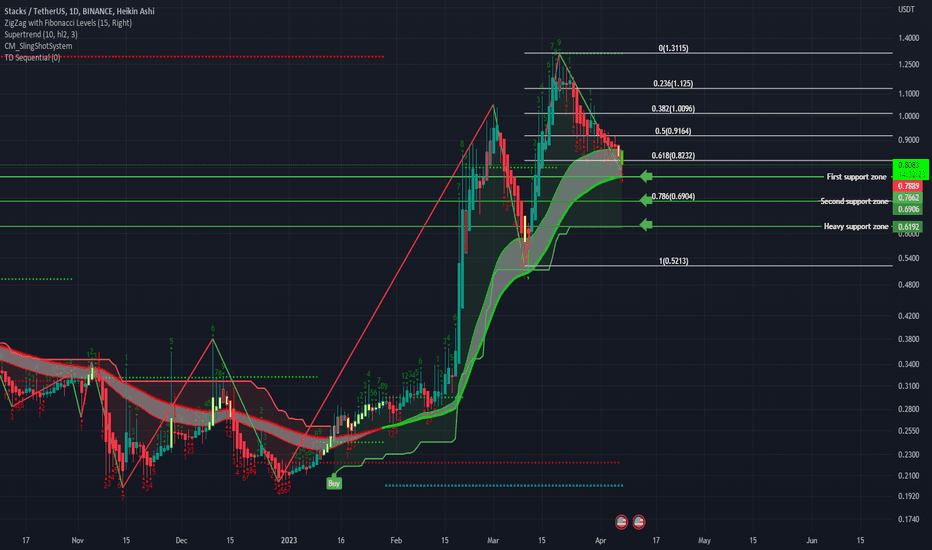
I aspire, and expect Bitcoin to recover and resume its upward movement, with STX ultimately closing the weekly candle above $0.84. Nevertheless, in technical analysis and trading, wishful thinking is not enough and holds no weight. The key is to identify conditions with a high likelihood of success. Presently, STX has fallen below $0.84 and is expected to continue its downward trend for the time being. Nonetheless, there is still hope for the short term. The 'ZigZag Fibonacci Tool' has automatically mapped out several Fibonacci levels that could potentially serve as support zones in the future (see my green arrows) Additionally, the Chris Moody Slingshot tool indicates a high probability of an upward tick around $0.77. The green candle colour suggests a conservative buying opportunity at present. Furthermore, the TD Sequential countdown to 9 on the daily chart indicates a buying opportunity as it identifies turning points in asset or index price trends, printing a TD9 after nine consecutive candles above/below the previous four candles' closing price. In conclusion, although Stacks has slipped through its support zone, favourable days are expected in the short term. The current undervaluation of STX makes it an attractive bargain.It's looking good in my opinion, so I'll share my analysis based on the current daily charts. - Bottoming at the 0.382 Fibonacci level. - RSI divergence observed from mid-April until now. - Buying volume is increasing. - MACD is on the verge of a bullish crossover. With Subnets, the Nakamoto release, and the upcoming launch of sBTC on the horizon, this gives me enough confidence that we will regain momentum in the market.Furthermore, my analysis from April 7th has played out quite well. Just press the play button and you can verify it for yourself :) We are currently situated on the heavy support zone as well. It's time for the bulls to roar again!

joerivdpol
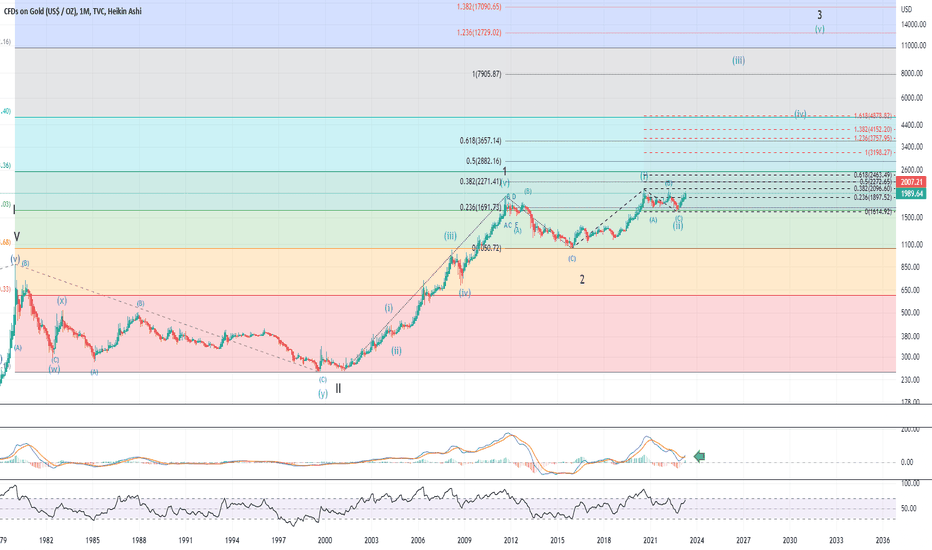
Gold is currently approaching its next Fibonacci resistance level of $2096. Once this level is convincingly broken, the next resistance levels will be $2272 and $2463. According to my Elliott wave analysis, gold has started its third impulsive wave, which is part of a higher degree third impulsive wave. These impulsive waves are typically the most explosive and long-lasting. Therefore, we can expect an exciting spectacle in the coming months. I do not rule out a short-term price target of $4878 within a year, as this price target is based on the 1.618 Fibonacci extension of the impulse wave 1 (Dec '15 - Aug '20). Lastly, the monthly chart shows a MACD crossover, which supports my bullish expectations. This typically indicates that the price of gold is expected to continue its upward trend.

joerivdpol
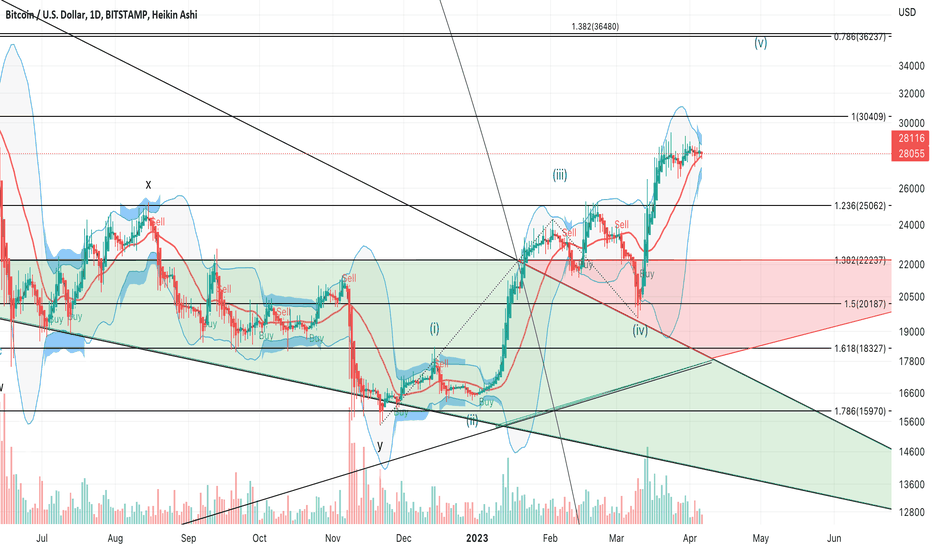
Exciting times are ahead for Bitcoin as it prepares for a potential run towards $36k. Bollinger Bands are tightening, signalling short-term volatility. My Elliot Wave analysis points towards a fifth impulse wave. Along with gold and silver breakouts, a squeeze towards $36k seems imminent, in my opinion.I bet you aren't mentally prepared for a god candle. Everyone is talking about $12k. Max pain is upside, in my opinion.Update: Bitcoin appears to be poised for a potential move. The remarkable weekly close from two weeks ago is noteworthy.Spot on.BTC 36K next.BTC - 36K ✅ - $41.5K - $45.8KBTC - 36K ✅ - $41.5K ✅ - $45.8KBTC Bullrun 2024BTC is ready for $50.500
Disclaimer
Any content and materials included in Sahmeto's website and official communication channels are a compilation of personal opinions and analyses and are not binding. They do not constitute any recommendation for buying, selling, entering or exiting the stock market and cryptocurrency market. Also, all news and analyses included in the website and channels are merely republished information from official and unofficial domestic and foreign sources, and it is obvious that users of the said content are responsible for following up and ensuring the authenticity and accuracy of the materials. Therefore, while disclaiming responsibility, it is declared that the responsibility for any decision-making, action, and potential profit and loss in the capital market and cryptocurrency market lies with the trader.