Technical analysis by joerivdpol about Symbol SOL: Buy recommendation (6/8/2025)

joerivdpol

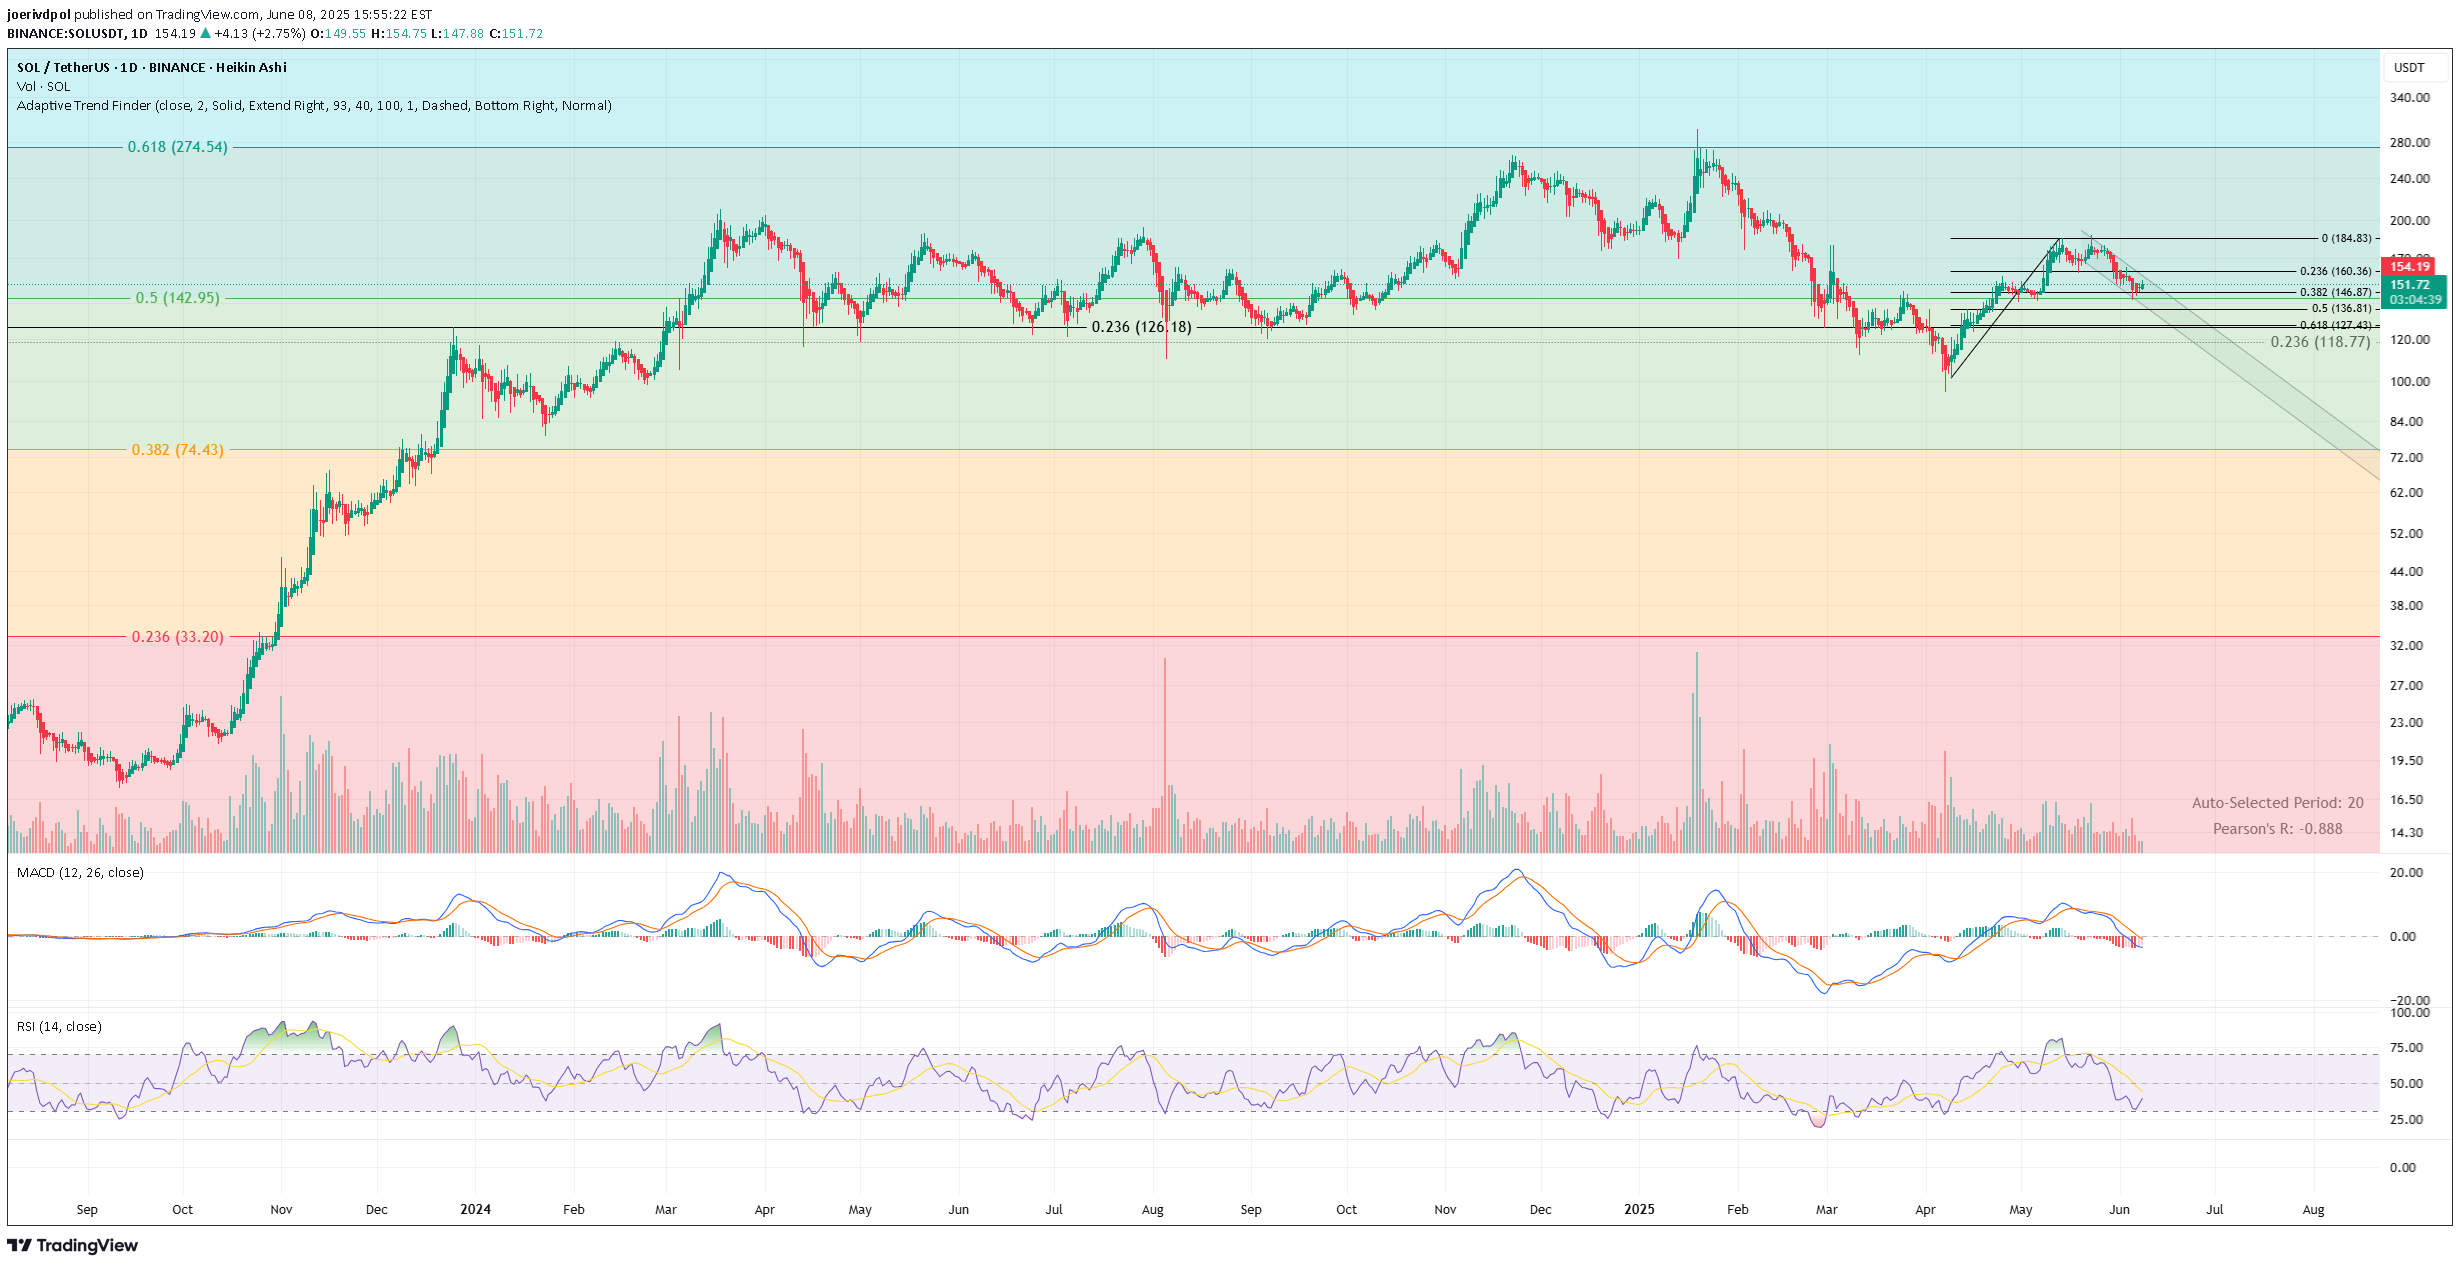
📊 SOL Daily Chart Price bounced from confluence support around $126 (0.236 fib + local structure), but remains below all key retracements from the $184 high. – RSI hovering around 39 → oversold but no bullish divergence – MACD still below signal line, weak momentum – Structure remains inside a descending channel BTC is testing $106K into weekly close. If Bitcoin confirms a breakout, SOL could follow with a push above $160.3 (0.236 fib). Reclaim of $160 → $184 next Failure → $126 retest, with risk of break toward $118 Trend bias: bearish → neutral Watching BTC for confirmation.📊 SOL 4H Chart Price broke out of the descending channel with a strong push above the 0.382 retracement ($146.8). Now facing initial resistance at $160.3 (0.236 of full move down). – RSI rising to 58.6 with room to expand – MACD bullish crossover, momentum building – Volume increasing slightly on breakout attempt Break and close above $160.3 → opens up $172 and $184 Rejection = likely retest of $146–148 zone Short-term momentum favoring bulls, but confirmation requires a clean 4H close above $160.📊 SOL Weekly Chart Price currently ~$154 — hovering below key resistance near $160, and holding well above the 0.236 Fib retracement ($138.11). – RSI = 52.3 → neutral, slightly rising – MACD crossing upward, early bullish momentum – Structure still trending upward since 2023, higher lows intact A weekly close above $160 would break local downtrend and unlock targets at $188 and $203. Break below $138 = structural damage, $126 next support. Bias = neutral → bullish if $160 flips to support Watching Bitcoin for confirmation.📅 SOL Monthly Chart Price is holding the 0.5 Fibonacci extension ($142.95) after rejection from the 0.618 level ($274.5). – RSI = 55.6 → mid-range, trending sideways – MACD still red but flattening – Heikin Ashi candles suggest slowing momentum, not reversal $142 = key monthly support Break and hold above $160 → flips structure back to bullish continuation Bias: long-term bullish above $126, but momentum needs confirmation Eyes on Bitcoin monthly close to confirm trend acceleration.