
jod45m
@t_jod45m

What symbols does the trader recommend buying?
Purchase History
پیام های تریدر
Filter
jod45m
سناریوی نزولی بیت کوین: آیا سقوط به ۷۰ هزار دلار در راه است؟
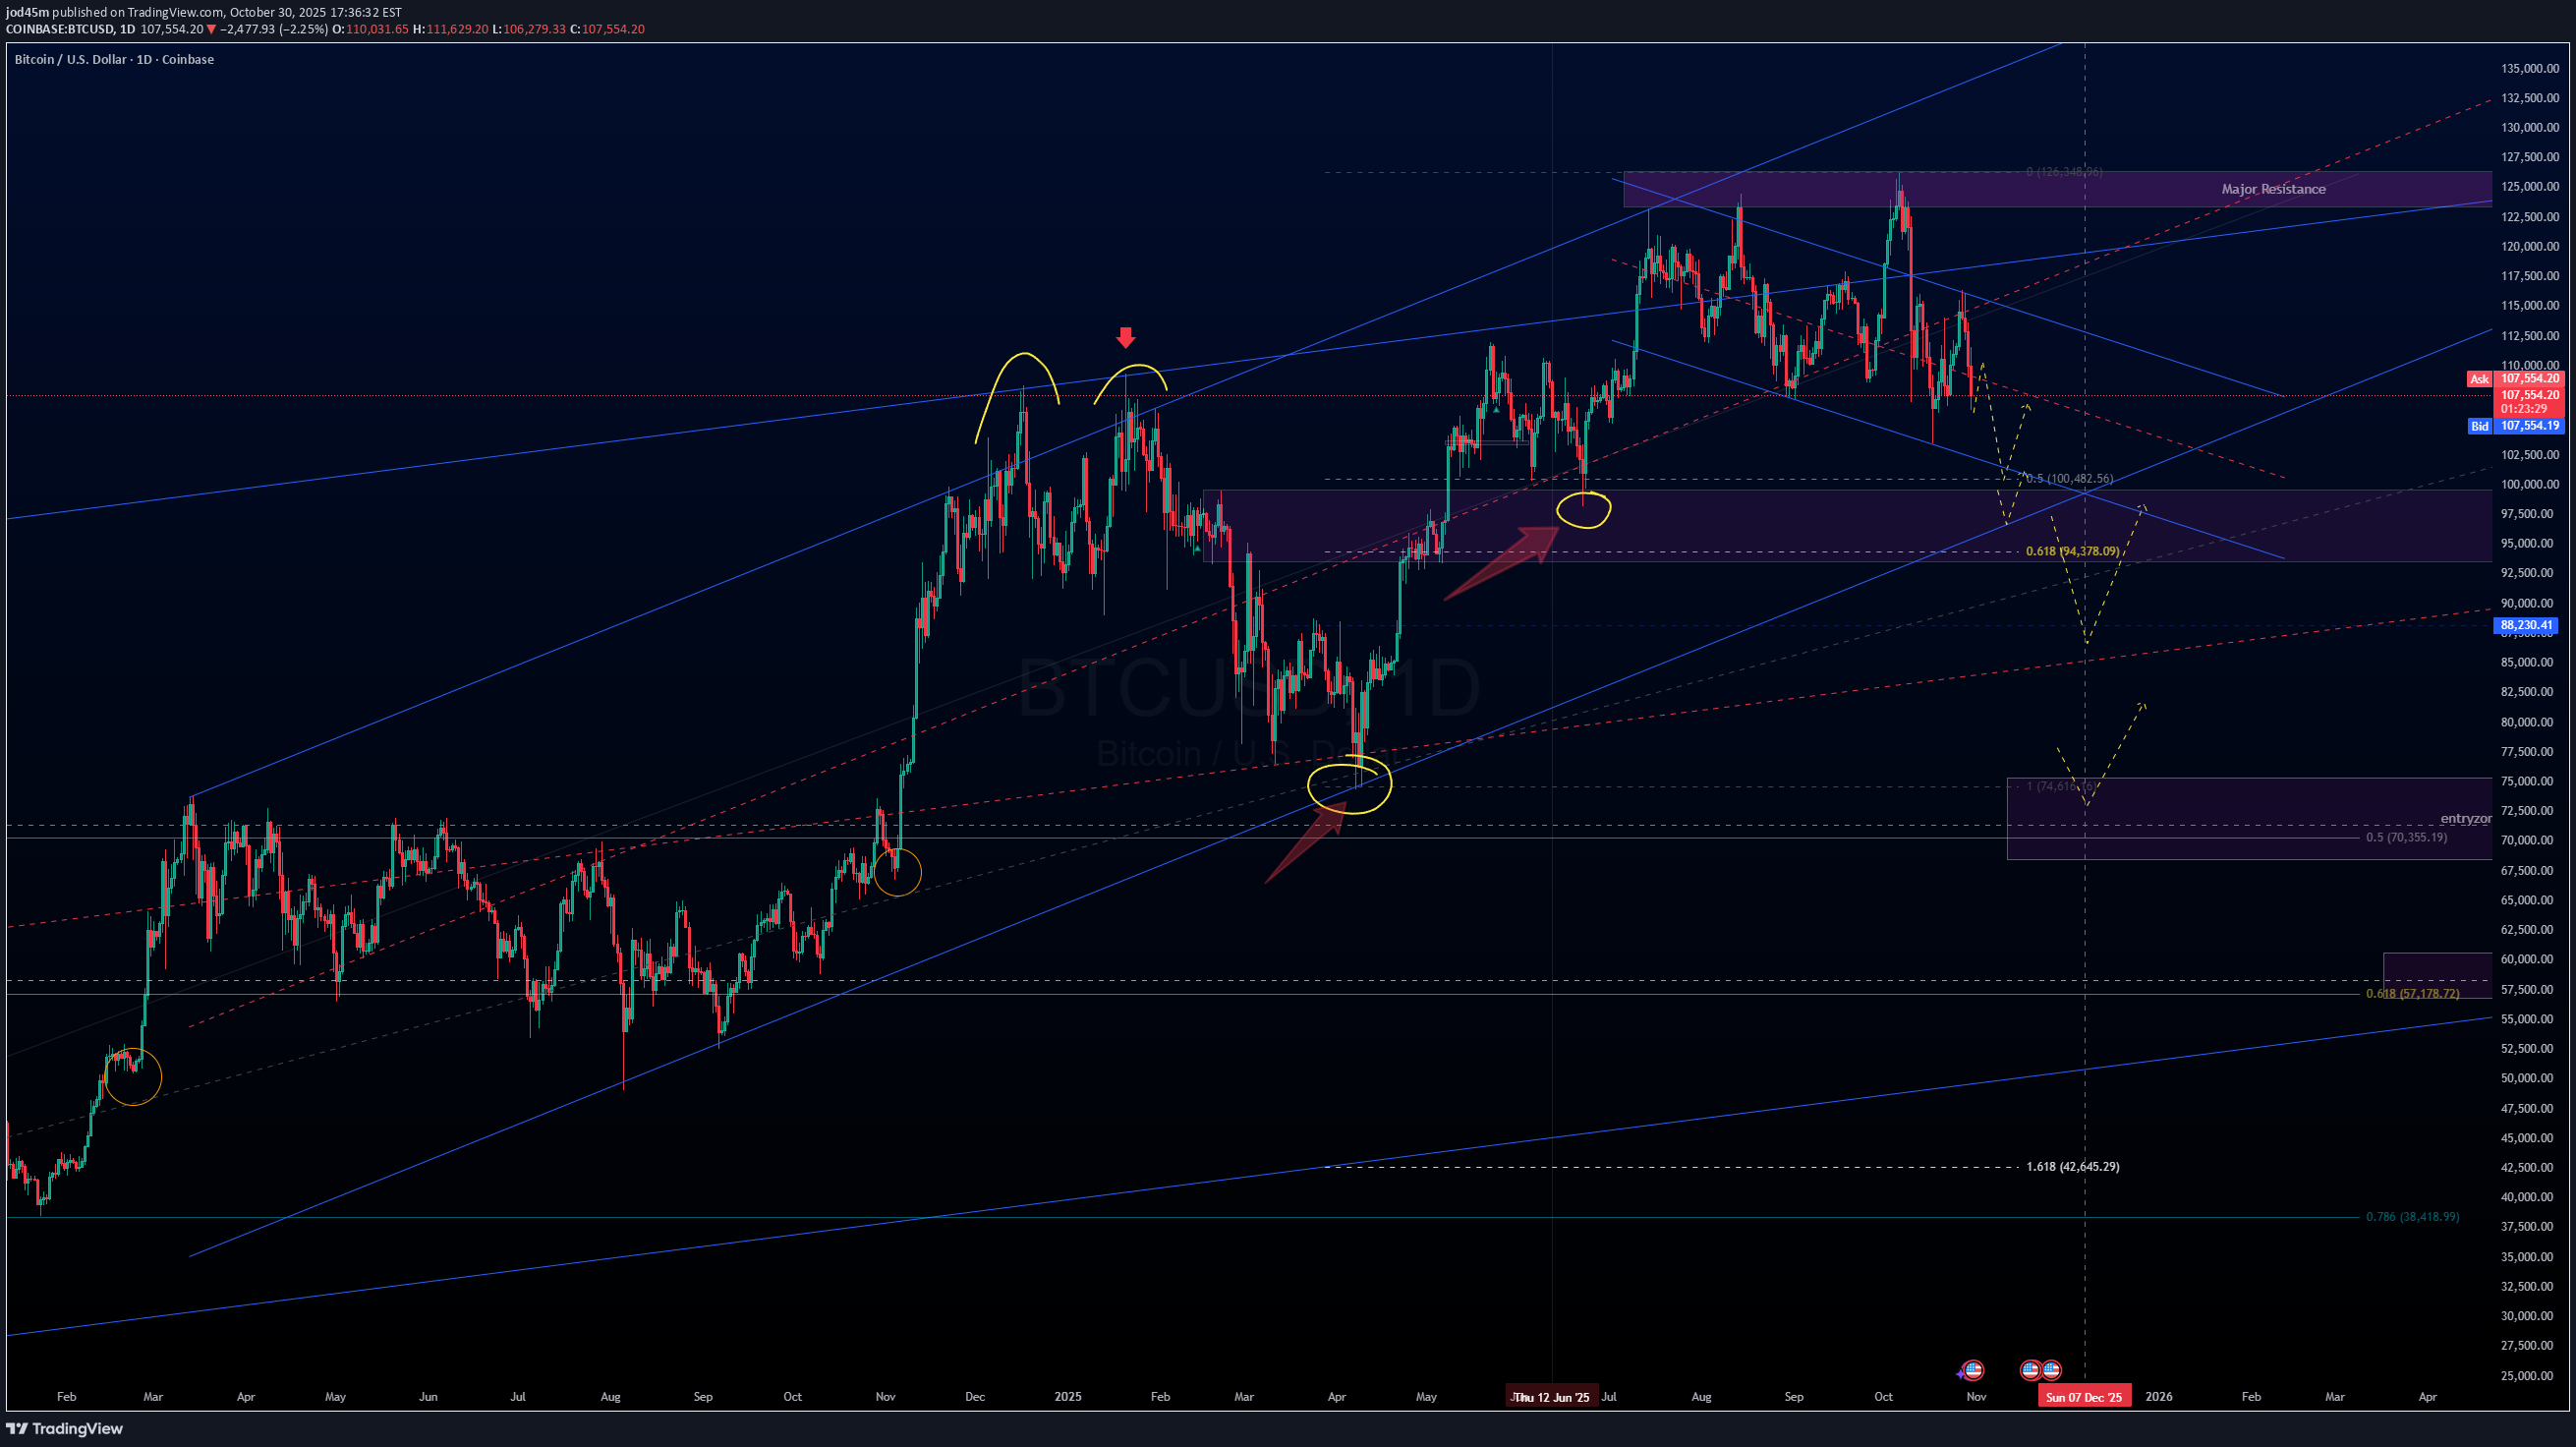
Watching BTC price action, looks like it will complete this 3rd wave around 7-8 Dec approx. where it lands will dictate the next likely move. marked out possibilities in dotted yellow lines. If price holds above 98 (give or take some wicks) we could see another bullish move up however I'd be weary of any price movement up. This will be a good area to look for shorts depending on the strength and volume of the move. losing 98 could indicate top is in where we could see consolidation and even collapse down to 70-75k area.
jod45m
سیگنال صعودی گروک: منتظر این حرکت انفجاری باشید!
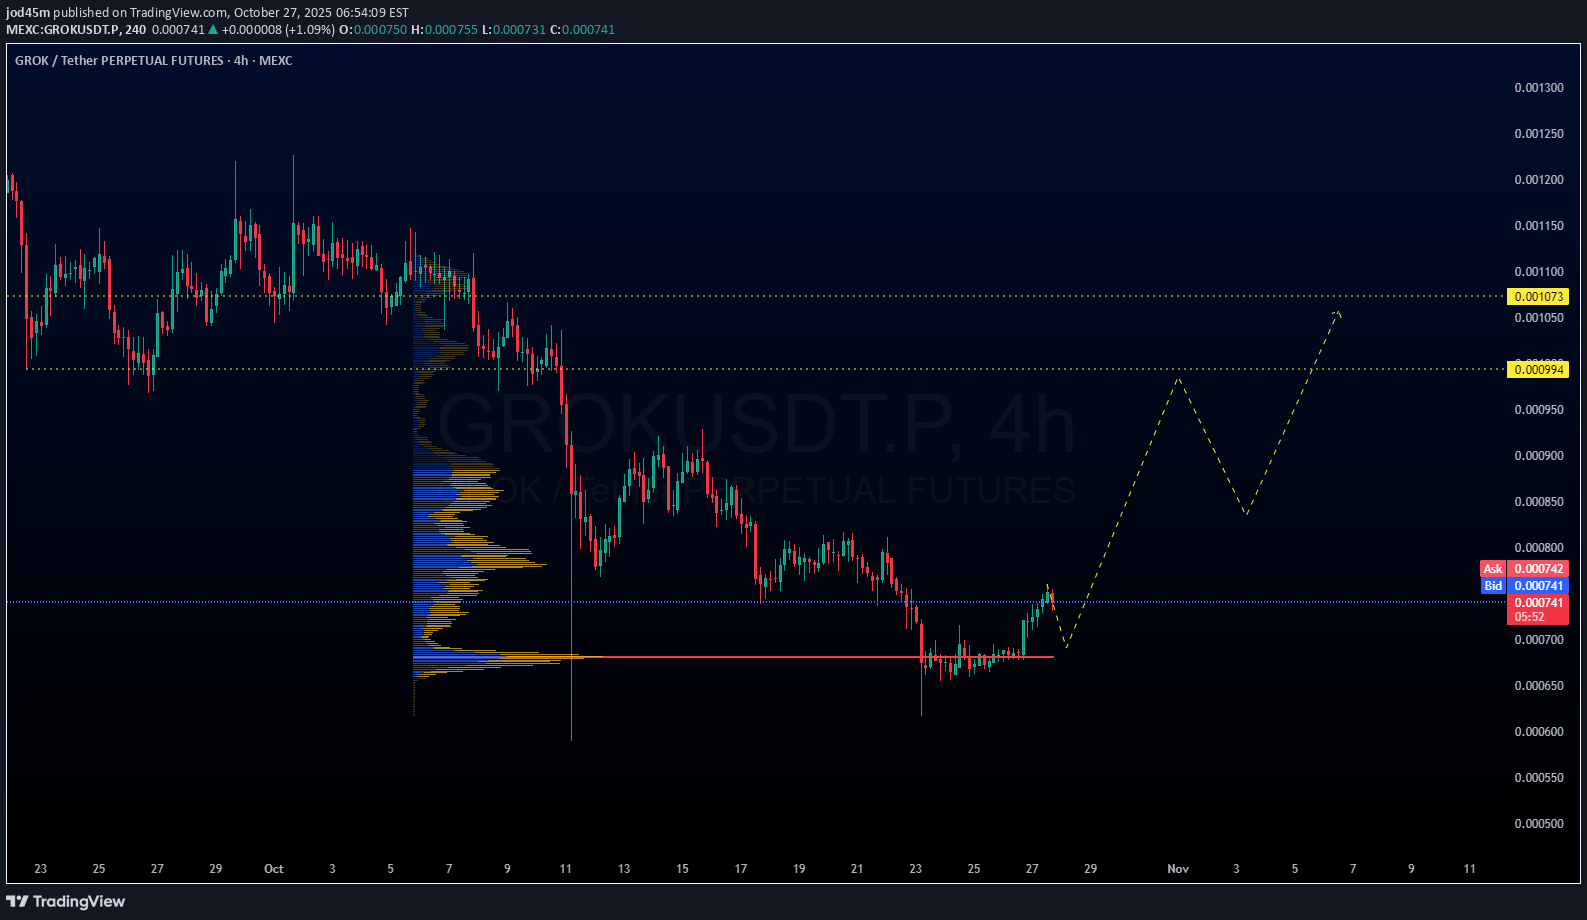
Watching Grok for a bullish retrace here. After the wick down on 11Oct, price has come down to claim the wick on 23rd Oct, so now watching to see some bullish price action. If price plants a HL maybe bouncing somewhere around the POC, we could see a good push up from that point.lost the low, invalidated. waiting for bullish price action.
jod45m
DOGE Bullish idea
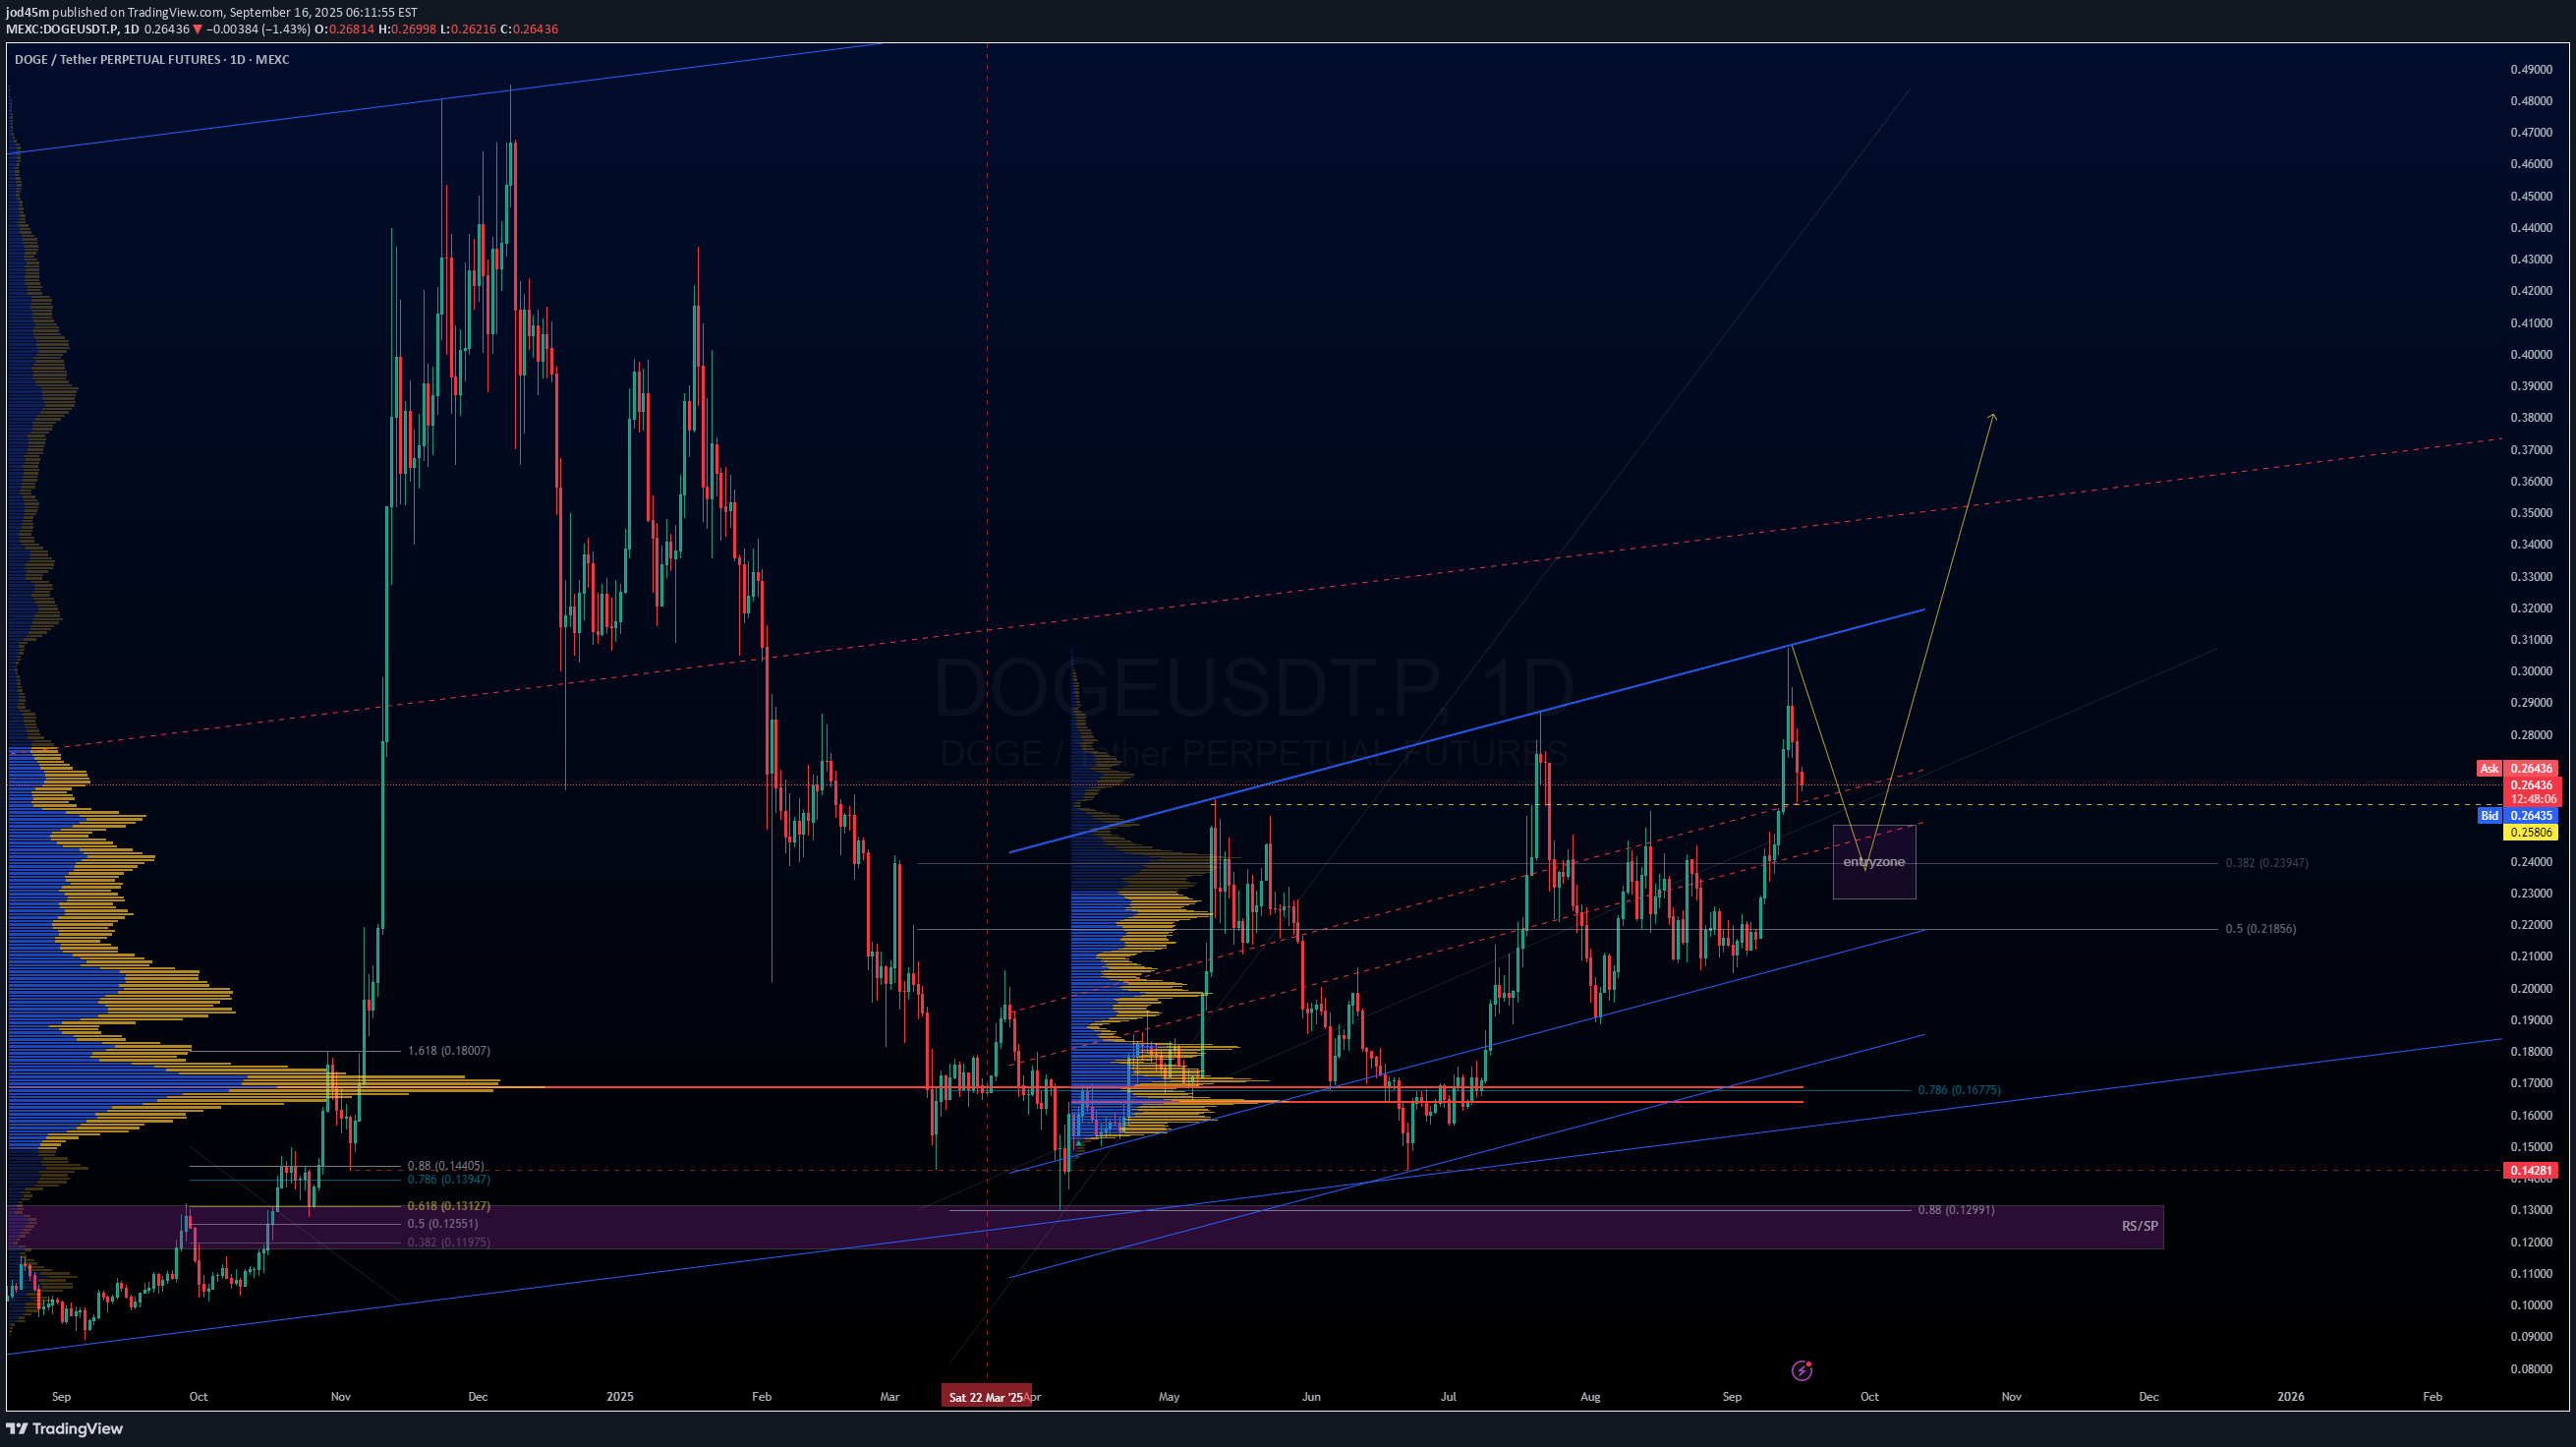
Watching Doge slowly build momentum in this range. Current retrace may continue until the end of September but expecting a pivot around that time and around the 0.238 level where I see lots of support. Will watch for a reaction otherwise will wait for lower, with the previous low being my invalidation. Expecting to see a massive upleg if the macro bullish sentiment continues.
jod45m
SUI Bullish scenario
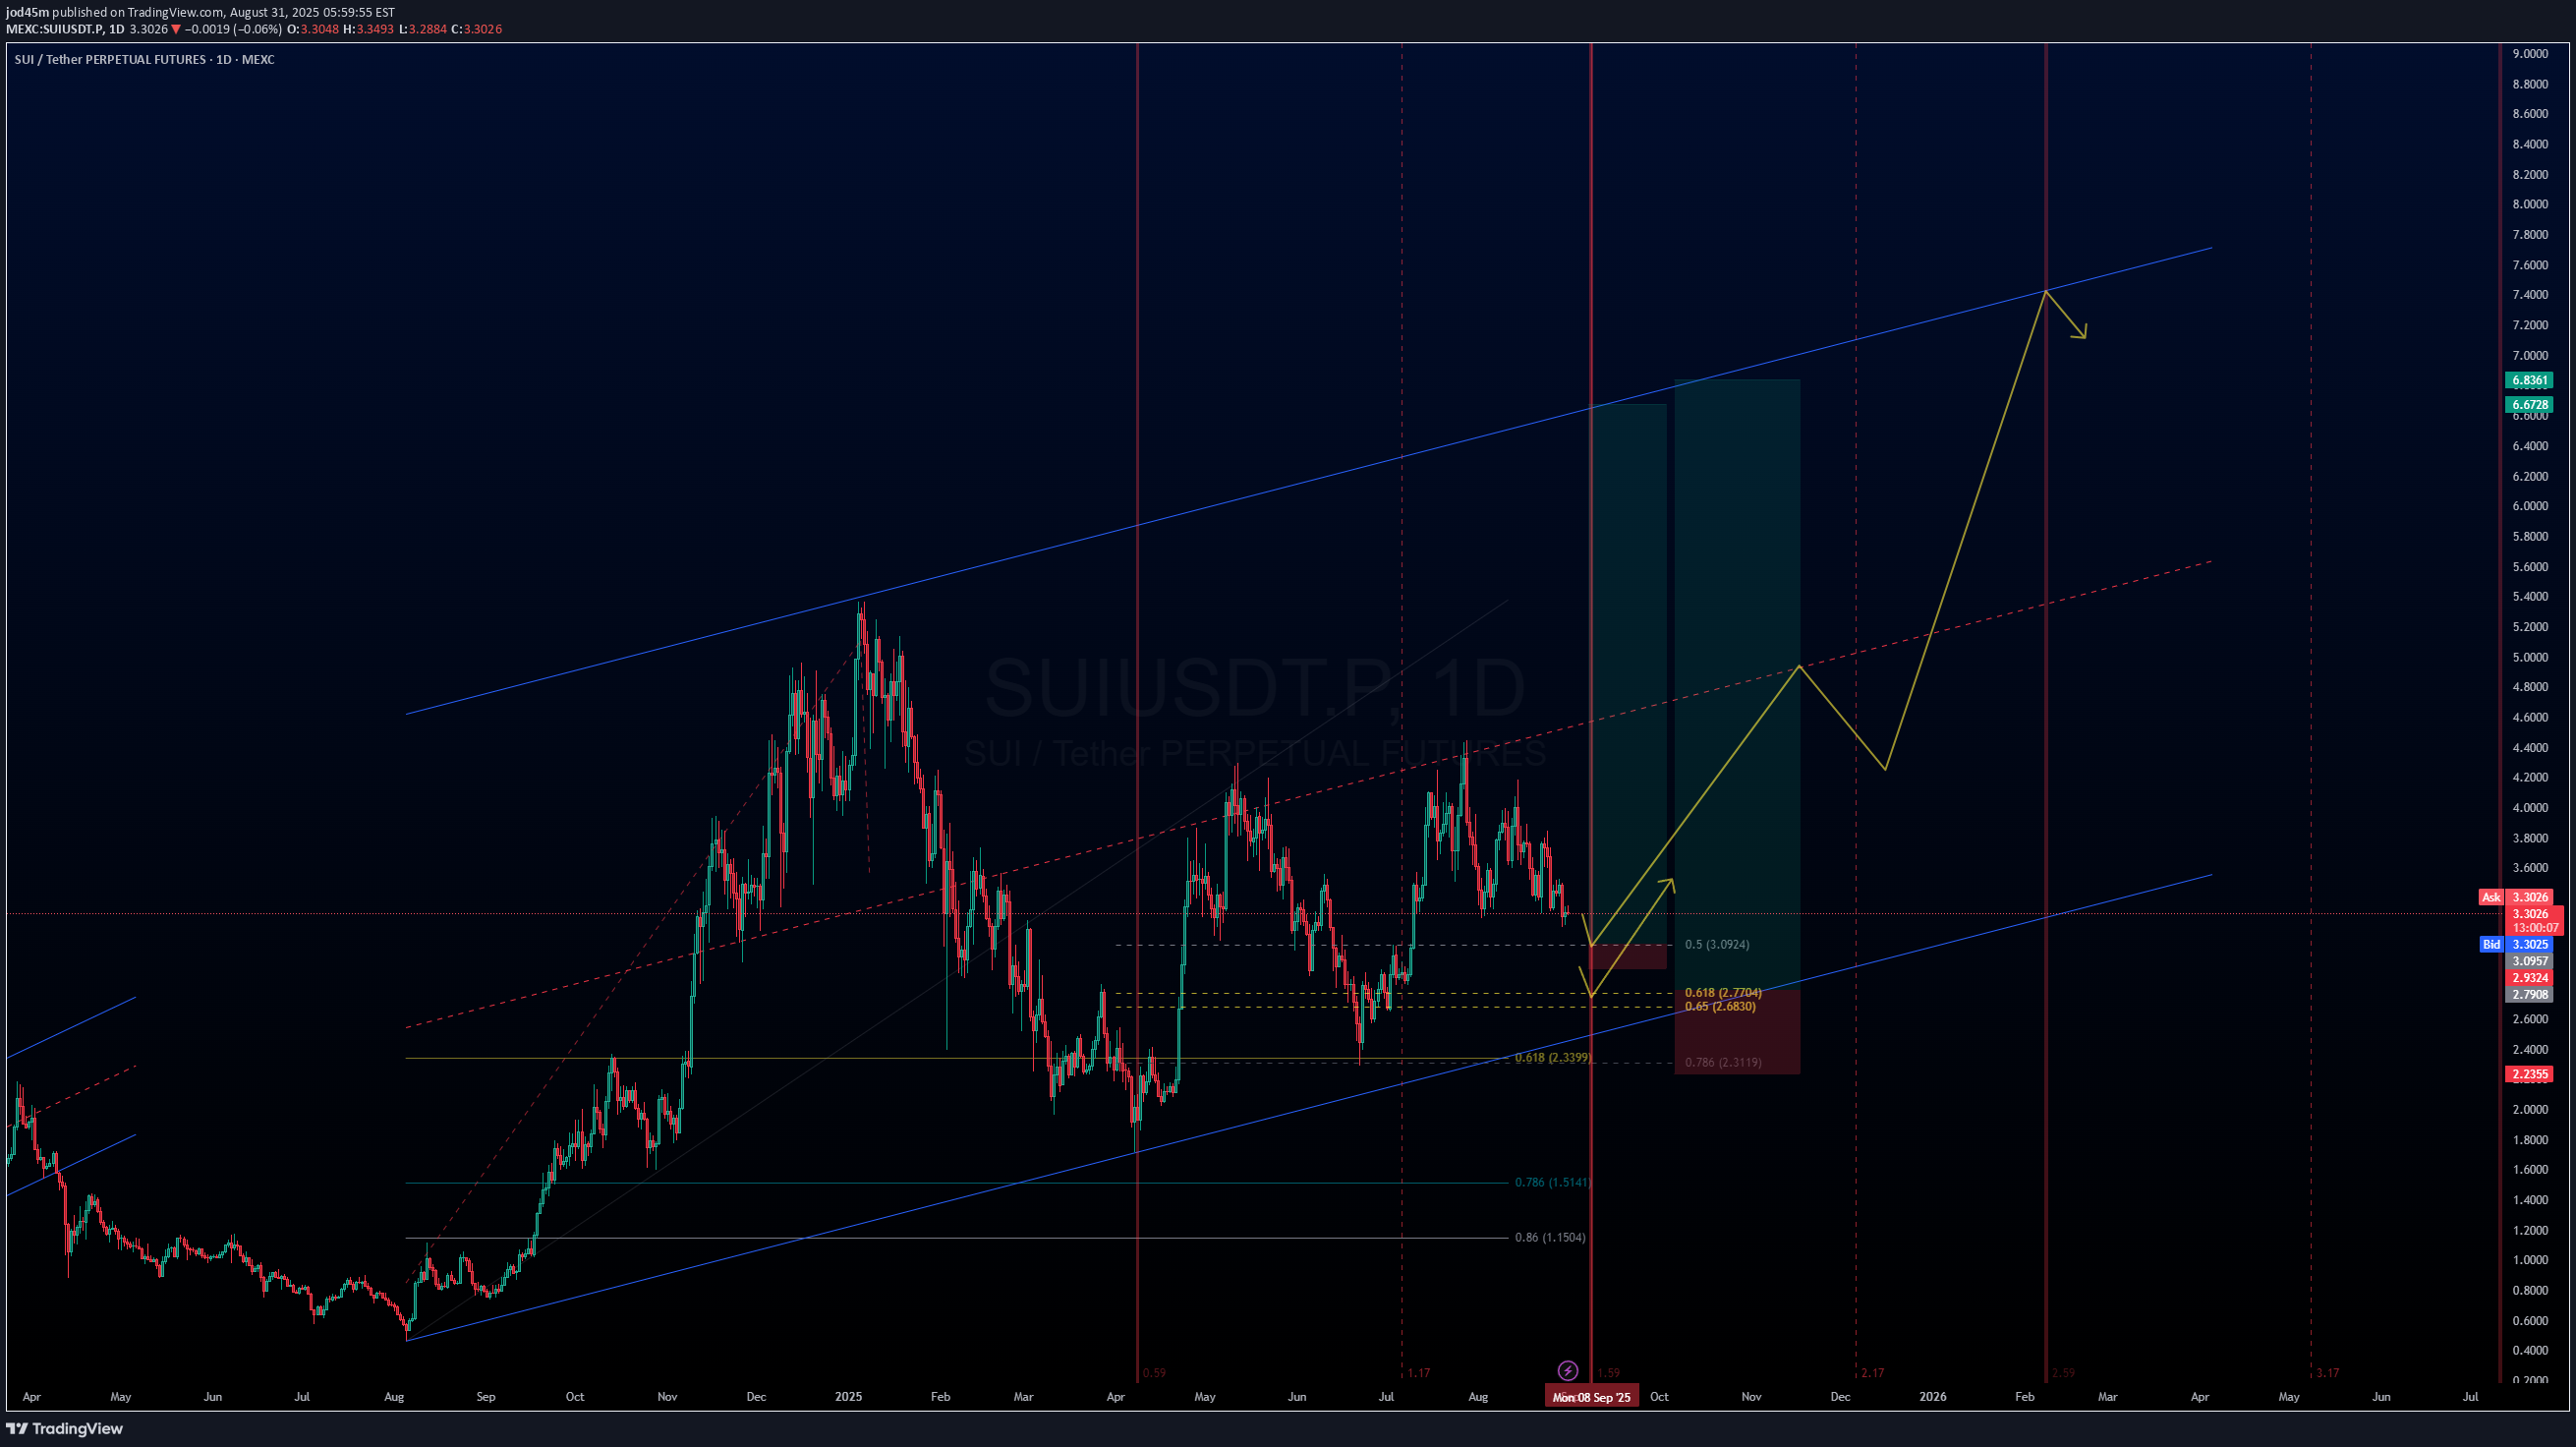
Watching SUI price retrace to possible support levels. Potential for it to start a new bullish trend to the upside.Looking good so far
jod45m
Xmr dump.. looks like.an opportunity

Xmr looks to be retracing within this ascending channel. Looking for a reaction around 0.5 fib before a final drop towards bottom of trend.Looking good so far
jod45m
ETH long term outlook 2025-2028 (crystal ball version)
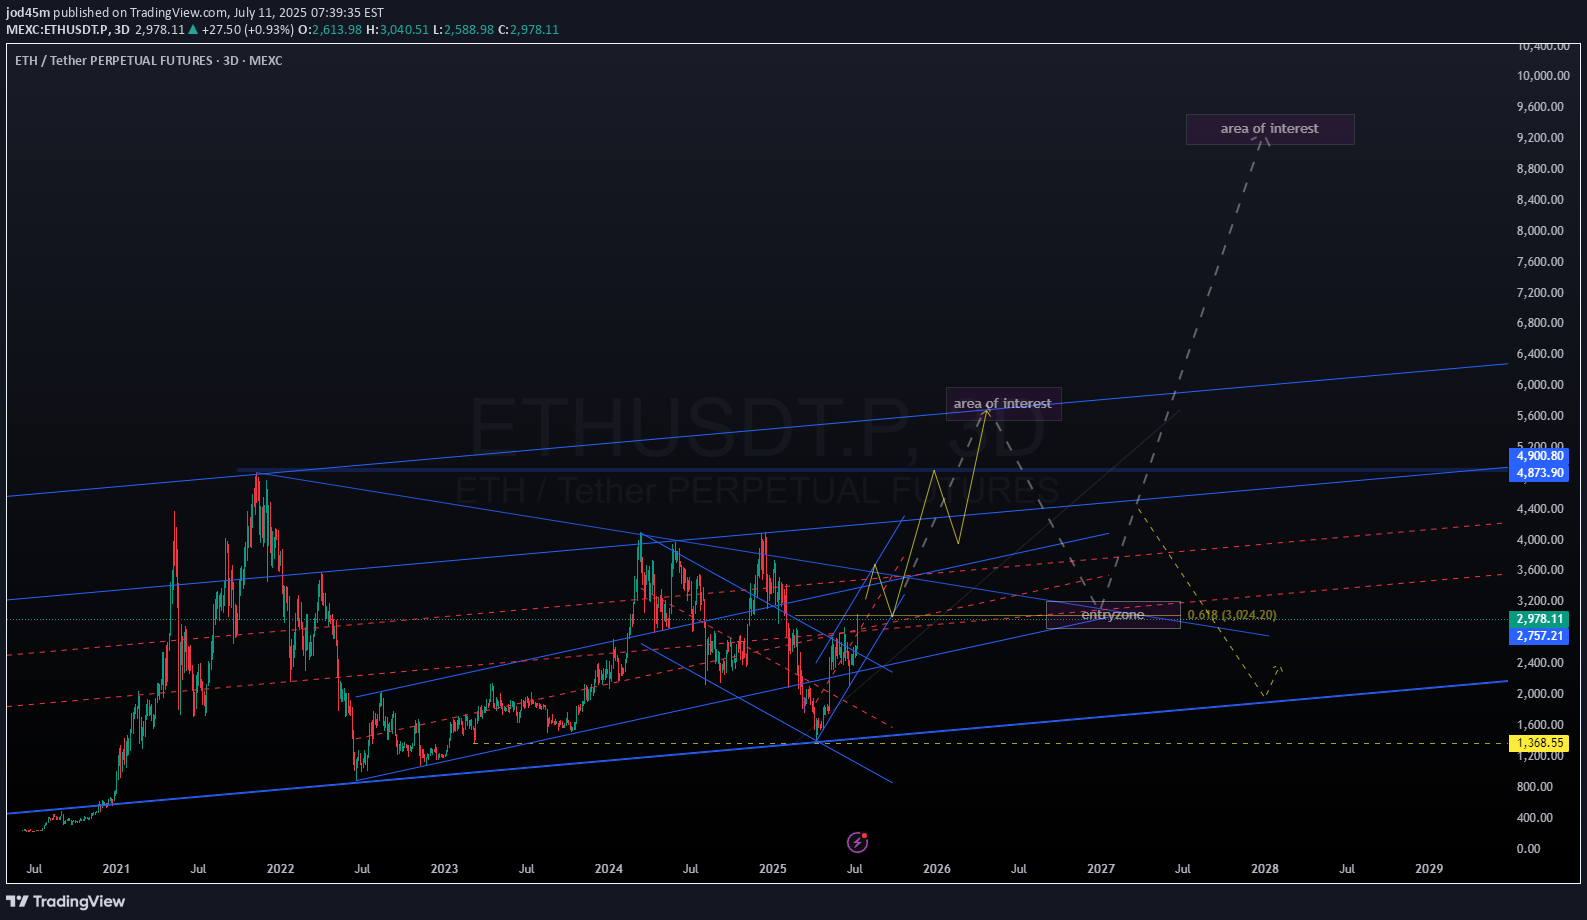
Based on time fibs and fib projections. No financial advice. If ETH pushes up, looking at a pull back starting early to mid september, then retrace to 0.5 fib and push up into dec. After which possibly come back and test the 4k area where price broke out from. Next push up with a top in Mar/April. The next is purely speculative (as is this whole post). Deep retrace after local top in April26, to the 3k level. If price finds support at 3k, then the next leg up has a chance at 9k end of 2027, Jan 2028. Otherwise, if support doesn't hold, continuation down into bear market.
jod45m
BTC May 2025 Bullish macro view

BTC has hit the recent target area and made a higher high confirming the bullish trend.Price is currently retracing slightly.RSI peaked at 77 so not as high as last years high in March. This could still mark a local high as we've seen such a heated pump from btc, so pattern wise wouldn't surprise if BTC does a bit of consolidation downwards gathering steam for the next leg up.A few scenarios present themselves in my eyes here:1. Green path has price retracing to test the POC at approx. 103k after which price continues on to the upside where we wait for RSI to reach a similar peak to March last year. Projection here is around 133k.2. Yellow path which sees price do a 50% retrace quite quickly with the first target being liquidity around the 100k level and ultimately 93k. Projection after this retrace is around 133k.3. Red path which has a protracted retrace lasting 2 months ending approx. end of July. Target here would be a 50% retrace level around 92-93k which also has confluence with the major ascending channel that btc has been following. Projection after this retrace would then be approx. 140k area.#3 could see a possible "alt season" provided BTC price does not retrace too much in a single drop, but does so with decent recoveries allowing alts to climb... i.e. profit taking in btc is then transferred to buy into alts.A drop below the 50% fib level at 93k would indicate weakness, and I would look to preserve capital is this plays out. Should this play out, I would plan for a revisit to the 73k area.
jod45m
AVAX Cup & Handle forming

Looking at macro price action for AVAX, have noticed a potential cup & Handle forming.Using time fibs, projecting where price will reach to complete the cup and then retrace for the handle. Projection has top of cup around 8-9 June with correction ending around 23June.
jod45m
COTI bullish idea

COTI reacting with the rest of the market seems to have completed 1 & 2 waves in a possible 5 wave elliot wave structure. If this holds true, there's an opportunity to catch the next retrace and 3,4,5 waves. Possible entry points I would consider would be at POC or even VAL if there is a decent reaction from price, with invalidation below the previous low.
jod45m
ICP bullish scenario C&H

Seeing this C&H possibly forming on ICP.If cup forms, will look for a significant retrace around the 618 fib level for the handle.And possibly a pump out of the handle but will look at charts closer to the time.
Disclaimer
Any content and materials included in Sahmeto's website and official communication channels are a compilation of personal opinions and analyses and are not binding. They do not constitute any recommendation for buying, selling, entering or exiting the stock market and cryptocurrency market. Also, all news and analyses included in the website and channels are merely republished information from official and unofficial domestic and foreign sources, and it is obvious that users of the said content are responsible for following up and ensuring the authenticity and accuracy of the materials. Therefore, while disclaiming responsibility, it is declared that the responsibility for any decision-making, action, and potential profit and loss in the capital market and cryptocurrency market lies with the trader.