
httpz
@t_httpz

What symbols does the trader recommend buying?
Purchase History
پیام های تریدر
Filter
httpz
$XMRUSD - 1YR Trade Update +73%

Checking in from my post originally back in August 2024, XMR is still strong fundamentally. Originally called this at $173.14, we are now sitting +73% approximately, having touched up to ~150% at peak. I think we have higher to go still. As we approach the Jackson Hole meeting this week, we will see how the market reacts to his tone. My guess is he will note the recent turbulence in the job market and hint to it being a motivating reason to consider a cut in September. My belief is that he just wants to make it shown that it is his data driving his decision, and not the president's pressure. If rate cuts are confirmed and M2 / M3 continues higher, this could be the beginning of BTC.D 's return to the mean ~50% PS: I know there recently had been news of 'a 51% attack' is happening on Monero, but it is not so. Those saying this are misinformed. What happened was significant, but this could be a FUD dip worth buying.
httpz
$TSLA - High CAGR Strikes again
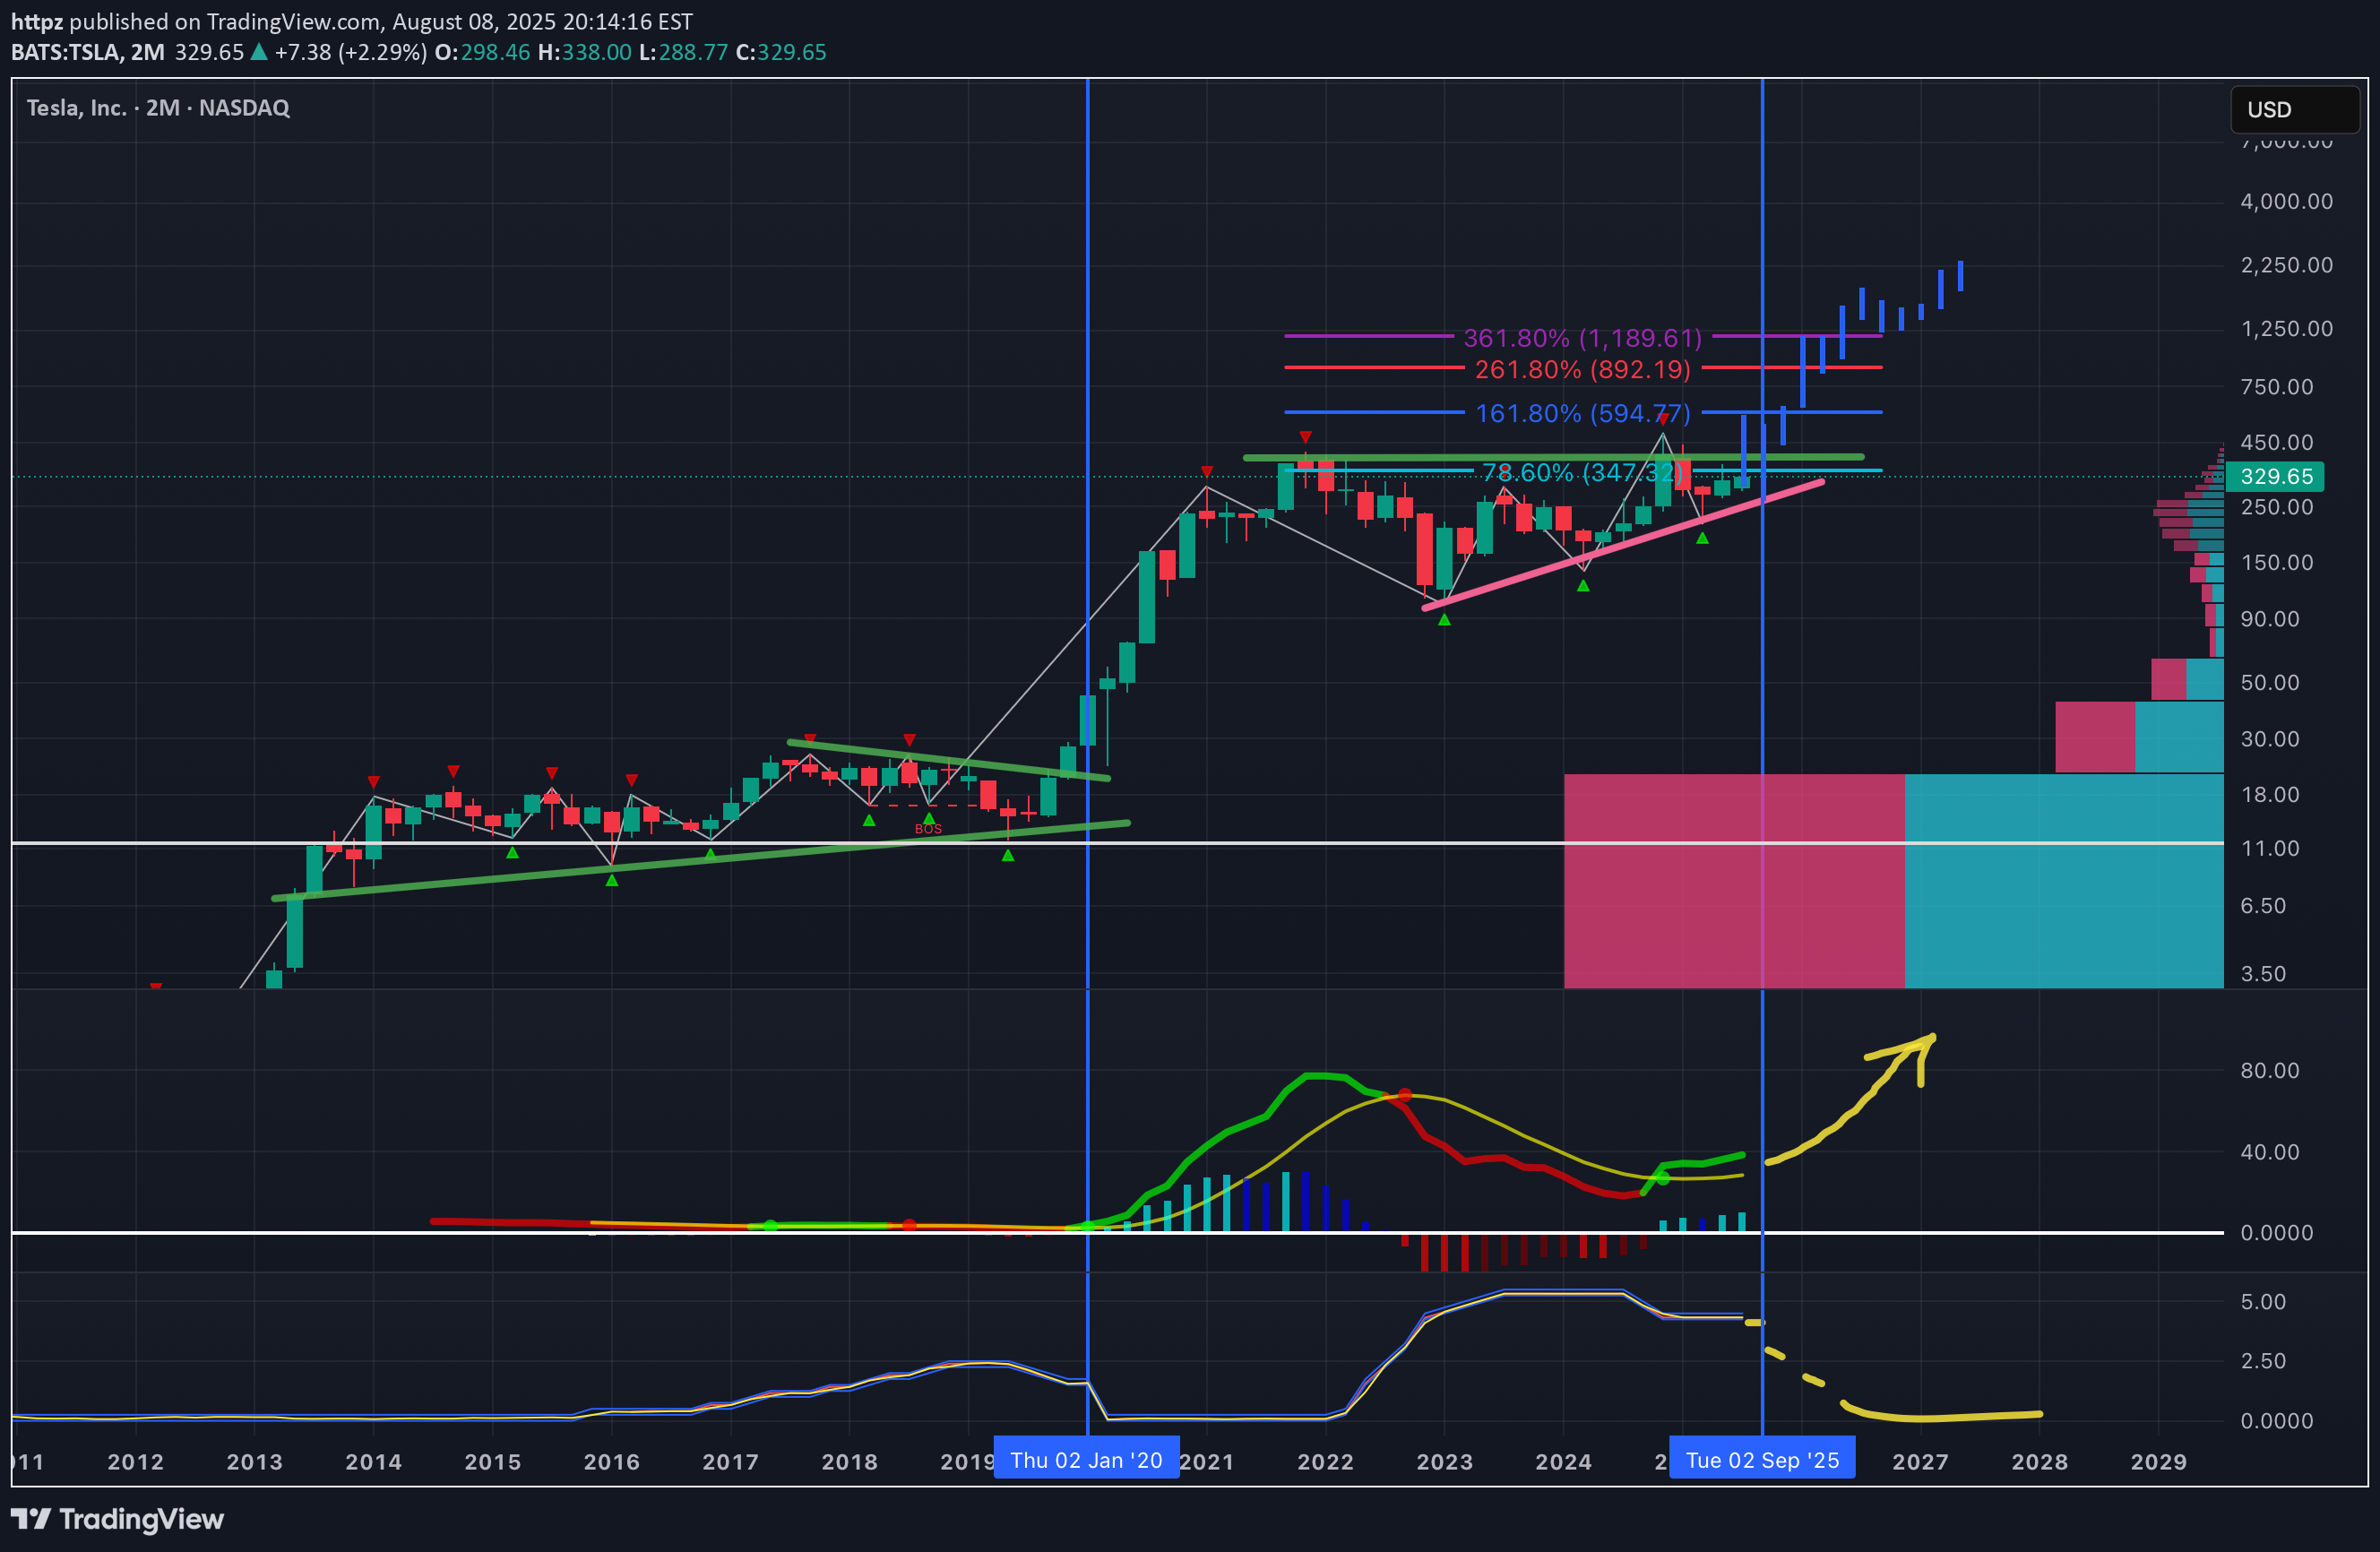
Tesla’s long-term bullish structure remains intact on the 2-month logarithmic chart, with price breaking out of a two-year ascending triangle capped near $350. This move tests the 78.6% retracement level at $347, opening the door to Fibonacci extension targets at approximately $595, $892, and $1,189 if momentum follows through. The volume profile highlights strong historical support in the $180–$250 range, a key zone to defend on any pullback. Notably, the macro backdrop adds a tailwind — the last significant Fed rate cut in early 2020 coincided with Tesla’s parabolic advance, and the next major cut is projected for late 2025. Long-term momentum indicators are turning higher, suggesting the early phase of a new bullish cycle. A sustained hold above $300 on any retest would reinforce the breakout, while a drop back under $280 risks a move toward $200–$220. I wouldn't want to be short long term.
httpz
$ETH - Nothing has changed
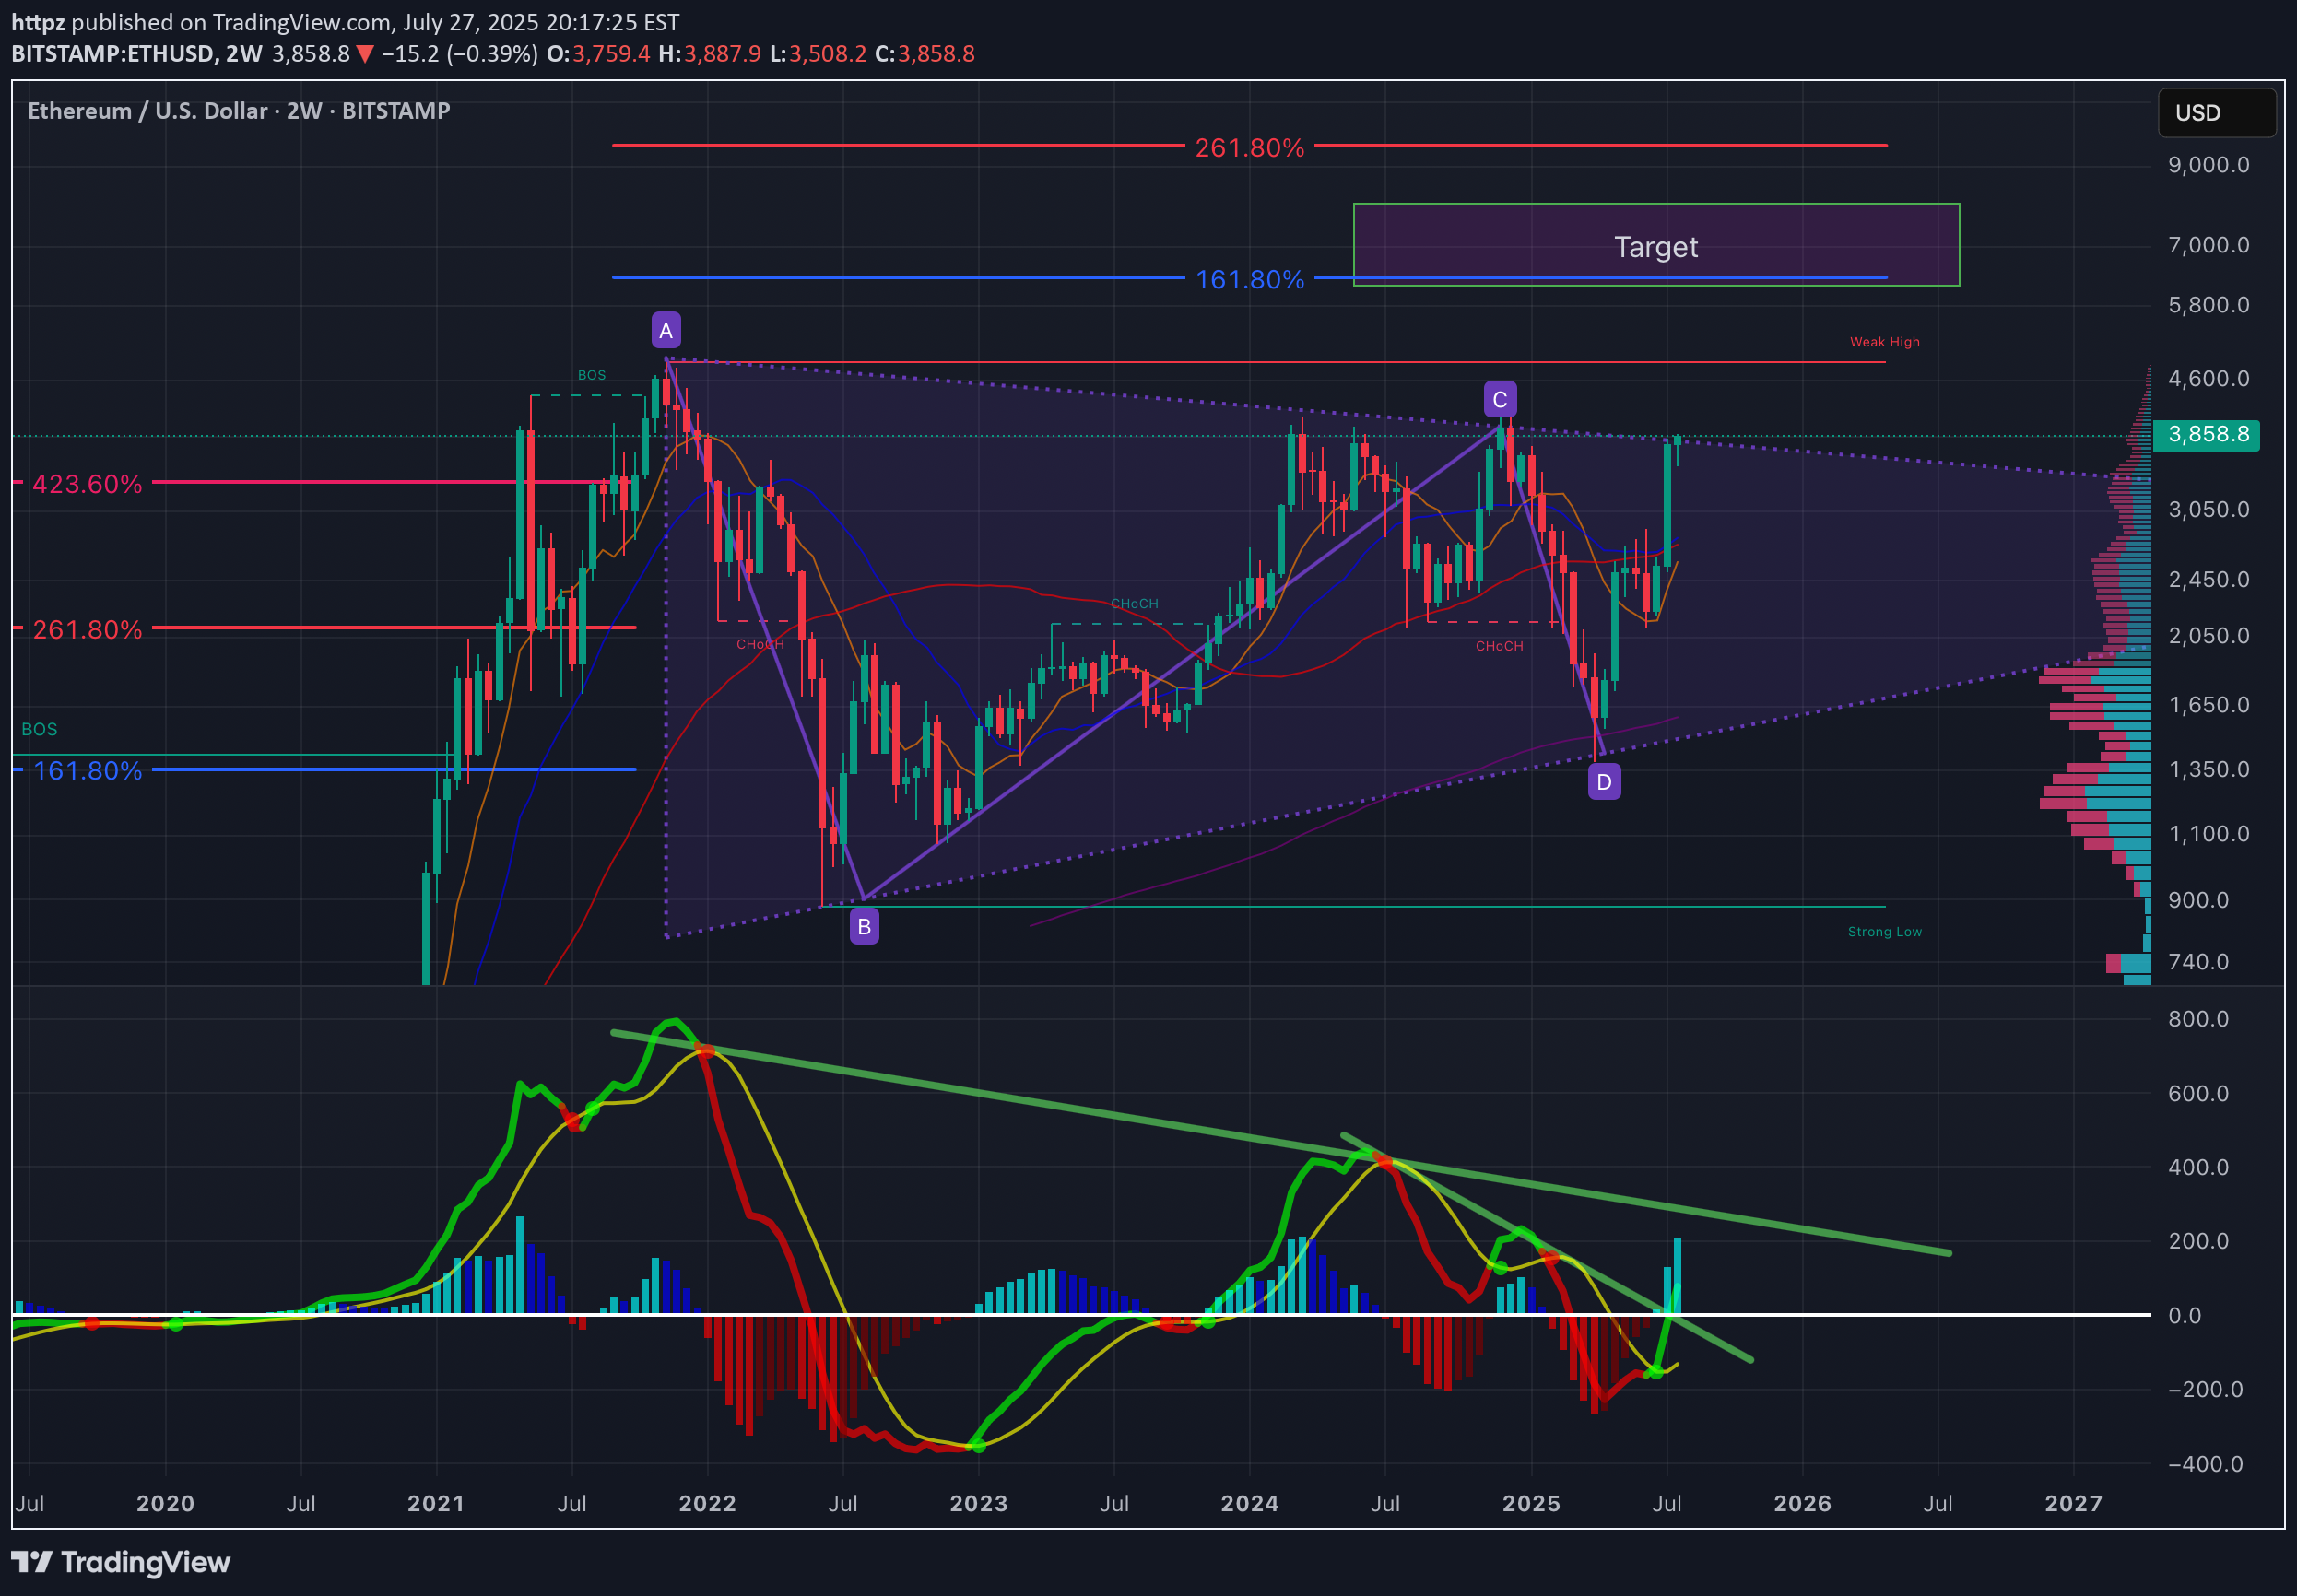
Ethereum is showing a significant breakout setup after years of consolidation within a large symmetrical wedge structure (A–B–C–D pattern). The price has just tested the upper boundary of the wedge, and momentum indicators suggest a potential mid-term bullish continuation. Key Observations: ABCD Harmonic Structure: Price has respected the harmonic range with D forming a strong higher low near $1,500–$1,600, showing buyer absorption at key demand levels. Fibonacci Confluence: The 161.8% extension aligns with ~$5,800, forming the first major target. A 261.8% extension pushes towards ~$7,000, aligning with the marked "Target" zone. Volume Profile: Heavy accumulation between $1,500–$2,500 with low resistance above $4,000 suggests a breakout could accelerate quickly. MACD/RSI Divergence: The momentum oscillator shows a triple bullish divergence (higher lows on momentum vs. lower lows on price), and the downtrend line on the MACD histogram has been broken—often a precursor to sustained upside. Moving Averages: The 50/100 EMA crossover on the 2-week chart is imminent, historically a strong macro signal. Bullish Scenario: A clear close above $4,000 confirms wedge breakout. Short-term targets: $4,600 (weak high) and $5,800 (Fib 161.8%). Macro target: $7,000+ if bullish momentum holds through Q4. Bearish Risk: Failure to hold $3,500 could lead to retests of $2,500 or even $2,000 (mid-wedge support). Watch for macroeconomic shocks (rate cuts, liquidity shifts) which have previously caused retracements in crypto markets. What’s next? ETH is approaching a make-or-break moment. If the breakout holds, this could be the start of the next major leg up. A strong weekly close above $4,000–$4,200 is critical for validation.
httpz
$BTC Is moving along
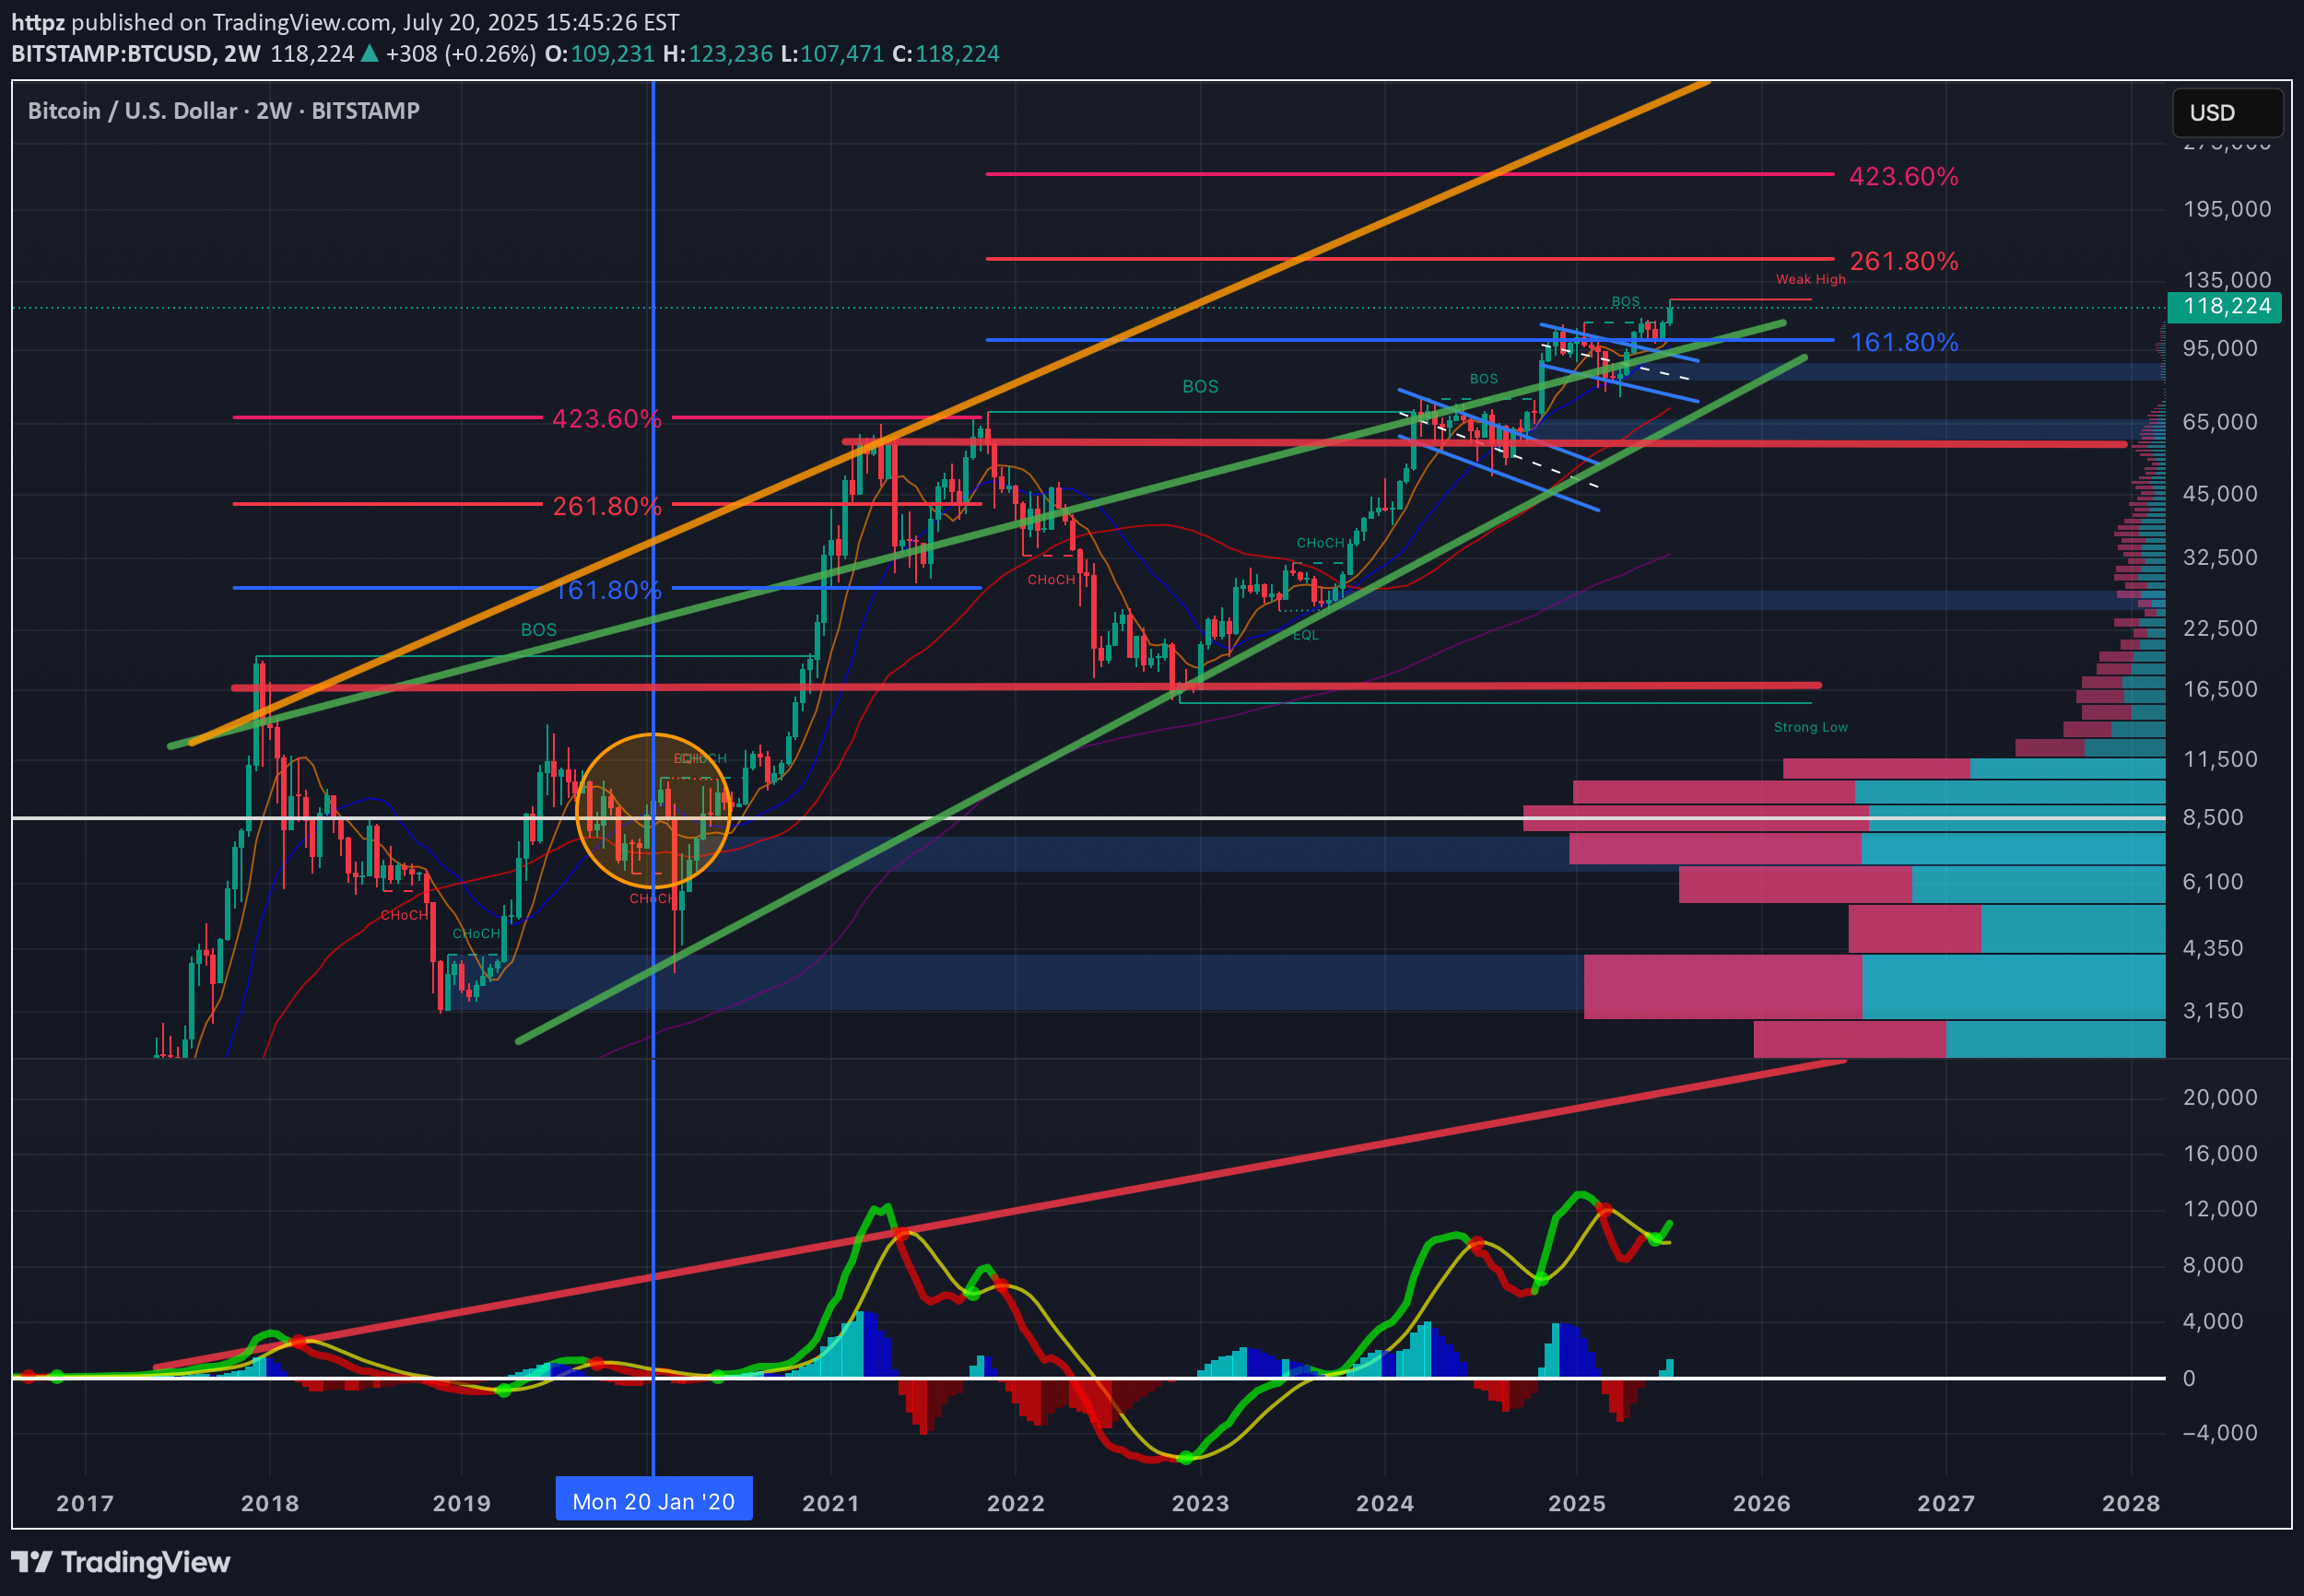
BTC‑USD | 2‑Week Chart – Quick Read Structure & Trendlines * Price continues to respect the 2019‑2025 rising green channel and has flipped the 2017‑2021 orange trendline from resistance to support. * A fresh break‑of‑structure above the 2021 ATH confirms continuation. Invalidation sits near the channel base / 65‑70 k demand zone. Fib Road‑Map * 1.618 extension (\~90 k) was reclaimed and back‑tested. * Next confluence levels are the 2.618 (\~180 k) and 4.236 (\~240 k) extensions, matching thin volume nodes on the VPVR. Momentum * Multi‑time‑frame RSIs have broken their downtrends and pushed firmly bullish, echoing the 2020 breakout posture. * The 2‑week MACD histogram has flipped positive with a higher‑low signal—momentum rebuilding. Volume Profile * Highest historical volume sits 15‑35 k; above 120 k liquidity thins sharply until ~160 k. Near‑term downside risk * The last episode of aggressive Fed rate cuts (March 2020) triggered a sharp washout before the subsequent melt‑up. * Cuts keep getting deferred because unemployment remains low and jobs data solid; if a sudden pivot arrives on weakening data, a risk‑off flush toward the mid‑channel zone (≈ 80‑90 k) is possible before higher targets re‑engage. Macro uptrend intact; pullbacks to the channel centre are buy‑the‑dip territory while momentum and structure favour an eventual 161.8 → 261.8 push, but stay nimble for policy‑driven volatility.
httpz
$ETH and $TSLA run hardest with cheap money

Sentiment has grown increasingly negative on TSLA and ETH in recent months.I believe while frustrations could be high, they still have a place in your portfolio. The catch with ETH and TSLA is that they need low interest rates to truly run. This chart shows ETHUSD on the top, 2wk candles. You can see that it’s forming a large pennant on the chart. Since we entered the pennant from below, we are most likely to continue out of the top of the pennant— but we won’t know until it is confirmed with a breakout and retest. Below that, I have the RSI indicator, which is also clearly consolidating and ready for a breakout. The pink line is TSLA, a stock that I thought performed similarly to ETH and wanted to analyze. Finally the last line is the Federal Funds Rate. I inserted a vertical line where the rate hit zero effectively- and you can see how they both began to go parabolic shortly thereafter.. just a coincidence? What are some other stocks that have this similar of a correlation? High CAGR stocks and commodities can chop for what feel like painfully long periods.. patience!
httpz
$ETHUSD Head and Shoulders Update

This chart of Ethereum (ETH/USD) on the 12-hour timeframe presents several key technical analysis insights that suggest a potential bullish trend. Notably, an inverse Head and Shoulders (H&S) pattern is visible, with the left shoulder, head, and right shoulder clearly defined. This formation typically signals a bullish reversal when confirmed. The head represents a significant lower low compared to the shoulders, while the right shoulder aligns symmetrically with the left, indicating recovery behavior. The volume profile on the right side of the chart reveals significant trading activity between $3,000 and $3,500, forming a high-volume node. Above $3,700, there are volume gaps that could result in rapid price movements if the price breaks out upward. Resistance at $3,700 aligns with the top of a wedge pattern, while a larger breakout target zone is identified between $6,000 and $7,000, suggesting significant upward potential if the bullish momentum persists.Several break-of-structure (BOS) levels are marked on the chart, which highlight pivotal price action shifts. These levels serve as dynamic support and resistance points. A descending trendline, in place since November, has recently been broken, aligning with the inverse H&S pattern to reinforce the bullish outlook. The Stochastic Oscillator at the bottom of the chart shows a clear downtrend in momentum over a 72-hour and 4-hour window, but bullish divergence is forming. While momentum continues to make lower lows, the price action is showing higher lows, indicating a potential upward breakout in the near term.Finally, support zones are evident around $2,400–$2,700, based on historical lows and high-volume trading activity. If the bullish momentum weakens, these areas could provide a safety net for price action. However, with the current alignment of bullish patterns, the focus remains on breaking the $3,700 resistance level, which could open the door to significant upward movement toward the $6,000–$7,000 target.
httpz
$AKT - +26% Today, Last Chance?

For those that have been holding and staking AKT through the bear, I think the time is soon coming for sewing the rewards!Here's one of my better posts about AKT, following the first FED Rate Cut:We anticipated that there may be a flip to 'risk on' following that event, and those that positioned there have been reaping massive rewards, in any alt, let alone just AKT.Going back further, I initially called out this bull pennant in September 2024:Today, we're up 26% alone, and I think it is interesting that HNTUSD is not pumping in a similar fashion. Why might that be? Any ideas?This might be the last chance to get cheap AKT, the decentralized AWS. NFADYOR YAKWTFIGO
httpz
$ETH to $6.45k USD - 2024's Crescendo

ETH is showing strong signs of an impending breakout to the $6.4k–$8k range, backed by two key technical indicators: Cup & Handle Formation: ETH has recently broken out of a textbook cup and handle pattern, confirming the breakout with a solid retest over this past week of VOL. This is a classic bullish signal pointing to higher targets. Bull Pennant: Since the 2021 rally, ETH has been consolidating within a massive bull pennant. This long-term structure suggests Ethereum is coiled and ready for a significant move upward. 1.618 Fib: Also layering in a Fibonacci retrace, if ETH is indeed heading for ATHs and price discovery, the 1.618 FIB is a common level that traders are very familiar with. It just so happens to be right in the middle of our target box at ~$7k! Momentum is building— we will need to keep an eye on volume and follow-through for confirmation. To boot, bearish sentiment for ETH is near all time highs. I think it might be time for a most-hated rally. I have a short term allocation in ETHT to ride this momentum, NFA DYORStill right on track with the LTF trend-- higher.
httpz

httpz
$HNT - Painfully long

Chart speaks for itself. Time to rotate to where nobody is lookingVAMOS
Disclaimer
Any content and materials included in Sahmeto's website and official communication channels are a compilation of personal opinions and analyses and are not binding. They do not constitute any recommendation for buying, selling, entering or exiting the stock market and cryptocurrency market. Also, all news and analyses included in the website and channels are merely republished information from official and unofficial domestic and foreign sources, and it is obvious that users of the said content are responsible for following up and ensuring the authenticity and accuracy of the materials. Therefore, while disclaiming responsibility, it is declared that the responsibility for any decision-making, action, and potential profit and loss in the capital market and cryptocurrency market lies with the trader.