
gunhy
@t_gunhy

What symbols does the trader recommend buying?
Purchase History
پیام های تریدر
Filter
gunhy
تکرار الگوی بزرگ: بازیهای بازاری که قبلاً دیدهایم و رمز موفقیت بعدی!
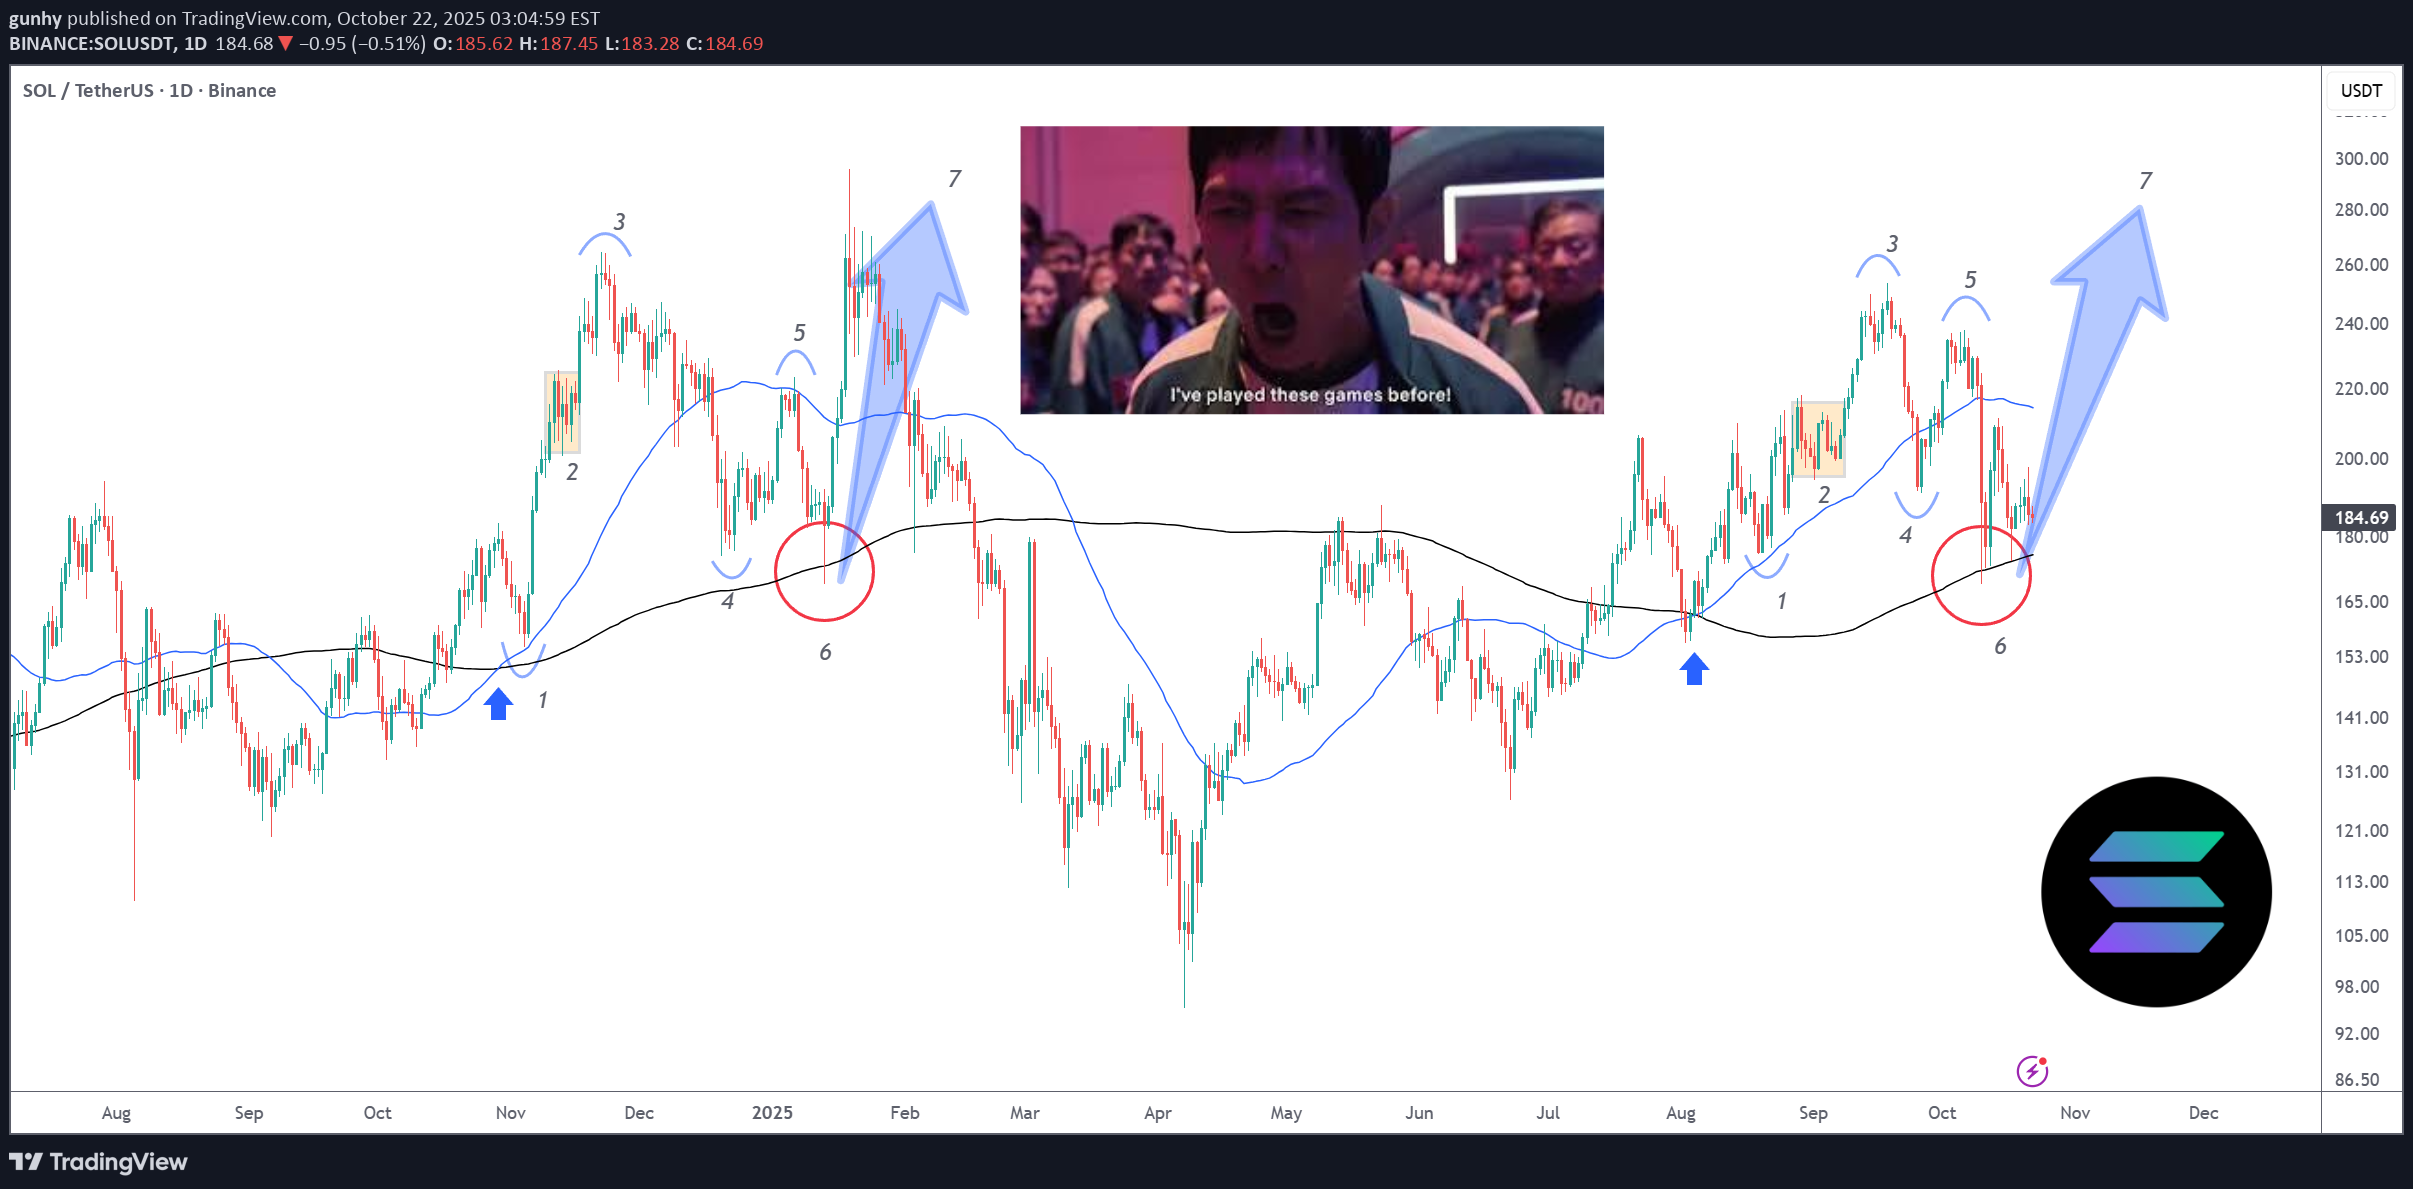
1. MA crossover and price retests the 50MA. 2. Price consolidates. 3. Higher high is printed. Traders FOMO here. 4. Higher low forms below #2 consolidation zone between the 50MA and 200MA. Traders are liquidated. Max fear period. 5. Lower high is printed. Traders FOMO here. 6. Price retests the 200MA. Traders are liquidated. Max fear period. 7. Massive leg up. The first rally was driven by Trump's inauguration. What will it be driven by this time? The end of the US government shutdown, ETF approval, interest rate cuts, quantitative easing, institutional interest, US-China trade deal, or capital rotation from traditional investment vehicles to crypto...? Take your pick.
gunhy
پایان خوش تابستان، شروعی انفجاری در اکتبر: آیا بازارها برای صعود آمادهاند؟
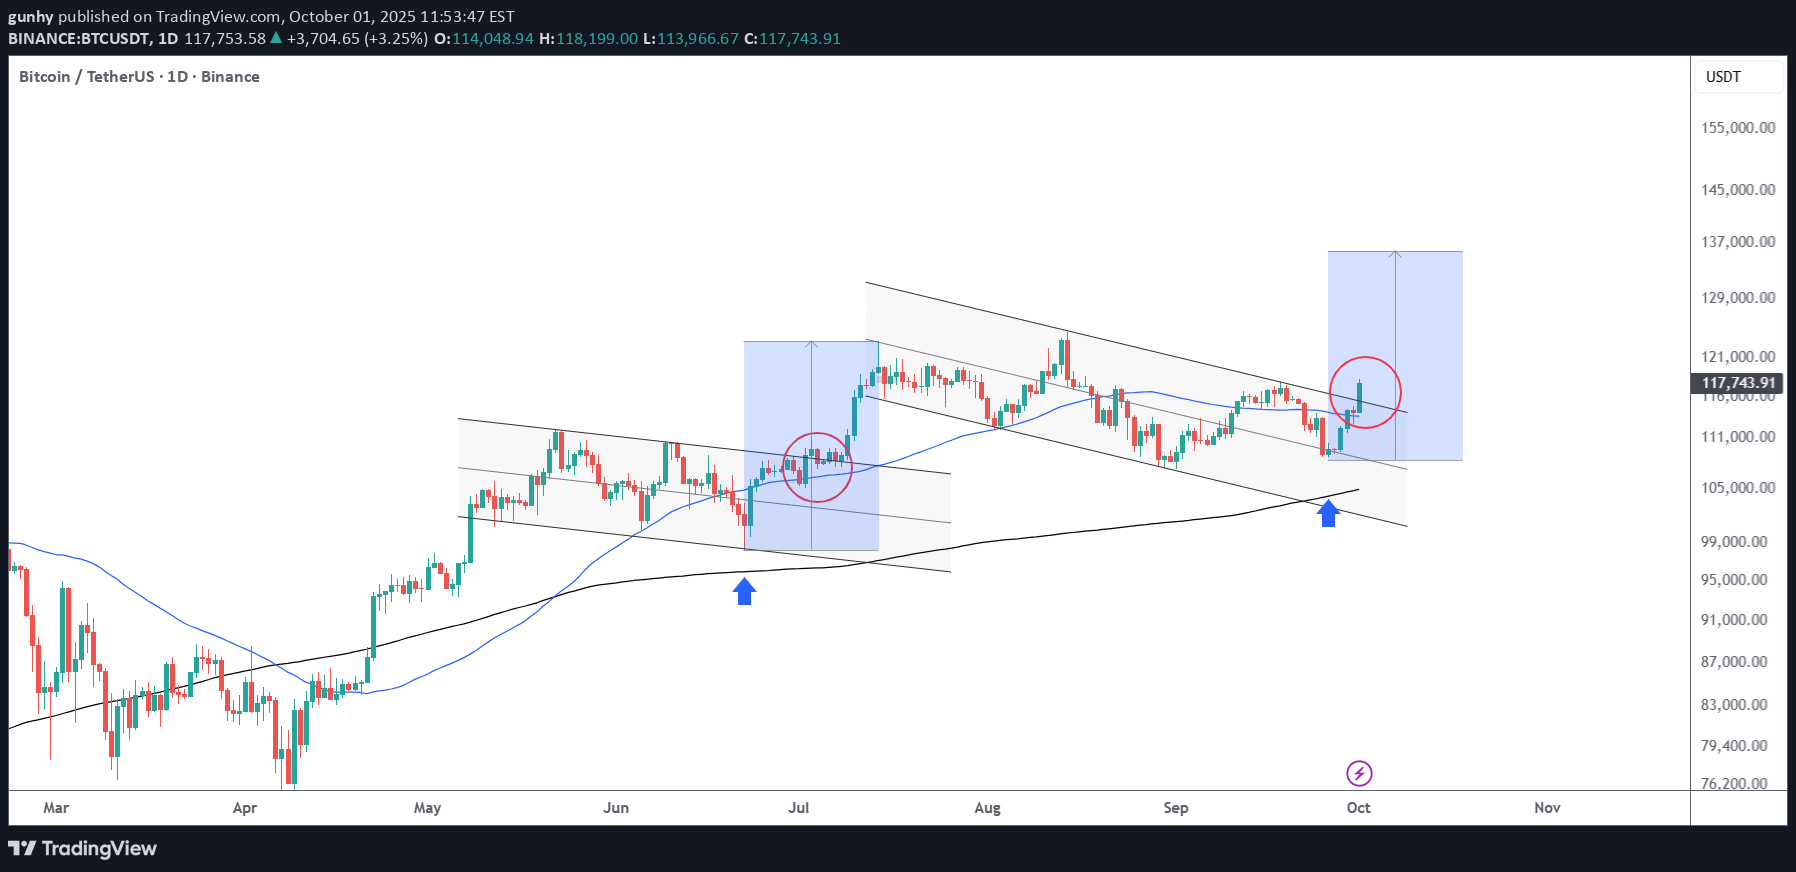
Chart says it all boys. Similar channel breakout as seen in July, except this time it's happening in Uptober. Markets are frontrunning Q4 bullishness. Send it!Historical liquidity purge. Everyone was too focused on Uptober, using dangerously high leverage for maximum gains. Everyone thought the same thing; the peak is coming. Not that it isn't true, but when everyone is blinded by greed, the market will always somehow turn against us. We need to remember that the big players are out to get us. Price spiked below the support zone and 200MA, then closed back above. Textbook liquidity hunt. Will we see another liquidity hunt below 100k? Possible, but not probable. We are already halfway through "Uptober", and there are many positive developments coming. Fed quantitative easing, interest rate cuts, and spot ETFs. That being said, we should still avoid overleveraging.
gunhy
Solana is undervalued | New ATH coming very soon | $250++

Solana is slowly but surely grinding up, following the altcoin king ETH. ETH is already near its 2024 highs of $4000. If SOL were to be in the same position as ETH in terms of price, we should be around $250. In technical terms, SOL is showing huge bullish strength at the $180 resistance. In the last attempt in breaking above this level, it faced multiple rejections and consolidated before ultimately backing down. This time, there is little to no resistance. The REX-Osprey SOL staking ETF continues to garner inflows, having only one outflow day since the launch date 2nd July. That's nearly $100 million net inflows and 11 inflow days out of 12 trading days. Imagine the demand the spot SOL ETF by big players such as VanEck, Grayscale and Fidelity will have once approved. BTC dominance is breaking below 60%. Capital is flowing from BTC into ETH, and once ETH hits $4000, a good amount will flow from ETH to SOL as people look for better potential gains.SOL retesting $180 support, healthy pull back after a strong rally to $200Bullish pinbar printed, $250 this week?Target reached on 17th September.
gunhy
Bitcoin turns bullish again | Price target = $140k++

After 2 months of consolidating within a descending channel, Bitcoin has finally broken out, confirming a major technical breakout and shifting the structure back to bullish. The breakout was followed by a clean retest of the channel resistance turned support, which is now acting as a launchpad for the next leg up. 🧠 Technical Analysis: Descending Channel Breakout: Price has convincingly broken out of the downward sloping channel, invalidating the bearish structure and flipping it bullish. Retest Confirmation: The price is currently retesting the upper boundary of the channel — a textbook bullish retest. This confirms buyer strength and shakes out weak hands. Liquidity Magnet Above 111k: A significant cluster of buyside liquidity sits above 111k. Once that level is breached, expect an explosive acceleration toward 120k. Measured Move Target: Based on the height of the prior impulse (from April to May), the projected extension points to ~140k. 🌍 Macro & Sentiment Drivers: ETF Flows & Institutional Demand: U.S. Bitcoin Spot ETFs continue to show consistent inflows, signaling strong institutional accumulation — a major shift in long-term demand. Fed Pivot Speculation: Expectations for a Fed rate cut later in 2025 are building. Lower interest rates could fuel risk-on sentiment, pushing capital back into crypto. Big Beautiful Bill: This bill is expected to inject money into the economy, increasing liquidity — ultimately going into crypto. This bill will be signed into law today. Bullish crypto developments: Settlement of the XRP SEC case, spot crypto ETFs, mainstream crypto adoptions, etc. will all contribute to the bullish sentiment. 🧩 Final Thoughts: This setup combines strong technical structure, favorable macro tailwinds, and clear liquidity targets. The coming days are critical — if Bitcoin clears 111k cleanly, it could trigger a short squeeze and FOMO-driven rally straight into 120k.Price broke out of a newly formed pennant pattern and made a new all-time high, confirming the daily bull flag breakout, although the new ATH was short-lived. For full confirmation, we want to see 112k smashed through with strong volume and thick green candles. That would make 112k a new support base.Price retraced to 120k support and took sell side liquidity right below. This is also a retest of the previously broken channel.
gunhy
Solana starting to look bullish again | Target $180 - $260

In my previous idea, I anticipated a liquidity hunt below the $140 level, and price action played out exactly as expected. SOL wicked below this key support zone, triggering stop-losses and inducing panic selling — classic behavior before a major reversal. Following this sweep, price quickly reclaimed the range, breaking out of the downward channel, and is now retesting a bullish break of a textbook cup-and-handle pattern, signaling a potential trend continuation to the upside. 📊 Technical Setup Cup and Handle formation is evident, with the "handle" forming as a downward-sloping channel now being challenged. Price reclaimed the $140 demand zone post-sweep and is now retesting. Target zones: $180 → $220 → $260 based on historical resistance levels and measured move projections. 📉 Invalidation Level A daily close below $120 (marked as the Invalidation Zone) would invalidate this setup and suggest bulls have lost control. 🌐 Macro Perspective Fed Rate Cut anticipation and cooling inflation data are helping risk-on assets like crypto regain momentum. SOL staking ETF launching this week, while SOL spot ETF approval imminent. Solana's growing DeFi ecosystem, along with high TPS performance and low fees, continues to attract developer and user activity. SOL remains a top candidate for sector outperformance in a bullish H2 crypto cycle. 📌 Conclusion With market structure turning favorable and strong macro tailwinds, SOL may be gearing up for a major breakout rally. Watch the $160 level closely — a decisive break and hold above could confirm the next leg higher.Solana's rally today was relatively muted compared to Bitcoin's and Ethereum's rallies. Solana is also far below its May $185 high, compared to Bitcoin and Ethereum being close to their May highs. Remember what happened when ETH was undervalued, trading at $1800 in early May? It skyrocketed nearly 50% to $2600. We could very well see a similar phenomenon unfold as SOL currently is undervalued. All we need is a macro trigger. (XRP-SEC case settlement? ETF approval?)$145 held strong. SOL formed a new pennant pattern and broke above. Bitcoin is making new ATHs. SOL ETF approval is getting closer each passing day.$180 hit. SOL is going much higher- altseason is just starting.
gunhy
Bitcoin to revisit $100k | Summer price target = $120k

Geopolitical tension is causing fear in the markets. Today, Bitcoin fell from $107.7k to current price $105k with no sign of buyer support whatsoever, printing 11 consecutive H1 red candles intraday. Like a hot knife through butter. At $105k, there is very little support. Sell volume absolutely overshadowed the tiny buy volume. Bulls have yet to close a green candle. I believe in the next few hours Bitcoin will be trading at $104k, followed by the first stop $102k. $102k can serve as an entry point, depending on how price reacts. $100k is the optimal entry point for maximum profit, after mass liquidations. Retail traders are confident that the liquidity hunt is over after the initial tap, placing stops and liquidation levels at $100k. Invalidation level will be beyond the 200SMA. The 200SMA have historically proven itself time and time again as a safe zone during rallies after golden crosses.Price fell through $105k like it was nothing. Current price = $104,50013 consecutive red candles on the H1 chart. Is this a first? The daily timeframe 50SMA is serving as support @ $103.8k, but there it is lacking follow up with volume. If it breaks below, next support is $101k.The 50SMA is still holding up, and volume is starting to pick up. Looking at the M15 timeframe we can see four large green candles from the 50SMA. If buyers are able to reclaim $106k, it will confirm the support rejection and move towards $108kBuyers stepping in to defend the $104k zone. In order to confirm a full reversal, price must close above $107k (above H4 moving averages).M15 chart shows buying pressure deteriorating, breaking below the ascending triangle and challenging the 50SMA.Bitcoin flushed below 100k, followed by a strong reclaim of 100k. Even while Bitcoin crashed below 100k amidst the Middle East conflict, hodlers did not panic sell. When the US bombed Iran, Bitcoin stood firm against what logic says it should do. This shows extremely strong bullish sentiment. BTC ETFs continue to print inflows day after day. Now we have two VERY positive developments for Bitcoin: -Israel-Iran ceasefire, which may finally be the end of the proxy war. -Top Fed officials leaning towards a rate cut, possibly as soon as July. See you at the top.
gunhy
Bitcoin Retests Broken Channel | Bounce to $110k?

Bitcoin is currently retesting the broken downward channel. This selloff was a market shock reaction due to Israel's airstrikes on Iran. Price found support around $103k, at the daily timeframe 50SMA. The daily 50SMA also served as support in the previous drop to $100k last week. In the chart's red circle is likely where many long leveraged positions had their stop losses or liquidation levels. We can safely assume this event was a liquidity hunt as Bitcoin remains strong above $100k. A healthy pullback to retest. Historically, we have seen similar market shock selloffs like this. One example is the 1st of October 2024 Iran strikes on Israel. Bitcoin crashed 5% from $63k to $60k. What followed after was a recovery to over $100k, never seeing $60k again. Will Bitcoin recover? We still have multiple bullish developments. Institutions are becoming increasingly interested in Bitcoin, the US Bitcoin reserve, SEC x Ripple case settlement, SOL ETF approval, Fed rate cuts, among others. Provided that the conflict does not escalate, once the market panic reaction is over, we can expect a healthy bullish continuation, as long as Bitcoin remains above $100k. We also have a massive pool of short liquidity above $111k. Once we break above this level it will be a short-squeeze to $120k.Buyers are strongly defending the $105k support which is also the daily timeframe 50MA, amidst escalating middle east tensions. This shows investor confidence in Bitcoin. This week, we should hear about the SEC vs Ripple case settlement which will further boost confidence in the entire crypto market. We should see $110k very soon, and a short squeeze to $120k once $111k level is reached.Ascending triangle pattern is forming. A bullish sign. What we need to see next is BTC breaking and closing above $106k.Price faked out below the triangle for a final $105k retest, where buyers quickly showed strength. Bitcoin now trades above $106k.Taking profit on the trade here; we are now in a bearish trend as geopolitical tensions rise. Buyers are nowhere to be found in the current move down- Bitcoin basically waterfalled down with zero resistance. A very bad sign. Will look for another entry later when everything stabilizes.
gunhy
SOLUSDT | Short-Term Target = $185

Today, we got reports that the SEC requested SOL ETF issuers to update their filings which ignited the rally past $165. This boosts investor confidence- we should see good bullish volume in the near term, targeting $185. US-China talks have also came back positive, awaiting both presidents' approval. The first hurdle, still, is the 200SMA. Ideally, we want to see a bullish close above $168. This should be easily taken this week, if not today. From there, we aim for the near term high of $185 before zooming out to aim for $250.We are on track to take $170 today! If it does happen, we will have SIX consecutive green daily candles so far. A pattern we have not seen since the very bottom of the bear market @ $8 in early 2023. What followed after that was a massive 50%+ increase in just 10 days. It probably won't happen here, but a man can dream... :+)Price is now retesting the $160 support. FOMO $168 positions are being taken out before we advance to $170.We can now focus on the previous idea- the final liquidity hunt.
gunhy
SOLUSDT | The Final Liquidity Hunt | $250 is the Next Stop

SOLUSDT is currently in an uptrend after recently breaking out of its extended downtrend to $95 which took out millions of long positions. Now, we are seeing yet another extended downtrend on the lower time frame, but the overall direction is still up. Last week, price action printed two very bullish pinbars at the $155 level which could have been considered support, where price was consolidating around late April. High leverage traders entered here and eventually got liquidated last Friday. Following the liquidity hunt, price reversed quickly, but not strong enough to reclaim the $155 zone. Many of those who were liquidated likely re-entered on this fast move, thinking that the liquidity hunt is over and price cannot move lower. I am anticipating one FINAL move down to $140 before the uptrend resumes. This will be the move that takes out the dumb money and where smart money will take their positions. The alternative is that the liquidity hunt never happens, and price breaks out of the falling wedge to resume its uptrend. What about macro and micro factors? ⚖️ Ripple vs SEC Case On 8th May, both parties agreed to settle, which ignited a massive market-wide rally. Unfortunately, their filings were rejected due to a procedural issue. The next deadline for refiling is on 16th June. Once accepted, we can expect another massive rally. 🤝 US-China Trade Talks This week, US and China will meet at the negotiation table again. On 12th May, US & China reached a deal in Geneva and sent markets on another rally. IF (big if) they come to another deal this time, we can expect another rally. ✂️ Fed Rate Cut Expectations The Fed talked about cutting interest rates in late 2025. They are currently in a "wait and see" stance however, due to uncertainties. Eventually we will see a rate cut, and I believe this would be a "buy the rumor, sell the news" event. Markets will price in the anticipated rate cut before it happens later this year. Our first price target is $250.SOL is breaking out of the wedge with good volume, attempting to reclaim $155 after a slow weekend. On the H4 timeframe we can see that the wedge was retested earlier. If today's candle prints green, we will have 4 consecutive green daily candles- very strong indication that buyers are stepping in. 4 consecutive green daily candles are relatively uncommon, and in most cases precedes rallies. Bitcoin is also breaking out of its downward channel and reclaiming 107k with strong volume. The pawns (altcoins) will follow the king (Bitcoin). The further we go from $140, the less likely the final liquidity will take place.The battle between $160 sellers and $155 buyers is forming a consolidation range. All we need is to overpower the sellers and establish a base at $165, and we're home free going towards $180 and beyond. I'm willing to bet on the upside as ETH and BTC confluence is hinting at another rally. Very soon we will hear updates from the US-China talks which will be the rocket fuel.$160 resistance destroyed and we are moving fast to claim $165, powered by reports of SEC's request for spot SOL ETF issuers to update their filings. This indicates development for approval. If this hype keeps up, we could be going straight past the $185 resistance. I believe once the Ripple vs SEC case is settled, possibly late June, approval becomes imminent in the coming weeks. US-China talks have also produced positive results, creating renewed optimism. Everything points to an all-out market-wide rally. The final liquidity hunt is now highly unlikely.And so, it happens against all odds. A few hours ago, Israel launched strikes against Iran, taking SOL diving from $155 to $140. Outlook is becoming increasingly bearish. Will you buy while the markets bleed?SOL is printing a bullish engulfing candle, confirming the support level at $140 and reclaiming the $150 level. However, a new downward channel has revealed itself. Ideally, SOL should reclaim the $170 level to confirm the bullish outlook, followed by a close above $190. We are currently in a chop range between $140 - $180, not an ideal place to go long. BTC and ETH however, still look very bullish. Alts go where Bitcoin goes. If confluence serves SOL right, this chop range should be over soon. We shall also see if the macro background takes SOL higher or not.
gunhy
Day Trade - Long following the stop hunt

Within 1 hour of London open, all Asian session gains were erased. Most traders would have entered @ 2618 with SL below the support zone and get stop hunted. Now we see a RSI divergence as well as an engulfing candle which might indicate a reversal to the upside following the stop hunt. Good risk reward of 1:3Another engulfing candle is printing. This time engulfing 4 consolidation candles.
Disclaimer
Any content and materials included in Sahmeto's website and official communication channels are a compilation of personal opinions and analyses and are not binding. They do not constitute any recommendation for buying, selling, entering or exiting the stock market and cryptocurrency market. Also, all news and analyses included in the website and channels are merely republished information from official and unofficial domestic and foreign sources, and it is obvious that users of the said content are responsible for following up and ensuring the authenticity and accuracy of the materials. Therefore, while disclaiming responsibility, it is declared that the responsibility for any decision-making, action, and potential profit and loss in the capital market and cryptocurrency market lies with the trader.