
gen1trade
@t_gen1trade

What symbols does the trader recommend buying?
Purchase History
پیام های تریدر
Filter
Signal Type
gen1trade
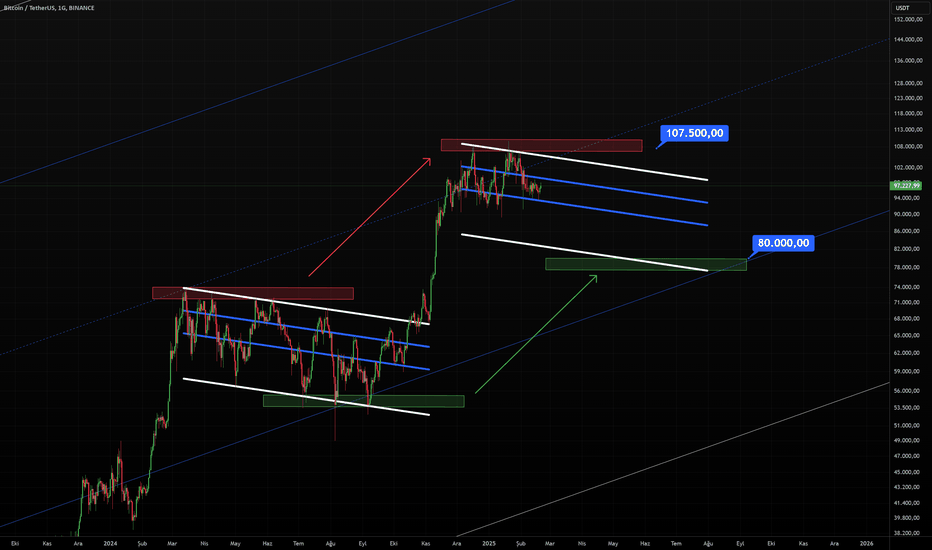
There is nothing to talk about much, the closing of over 107,500 with the start of the Fed interest rate cuts arrival. Try 80,000 until he reaches that point.
gen1trade
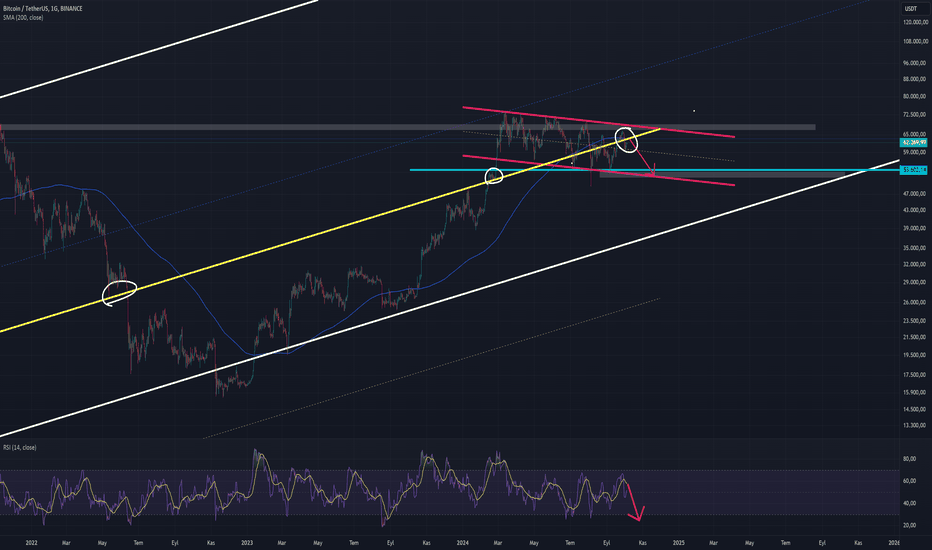
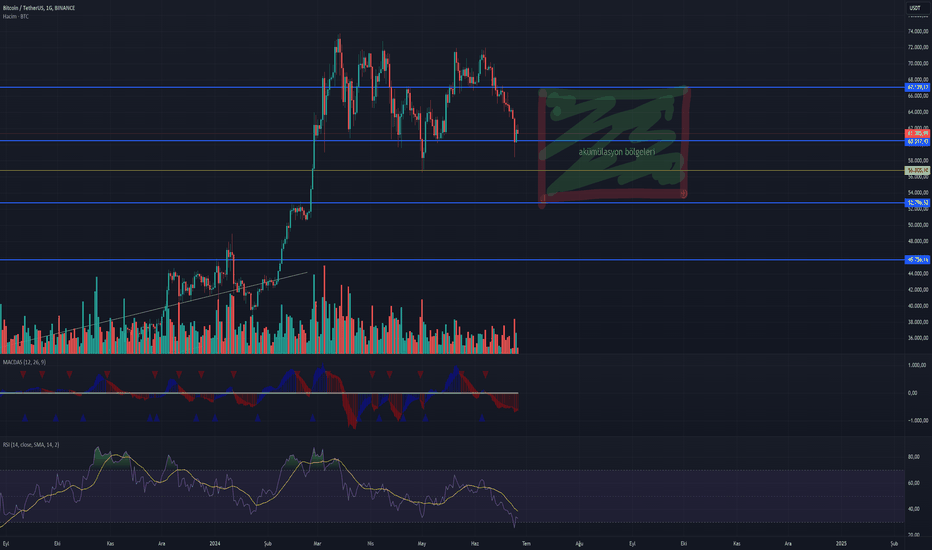
We have a long-term uptrend channel that has been valid since 2017. This trend, which has formed on a logarithmic scale on the daily chart, continues to guide the Bitcoin price movements in the long term. As seen in the regions I marked on the yellow trend line on the chart, we observe that significant price movements are usually triggered in the periods when it remains above or below the line. In particular, we see a strong movement coming when the price has previously approached this yellow trend line and broken down or up. Similarly, when we look at the current price movement, I think that selling pressure will continue after a weekly close below the yellow trend line. In addition, the price is currently below the 200-day simple moving average. If Bitcoin's recent move tests the SMA200 level and fails to break this important resistance level, we can see voluminous and long red candles at or below the channel support level. Generally, when it remains below the SMA200, the market tends to exhibit more weakness. Therefore, if it remains below SMA200, I expect the downward movement to accelerate. The RSI indicator also supports the bearish expectation. Since the RSI remains below its moving average, we see that the momentum in the market is negative. Both the SMA200 working as resistance and the RSI giving a downward signal are technical factors that strengthen the downward trend in Bitcoin. On the geopolitical side, the Russia-Ukraine war and the tensions in the Middle East continue to suppress risk appetite in global markets. The negative impact of these developments on risky assets may also affect assets such as Bitcoin. In this context, I expect a pullback towards the $50,000 levels, which is the support of the channel alt in the first stage. The 50,000 level is an important point as both a long-term trend support and an important psychological support.
gen1trade
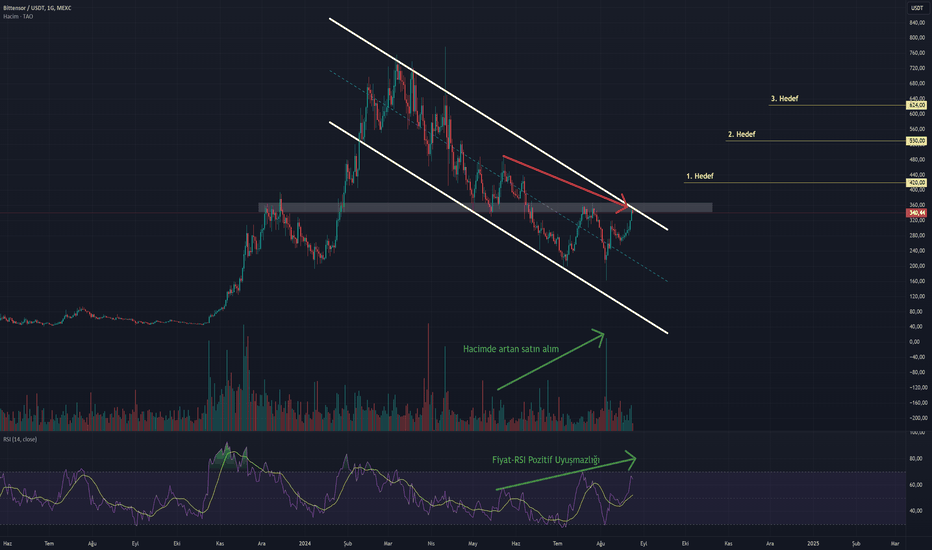
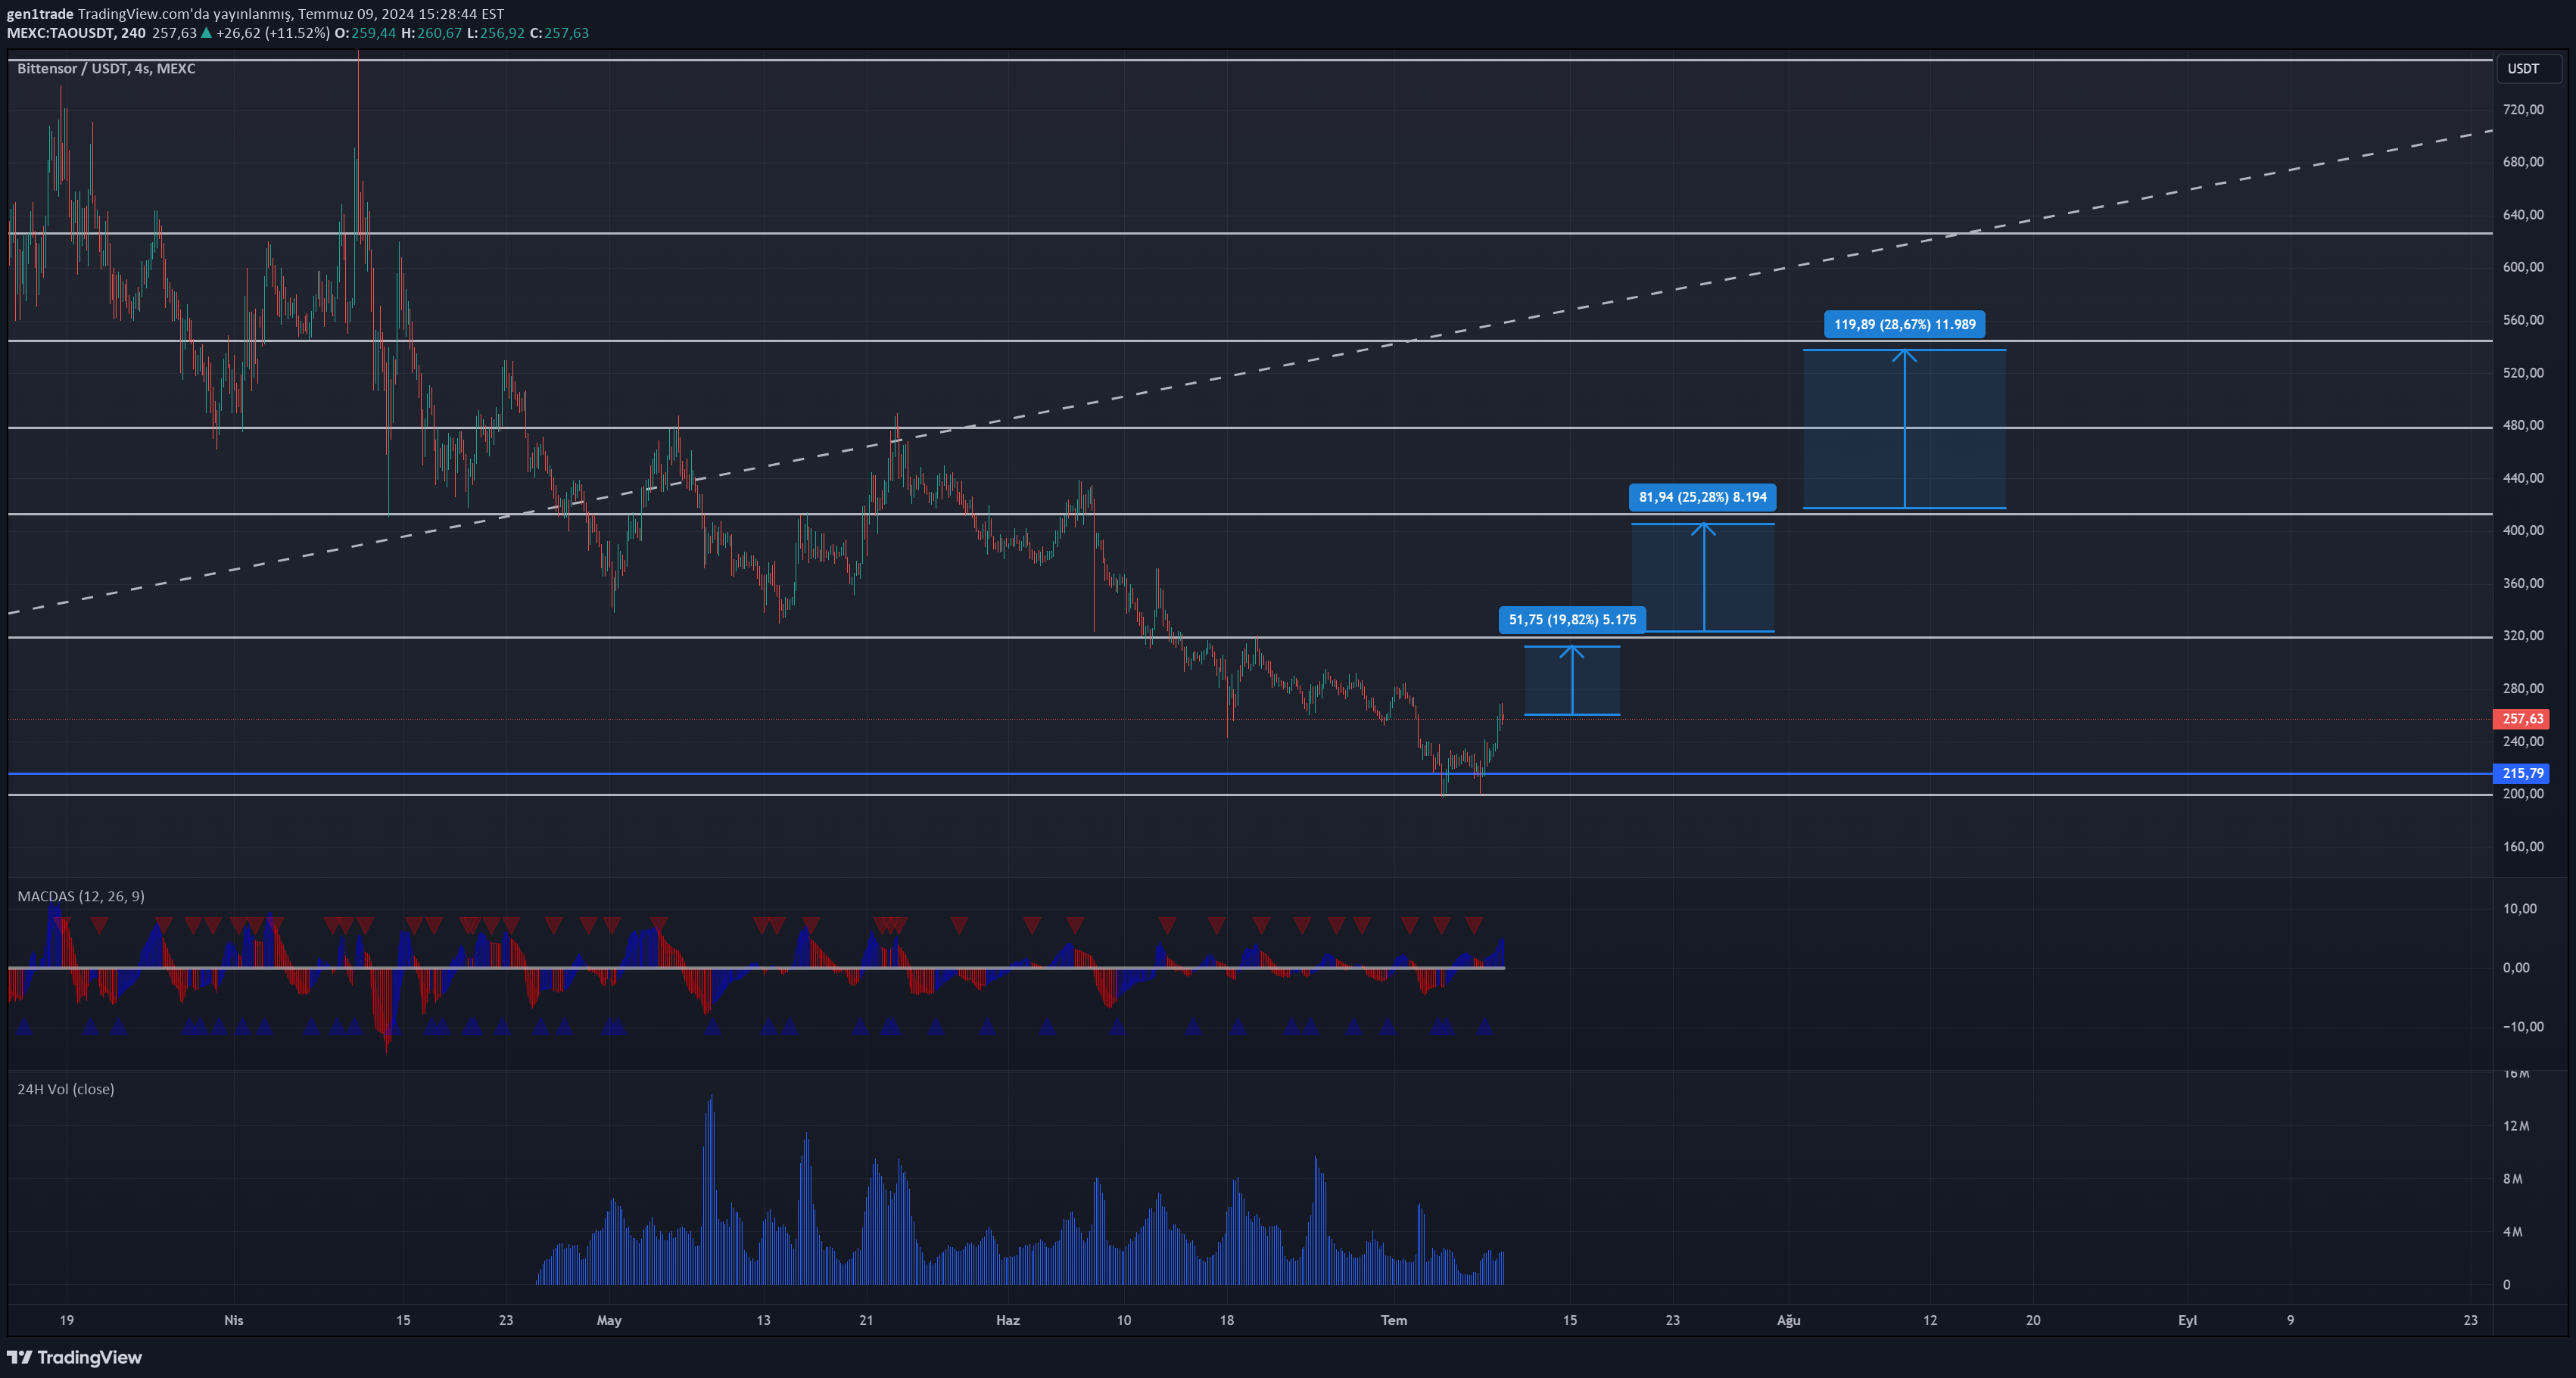
In my previous analysis, I mentioned that Bittensor has an important place among the "decentralized artificial intelligence protocols" and is worth researching. When we look at the graph, three important points appear. Increased purchases in volume: The graph shows significant increase in the volume indicator. This may be a sign that the interest of buyers in the market increases and potentially supported the upward movement of the price. Price-RSI Positive dispute: Although it tends to decline in the price channel, we observe an upward movement in the RSI indicator. This positive dispute may be a harbinger that the current decrease trend is about to end. Fracture of the falling trend: I think that we can expect a movement to break the right price to the falling trend line seen on the graphic with volume and RSI information and to break this trend. Grayscale Decentralized AI Fund and Tao's future Decentralized AI Fund, which Grayscale founded about 1.5-2 months ago, is among the assets contained in Fund. Although this ratio seems to be low at the beginning, you can see that the ratio has increased a little more since the installation of this fund. I believe that TAO will gain more value over time in this fund. You can reach the Grayscale official document via the official website. In general, it is possible to say that TAO has an upward movement potential, considering both the technical indicators and the presence of the fund. Especially if the falling trend is broken, it is possible to see upward green candles upward. Conclusion: Based on this analysis, we have gone through a period that needs to be followed carefully in the TAO/USDT parity and if a possible falling trend breakage and rise trend starts, I think that the target levels I mentioned on the graph can be reached.
gen1trade
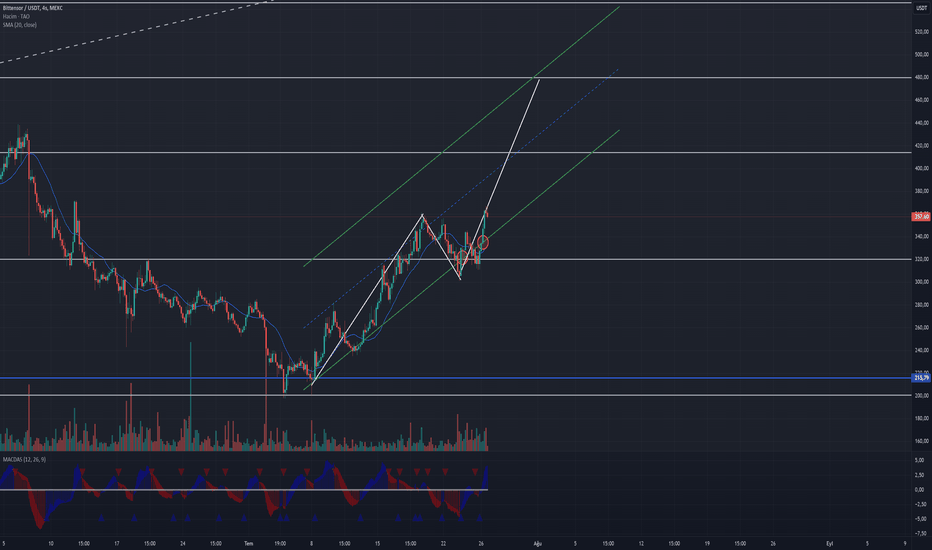
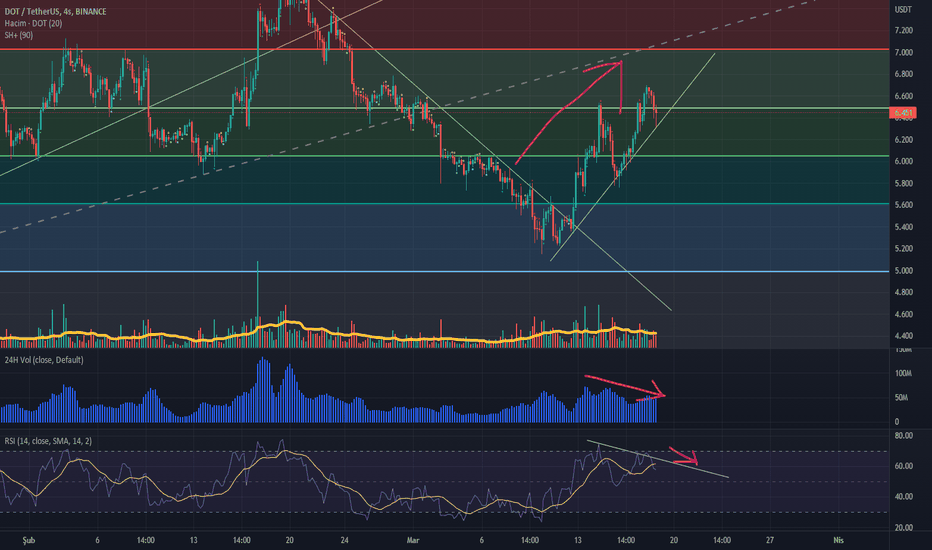
I think we have received our approval for the target with the channel input, it is really a lot of fake breaks speculators, if you can sense this policy, we can see large and voluminous candles together. All of my analyzes are crazy nonsense, imagination :) Al-Sat-Tut is not advice.
gen1trade
gen1trade
If you don't know TAO. Know. Go directly, read the whitepaper, enter the servers and do detailed technical research. I think there will be no other project in the future that will combine Decentralization and Artificial Intelligence in this way. In my opinion, every hard red candle in the market right now should be seen as a buying opportunity and should be bought as it falls. The target levels are on the chart, personally, I would be costing such a project at as low prices as possible and selling it at the levels on the chart. My tactic is actually very simple :) I wish everyone to do a lot of research and fully understand the essence of the system. YTD
gen1trade
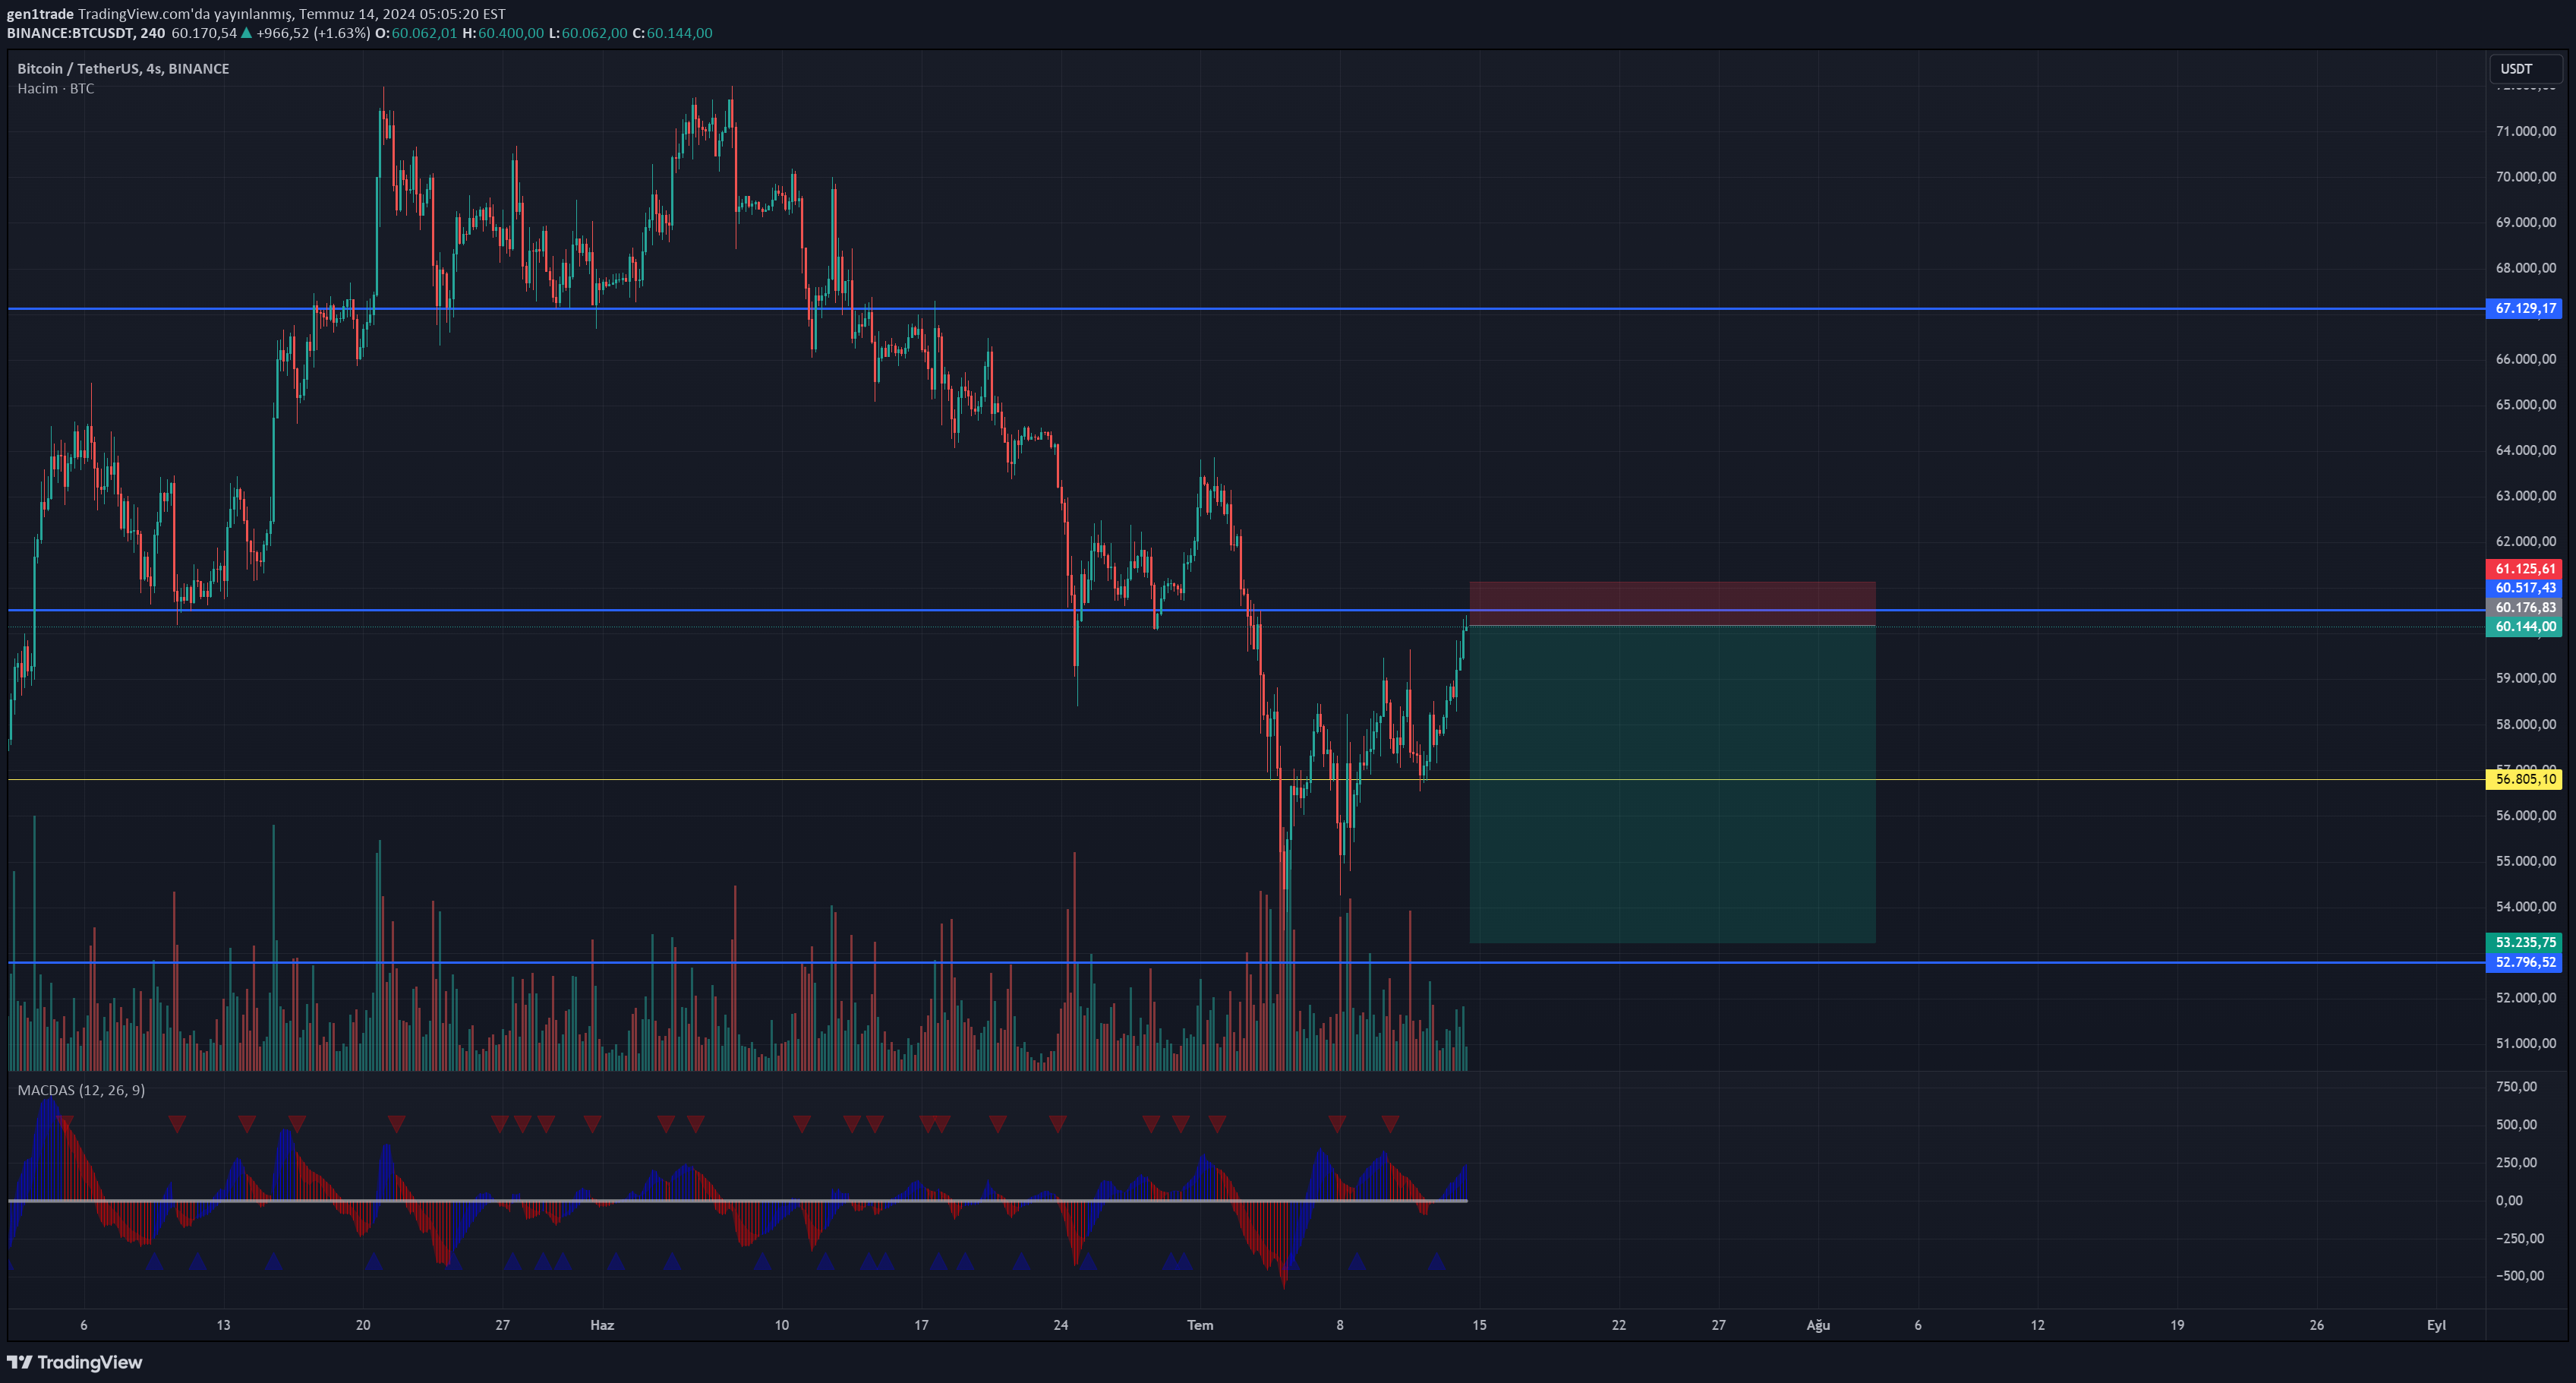
Greetings :) Yahu friends, that zart formation, the tyrannical wave or something, let us talk a little supply demand. In addition, ratio moran is writing or no 0.96 68 Cart Curt: Daçın All-Time graph review, see a look. Where the price has been in demand from where, let me tell you, they are all in the graphics. When approaching the demand zone (AKA support zones) Long, the supply zone (also known as resistance) Short. It is so simple.stop Loss: We will also think of the scenario we stay in reverse in each process, a break of "voluminous" breaks down to the bottom or up of the levels and closes the wax, we will turn the position to the contrast. To you, "E teacher now", now I do not know what to do. I say that I will do it like this, I will do it like this. Here's the scientific approach, take you risk management. We don't find the money on the street, but guys. These formations did not finish the mother also sell the mother :))) 65k levels are here? If your longing explodes, let's say the rise is close. YTD60 I had stopped first in thousand, then I fired friends. Look, even a very simple strategy has already put the safe. We see harsh gestures, lower waxes from the YTDDESTEK levels. After a dreamer of 60 thousand lower, we had a stop on our long. And we opened Short with a trace stop. The safe is more than ever. We locked the wife with a stop. We continue to watch the market. For a few days, I think it will be in the 52-56 band. If another hard movement comes, I'm afraid 45 thousand.
gen1trade
The price is a valuable new heights, while the volume has a reversal decrease. My personal opinion is that the market will eventually pricing this dispute. Of course YTD.
gen1trade
It is useful to go with a stop. The RSI dispute also seems a little unpleasant. It can regress us to the $ 50 band
gen1trade
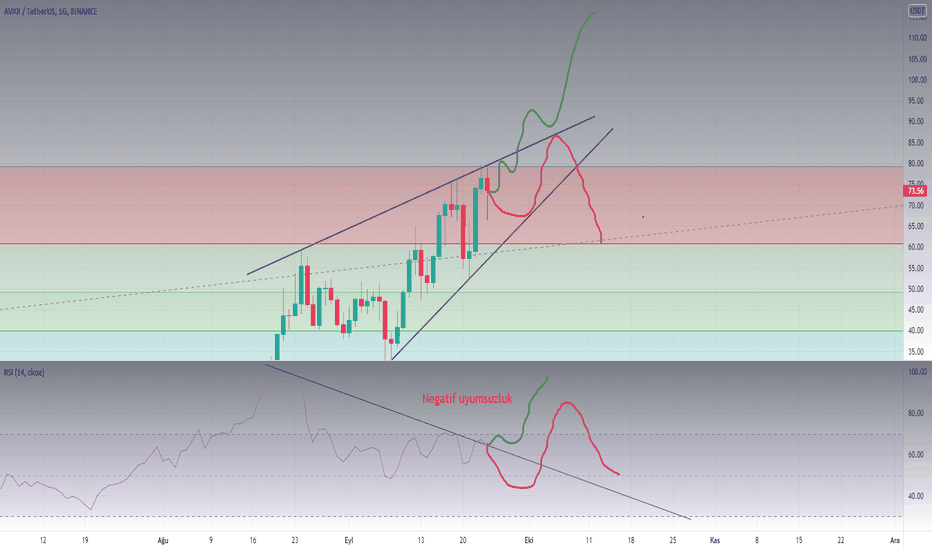
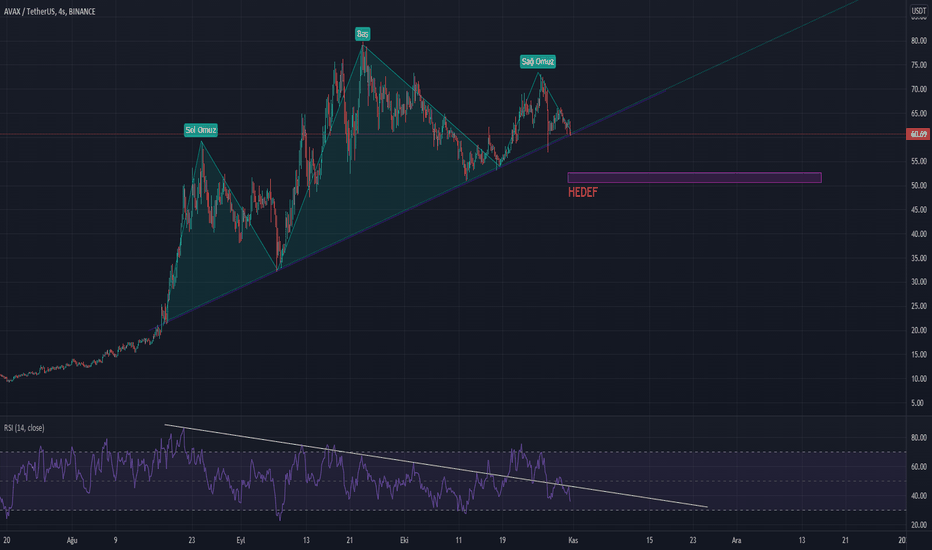
There is a rising wedge formation in the daily, and there is also negative incompatibility in RSI. I think there are two possibilities in this case. 1. They can turn AVAX into a second case. In this case, RSI, formation, etc. does not rest. They may disrupt the bear formation that I am in this blood. It is the estimation of this possibility that I draw with green color in the graph. 2. It can be priced, such as the fact that BTC in the past weeks falls from $ 50k to 40K band. This will be temporary. The arrows will be turned up after a correction. In general, my blood will go upward in the long term. You can find the basic analysis from my previous analysis. Of course it is not an investment advice. It will be healthier to make your own decision with your own research.
Disclaimer
Any content and materials included in Sahmeto's website and official communication channels are a compilation of personal opinions and analyses and are not binding. They do not constitute any recommendation for buying, selling, entering or exiting the stock market and cryptocurrency market. Also, all news and analyses included in the website and channels are merely republished information from official and unofficial domestic and foreign sources, and it is obvious that users of the said content are responsible for following up and ensuring the authenticity and accuracy of the materials. Therefore, while disclaiming responsibility, it is declared that the responsibility for any decision-making, action, and potential profit and loss in the capital market and cryptocurrency market lies with the trader.