
fibcos
@t_fibcos

What symbols does the trader recommend buying?
Purchase History
پیام های تریدر
Filter
fibcos
سقوط بیت کوین تازه شروع شده است: زنگ خطر برای ریزش بزرگ BTC!
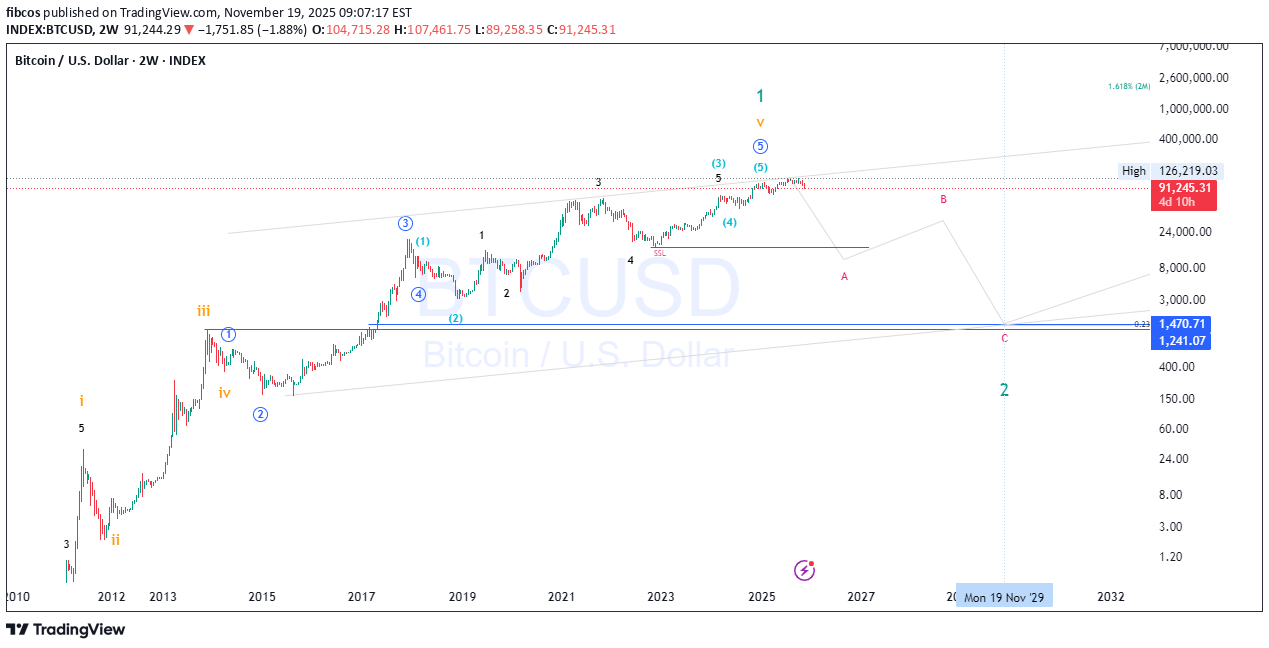
⚠️ THE GREAT BITCOIN REVERSAL — THE STORM NO ONE IS READY FOR ⚠️ For years, Bitcoin BTCUSD climbed with the arrogance of a king convinced its throne was eternal. But every empire falls. And the chart… The chart has been whispering the truth long before anyone wanted to hear it. Today, that whisper has become a SCREAM. 📉⚡ 🔥 1. The Final Wave Has Broken — and So Has the Illusion The macro Wave 5 top is in. Perfect confluence. Perfect exhaustion. Perfect euphoria. The same pattern that ended EVERY Bitcoin mega-cycle… just printed again. This wasn’t a top. It was THE top. The moment the bull cycle let out its final breath. 💀📈 🩸 2. Smart Money Has Already Left the Building While retail celebrated “new highs,” Smart Money carved out: • Stop hunts • Liquidity grabs • Breaker blocks • Distribution ranges • A devastating SOW • And the cleanest market structure break BTC has shown since 2018 Institutions aren’t buying dips. They are offloading the mountain . The crowd doesn’t see it — yet. ⚡ 3. A Market Structure Collapse Echoing 2014, 2018 and 2021 Each cycle’s death began the same way: A gentle pullback… A sudden rejection… Then a violent swing failure , followed by the HTF structure snapping in half. That exact sequence is happening right now . This is not a correction. This is a cycle reset . 🎯 4. Fibonacci Retracements Don’t Lie — They Warn Every true macro Wave 2 in history has returned to: 🔻 0.786 🔻 0.886 🔻 1.0 – 1.618 extensions Where do they converge this time? 👇 🔮 $6,000 – $1,250 The forgotten land of 2017 mania… A level BTC has avoided for 8 years. But the cycle demands balance. And balance always returns. 🌪️ 5. Price Action Has Flipped From Confidence to Panic The candles have changed character: • Weak closes • Long tall wicks of rejection • Failed rallies • Imbalances breaking lower • Bull traps everywhere • A violent displacement to the downside This isn’t cooling off. This is unwinding. 📉 6. Market Cycle Psychology Has Entered Its Darkest Phase We just exited Euphoria. We are in Complacency. Next comes: 😨 Anxiety 😱 Fear 💀 Capitulation 🔥 Anger 🌑 Depression Only after that does a new accumulation begin. And that’s why Wave 2 is infamous. It destroys what Wave 1 built. 🚨 THE VERDICT: THE DOWNFALL IS IN MOTION — AND WE ARE EARLY From $126K to $90K was not the crash. It was merely the first spark in a forest full of dry leaves. Wave A has barely begun. Wave B will deceive. Wave C will devastate. The endgame target remains: 🎯 $1,250 – $6,000 The cycle reset. The cleanse. The opportunity of the decade — but only after the fire burns everything above it. 🔥 This is not fear. This is structure, math, psychology, liquidity, and time itself. And all of them point in the same direction. Down, Down And Down 🔥 Follow this idea to stay ahead of the next macro move. 📈 We’ll update the chart as the structure unfolds — Wave A, Wave B trap, and the full Wave C capitulation zone. 💬 Drop your thoughts below — agree or disagree, the chart will decide. 🚀 Turn on notifications so you don’t miss the next critical breakdown. ⚠️ DISCLAIMER: This analysis is for educational and informational purposes only. Not financial advice. Always manage risk and make decisions based on your own research and personal strategy. #Bitcoin #BTC #Crypto #CryptoAnalysis #TradingView #BTCUSD #BearMarket #ElliottWave #SmartMoney #PriceAction #MarketCycle #Fibonacci #TechnicalAnalysis #CryptoCrash #CryptoWarning
fibcos
تله نهنگها در انتظار Zcash: آیا سقوط به زیر 350 دلار قطعی است؟
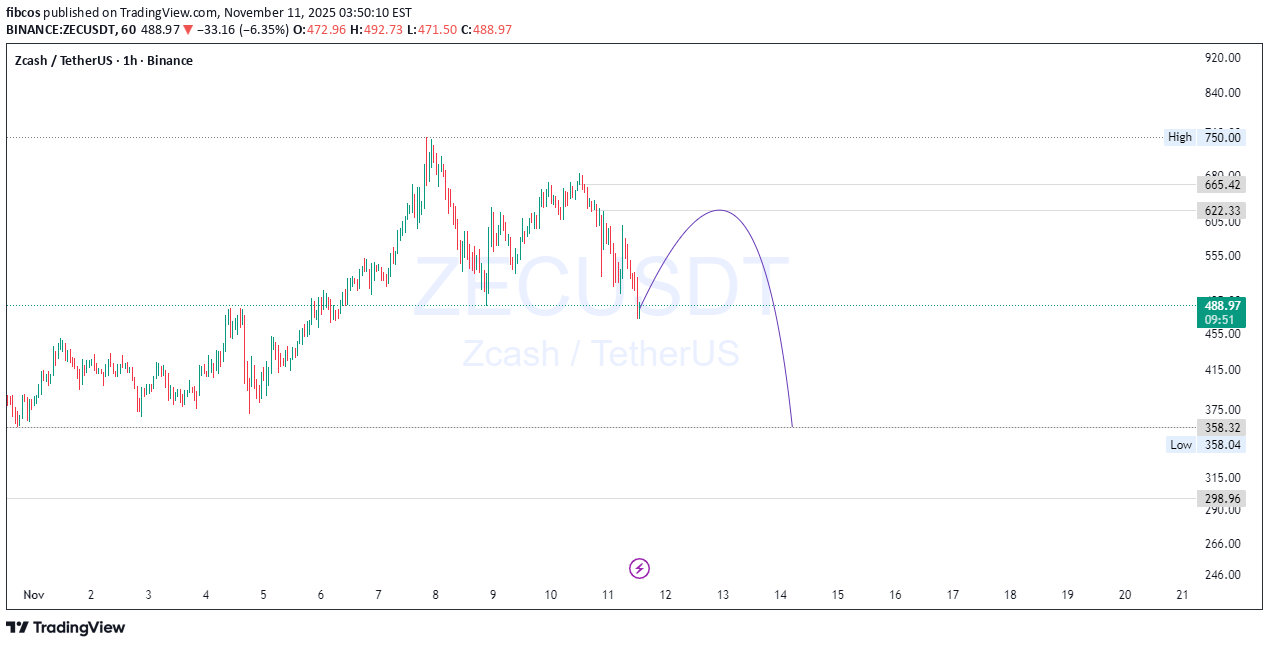
🧠 ZEC/USDT – Smart Money Trap Before the Drop? Zcash just swept liquidity below a key short-term low 👀 — now reacting from a demand zone, but volume confirms weak bullish intent. Expect a liquidity grab + distribution phase before price dives toward the $300–$350 range, aligning with higher-timeframe imbalance fills and unmitigated demand below. Smart Money might be engineering one last bull trap before the real markdown begins. 📉 Watch for rejection from the $620–$650 supply zone to confirm the move! #ZECUSDT #Zcash #CryptoAnalysis #PriceAction #SmartMoneyConcepts #LiquidityGrab #BearishSetup #CryptoTraders #TradingView #Fibonacci #SwingTrade #MarketStructureBreak #Wyckoff #SMC 💬 What’s your bias — bull trap or reversal? Drop your thoughts below 👇Zcash delivered substantial gains in both directions, providing strong profit opportunities for traders across long and short positions.
fibcos
هشدار طلا: تله هوشمندانه برای فروش / منتظر سقوط سنگین قبل از جهش به ۵۱۰۰ باشید!
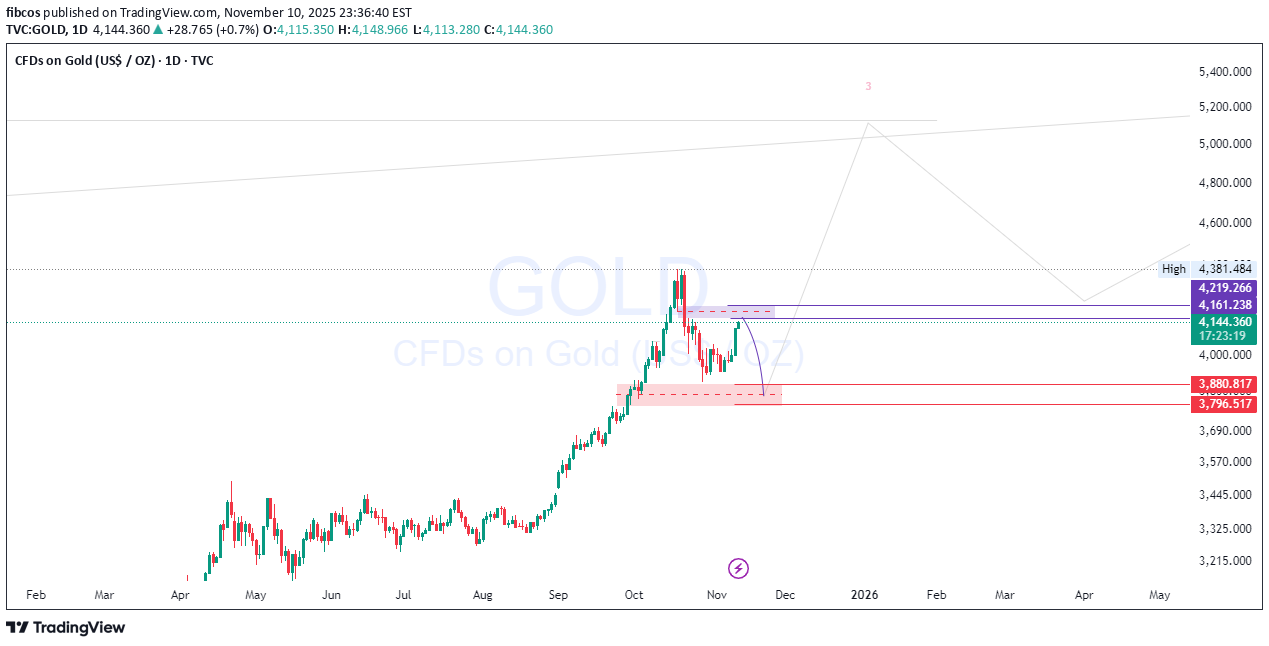
💥 GOLD: Smart Money is setting the trap! 💰 Expect a dip to 🟩 3800 before the $5,100 breakout. Don’t chase — position smart. 🚀 Gold has been unstoppable — printing higher highs and leaving emotional traders behind. But now… the Smart Money trap is loading ⚠️ Price has tapped into the 🟥 4160–4220 premium zone , where liquidity is stacked and institutions quietly prepare their next move. Before the massive bullish rally to $5,100+ , expect one last shakeou t — a dip engineered to flush retail longs and reload institutional buys near 🟩 3880–3800. The crowd will panic. The pros will accumulate. Stay patient, trade smart. 🧠✨ 📊 Smart Money Breakdown: 🧠 Institutional Playbook: Liquidity resting above recent highs 🧲 🟥 4160–4220 = Smart Money Distribution Zone 🟩 3880–3800 = Discount Reaccumulation Zone Expect a fake-out drop → explosive bullish reversal 💡 Trade Plan: 🔻 Sell Zone: 🟥 4,161 – 4,219 🎯 Targets: 🟩 3,880 – 3,800 (ideal long re-entry area) 🚀 Ultimate Target: $5,100+ (once discount OB holds) 🟨 Price Action Confluences: Liquidity sweep above structure highs 🩸 Fair Value Gap + Order Block alignment ⚙️ Higher-timeframe BOS still intact 💪 Elliott-style wave 2 correction before next expansion 🌊 🧭 Bias Overview: 🟥 Short-term: Controlled bearish correction 🟩 Mid-term: Explosive bullish continuation → $5,100+ 💭 Mindset: Trade the trap — not the emotion . ⚠️ Disclaimer: This content is for educational and informational purposes only. It does not constitute financial advice. Always apply your own analysis and risk management before trading. 💡 🔥 Follow for Smart Money + Price Action setups the big banks don’t share! 💬 Comment below — are you selling the trap or waiting to buy the dip? ⚡ Let’s ride the Gold move together — with precision, not emotion. #Gold #XAUUSD #SmartMoneyConcepts #PriceAction #LiquiditySweep #OrderBlock #SwingTrading #Commodities #GoldAnalysis #FVG #TradingView #InstitutionalTrading #MarketStructure #GoldForecast #ForexGold tapped into our selling zone as predicted. We’ll be watching closely to see if price action unfolds as planned.
fibcos
مسیر مخفی فیبوناچی متا: آیا آماده رسیدن به ۴۰۰۰ دلار هستید؟ (پیشبینی موج ۳)
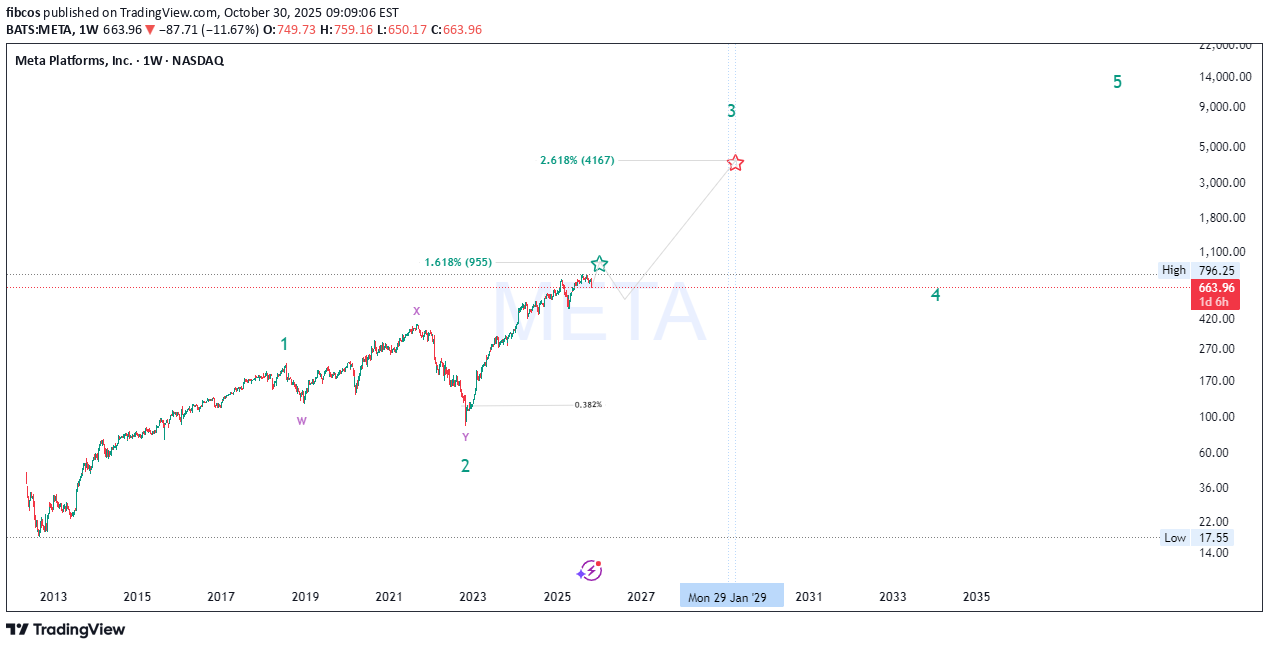
🚀 META Long-Term Elliott Wave + Smart Money Macro Outlook 🌊 Elliott Wave Structure (662→955→4000+) META appears to be progressing through a major impulsive 5-wave supercycle on the weekly timeframe: Wave 1: The initial breakout from accumulation (2015–2021), fueled by growth in advertising dominance and metaverse expansion narratives. Wave 2: Deep corrective W–X–Y structure into the 2022 low around $90 — a classic multi-year liquidity sweep and re-accumulation phase. Wave 3 (in progress): This is typically the strongest and most extended wave , with Fibonacci projections aligning near the 2.618 extension ≈ $4,160 , targeting 2028–2029 based on current momentum. Wave 4: Expected to form a macro re-distribution or range between ~$900–$1,000 before the final parabolic Wave 5, likely extending toward $10K+ . 💡 Wave Confluence: 1.618 Fib extension of Wave 1 → Wave 3 aligns around $955 , acting as the first major resistance (and your current high zone). 2.618 Fib extension → next macro target $4,160 , confirming bullish impulsive momentum. 🧠 Smart Money Concepts (SMC) The 2022–2023 bottom represents a “Displacement + Re-accumulation” phase , with institutions absorbing liquidity beneath previous demand zones. Current price action (mid-2025) shows a premium range reaction , where smart money is likely taking partial profits before the next accumulation leg. Expect a retracement into the 0.382–0.5 Fib zone ($420–$500) to rebalance inefficiencies before continuation toward macro Wave 3 targets. Key Reaccumulation Zone: $420–$500 — watch for BOS (Break of Structure) confirmation and liquidity sweeps below equal lows. 🔍 Fibonacci Alignment 0.382 retrace marks ideal Wave 4 re-entry. 1.618 & 2.618 extensions align perfectly with the Wave 3 and 5 confluences — textbook impulsive expansion. Each extension zone has been confirmed with prior liquidity sweeps and displacement candles, increasing Fibonacci reliability 📈. 📊 Market Structure & Price Action META maintains a strong bullish market structure of Higher Highs (HH) and Higher Lows (HL) since 2023. The recent 9% correction (-$69) is likely a short-term liquidity grab — not structural weakness. As long as price holds above $420 , macro bullish market structure remains intact. Volume profile shows heavy accumulation between $300–$450 , suggesting smart money is still positioned long-term bullish. 💰 Fundamental Confluence META’s fundamentals are catching up with technicals: Massive AI CapEx and ad recovery boosting EPS growth 📊 Metaverse burn rate shrinking , improving profitability Share buybacks providing a floor for price corrections Macro environment supports tech leadership rotation , and META remains a key beneficiary of the AI + social data synergy cycle 🔄 🔮 Market Cycle View We’re entering the “Expansion Phase” of the broader innovation cycle. 2018–2022 = Accumulation/Disbelief 2023–2025 = Early Markup / Smart Money Entry 2025–2029 = Public Participation Phase (Wave 3) 💥 Post-2029 = Euphoria / Distribution (Wave 5) 😱 ⚙️ Key Levels to Watch Support Zones: $420 – $500 (Wave 4 re-entry) Resistance Levels: $955 → $4,160 (Wave 3 targets) Invalidation: Sustained break below $300 on weekly close 📈 Summary META remains one of the strongest macro bullish charts in big tech — with perfect alignment across Elliott Wave, SMC, Fibonacci , and fundamental cycle theory . We’re currently witnessing the mid-phase of Wave 3 , with institutional repositioning before the next vertical leg. Patience and precision around the reaccumulation zone ($420–$500) could provide the golden setup before the next expansion wave 🚀🌕 #META #ElliottWave #SmartMoneyConcepts #Fibonacci #Wave3 #BullMarket #AIStocks #TechnicalAnalysis #TradingView
fibcos
تحلیل موج الیوت: مسیر انفجاری انویدیا (NVDA) تا ۲۶,۰۰۰ دلار!
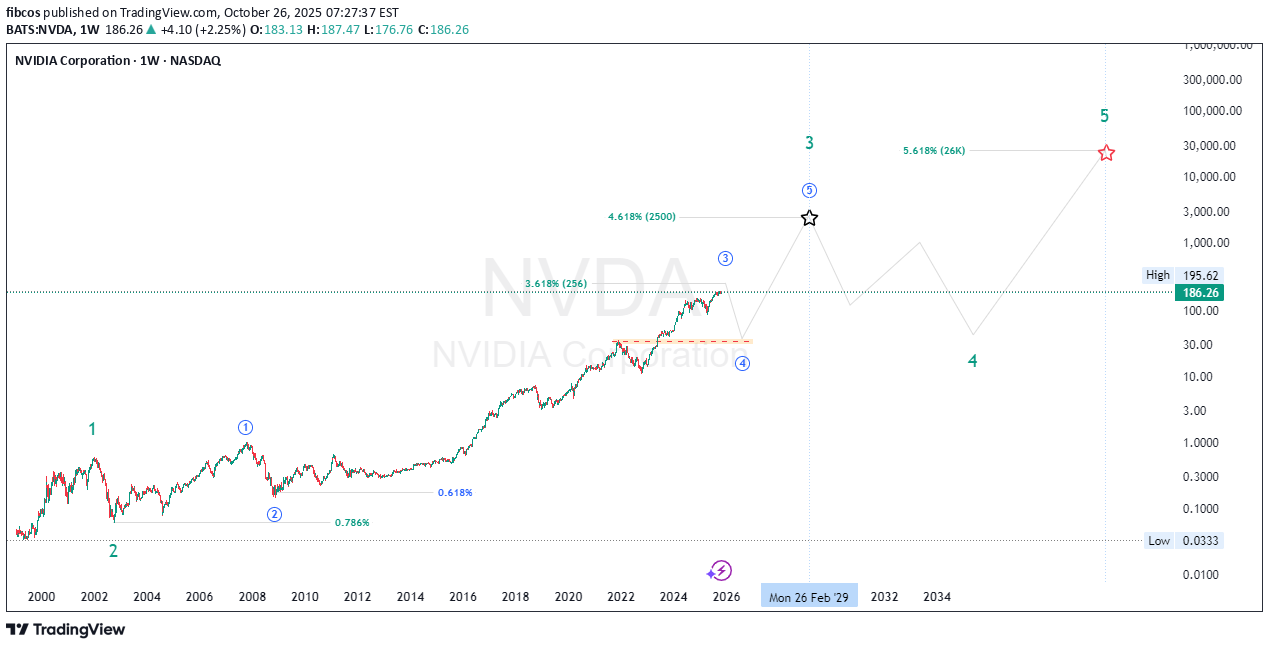
Summary: “Elliott Waves, Fibonacci, and Smart Money align perfectly — NVIDIA’s long-term chart points to an AI-powered Supercycle with massive upside." 💎📊 🚀 NVDA | The Supercycle of the AI Era! 💚 🌀 Elliott Wave Supercycle Breakdown NVIDIA’s price action over the past two decades is a textbook example of a multi-decade Elliott Wave Supercycle — where technical , fundamentals , and Smart Money flows perfectly align to form a once-in-a-generation structure 🌎 Let’s break it down step-by-step 👇 Super Cycle Wave (1) — launched in the early 2000s, marking NVDA’s first growth phase during the birth of consumer GPUs 🎮. Super Cycle Wave (2) — deep correction into 2002, retracing a 0.786 Fibonacci, cleansing early euphoria and creating the foundation for institutional accumulation 💼. Then began the Super Cycle Wave (3) — the most powerful phase of all. Within it, we have distinct macro sub-waves: 1️⃣ Macro Wave (1) — ended in 2007 , aligning with the first institutional wave of adoption. 2️⃣ Macro Wave (2) — retraced 0.618 in 2008 , coinciding with the global financial crisis (perfect Smart Money shakeout). 3️⃣ Macro Wave (3) — the current dominant leg, fueled by exponential AI and data center growth . It’s extending toward the 3.618 Fibonacci extension (~$256) , confirming wave strength and institutional conviction. 4️⃣ Macro Wave (4) — expected between 2026–2027, likely retracing 0.236–0.382, a natural cooling period before the next breakout. 5️⃣ Macro Wave (5) — projected to rally toward 4.618 extension (~$2,500) , completing Super Cycle Wave (3) near 2029 🏁 From there, a larger Super Cycle Wave (4) correction could unfold before the final parabolic Super Cycle Wave (5) run to the 5.618 Fibonacci extension (~$26,000) — the climax of NVDA’s decades-long AI expansion super-trend 🌕 💰 Smart Money Concept (SMC) Perspective The chart structure clearly shows Smart Money accumulation patterns in every correction phase: Re-accumulation ranges appeared at every 0.618 retracement level 📊 Liquidity grabs below previous swing lows before strong impulsive moves ⚡ Fair Value Gaps (FVGs) filled during corrections, creating perfect liquidity imbalances that institutional players exploit Currently, NVDA trades near a premium zone of Macro Wave (3), but Smart Money will likely reaccumulate during the upcoming Macro Wave (4) discount phase (2026–2027). Expect Order Block re-tests and liquidity sweeps around discounted Fibonacci retracement zones (0.236–0.382) before the next major rally 📉➡️📈 📈 Price Action Structure NVDA’s macro structure remains strongly bullish: The multi-decade trend has respected every higher high and higher low sequence since 2008. Each impulse is followed by a healthy re-accumulation range, never breaking long-term structure. Expect distribution near the $250–$300 (split-adjusted) region as Wave (3) matures, followed by a macro correction that offers generational entries for long-term investors 🧠 🔢 Fibonacci Confluence & Technical Harmony Fibonacci has been the invisible hand guiding NVDA’s growth 👇 0.786 retracement (2002) → deep liquidity reset 0.618 retracement (2008) → institutional re-entry 3.618 extension (256) → current macro resistance target 4.618 extension (2500) → Super Cycle Wave (3) final target 5.618 extension (26K) → ultimate Super Cycle Wave (5) projection Each impulse and retracement aligns perfectly with Fibonacci’s geometric rhythm , proving the power of confluence between time, price, and sentiment. 🧠 Fundamentals — The Energy Behind the Waves Behind the technicals lies unmatched fundamental growth : 💾 AI & Data Centers: NVIDIA is the core infrastructure for modern AI compute and cloud training workloads. 🧩 CUDA Ecosystem: A software moat that ties developers and enterprises directly to NVIDIA’s architecture. 🌐 Omniverse & Robotics: Positioning NVDA as a leader in 3D simulation, robotics, and digital twins — future trillion-dollar markets. ⚙️ Strategic Partnerships: Expanding across hyperscalers, automotives, and enterprise AI. Each innovation wave fuels a new Elliott Wave impulse , with the AI revolution now driving the strongest macro leg in NVDA’s history. ⚡ Macro Outlook & Timeline ✅ Now (2025): Completing Macro Wave (3) of Super Cycle (3) → heading toward $256 target ⚠️ 2026–2027: Macro Wave (4) correction to 0.236–0.382 (Smart Money entry) 🚀 2028–2029: Macro Wave (5) push → Super Cycle (3) peak near $2,500 🌊 2030–2032: Super Cycle (4) correction — consolidation phase 💎 2035–2040+: Super Cycle (5) → ultimate 5.618 target near $26K 💬 Final Thoughts "Every correction is a setup for the next expansion. Smart Money buys fear — not euphoria." NVIDIA is the heartbeat of the AI revolution , the core of data-driven computing , and a living Fibonacci sequence in motion. As long as fundamentals stay aligned with the wave rhythm, NVDA’s Supercycle will continue to redefine what’s possible in long-term growth. 🌌 #NVDA #ElliottWaveAnalysis #SmartMoneyConcept #PriceActionTrading #FibonacciMagic #AIRevolution #StockMarket #Investing #TradingViewCommunity #TechSupercycle #NVDAtoTheMoon #LongTermInvesting 💬 Traders, analysts, and wave watchers — your insights matter! Have you spotted NVDA’s next move? Drop your Elliott Wave counts, confirmations, or constructive critiques below 👇 Let’s discuss NVIDIA’s structural evolution, AI-driven Supercycle, and long-term growth potential together 🚀💚 Every comment adds perspective — let’s decode this massive wave as a community! 🌊📈 — Team FIBCOS ⚡💎NVDA may present a compelling buying opportunity, as our outlook suggests the upside target of 256 has not yet been fully realized. However, ensure that risk is managed effectively at all times.
fibcos
تحلیل نهایی موج بزرگ طلا: آینده قیمت XAU/USD تا سال ۲۰۵۰ و فراتر از آن
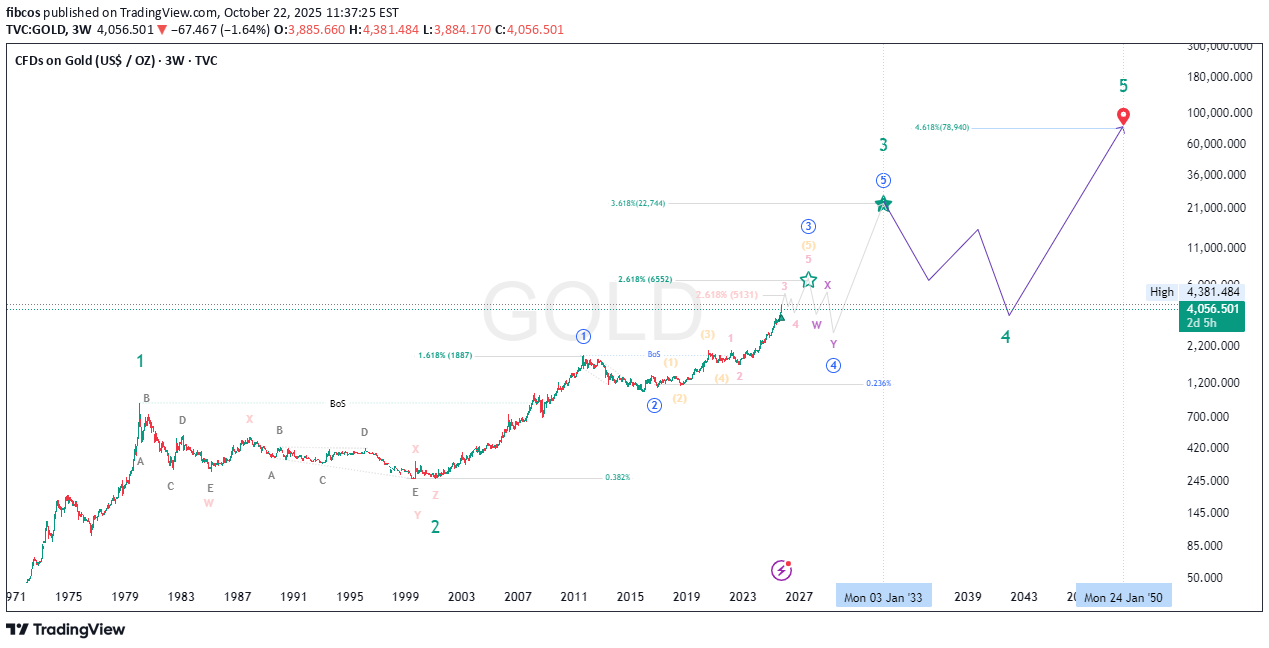
🟡 GOLD (XAU/USD) – FINAL GRAND CYCLE ANALYSIS “The Rise of Real Money in a Failing Fiat World” Elliott Waves | Fibonacci | Smart Money | Macro Fundamentals | Market Psychology 📅 Date: October 22, 2025 📍 Current Price: ~$4,039/oz ⏳ Time Horizon: 1970s to post-2050 🎯 Focus: Multi-decade Elliott Wave structure signaling the endgame for fiat currencies 🌐 SUPER CYCLE NARRATIVE – GOLD’S MONETARY METAMORPHOSIS 🔵 Wave I (1971–1980): The Rebirth of Real Money Gold's first major secular rally began when the Bretton Woods system collapsed and President Nixon ended the U.S. dollar’s convertibility to gold in 1971. Gold soared from around $35 to nearly $875 by 1980. This wave was driven by runaway inflation, the oil embargo, and shattered confidence in fiat money. 🔴 Wave II (1980–1999): The Great Fiat Illusion Following the 1980 peak, gold entered a brutal 19-year corrective phase, falling to the $250 zone. During this time, the U.S. dollar gained strength, Volcker’s interest rate hikes reined in inflation, and a new era of debt-based prosperity and stock market euphoria unfolded. Gold was dismissed, even by central banks who sold reserves. Structurally, this corrective phase formed a complex WXYXZ pattern , setting the groundwork for the massive Wave III rally. 🟢 Wave III (1999–~2033): The Fiat Reckoning Has Begun This is the longest and most powerful supercycle wave and the one we are currently in. It is subdivided into five impulsive macro waves. As of now, gold is deep within Wave iii of III , the most explosive phase of the entire structure. The current rally is no longer driven by inflation fears but by existential doubts about the long-term viability of fiat currencies. 📈 Wave I of III (1999–2011): The Institutional Accumulation Gold rose from around $250 to $1,920 over this period. Triggers included the dot-com bust, 9/11, the 2008 global financial crisis, and the launch of the first gold ETFs like GLD. This wave marked the beginning of institutional interest in gold as a systemic hedge. 📉 Wave II of III (2011–2015): The Disbelief Correction Gold corrected nearly 45%, bottoming near $1,050. The narrative shifted — QE hadn't caused hyperinflation, the stock market was booming again, and faith in the dollar resurged. Retail abandoned gold, but institutional buyers quietly accumulated from newly created demand zones. 🚀 Wave iii of III (2015–~2026): The True Price Discovery Phase This is where we are now. Since 2015, gold has exploded upward, driven by COVID-era QE, negative real interest rates, geopolitical instability, and major central banks accumulating gold for cross-border settlements outside the dollar system. We are currently in the middle of this wave — micro wave (3) of iii — with price around $4,039. According to Fibonacci projections, this wave is expected to peak near $6,552 , corresponding to the 2.618 extension level . If bullish momentum continues, gold could overshoot toward $22,744 , matching the 3.618 Fibonacci extension and marking the likely top of macro Wave III. In an extreme scenario where fiat trust collapses entirely, the 4.618 extension projects a possible target of $78,940 . All of these levels align with the upper bounds of the long-term logarithmic channel, validating both structure and projections. But most likely this target is for Wave V TOP . 🟣 Wave IV (Projected: 2026–2033): The Great Shakeout After the parabolic run of Wave iii, a deep multi-year correction is likely. This correction — Wave IV — may retrace toward the long-term red trendline and could coincide with a temporary return to “faith” in fiat through reforms like CBDC rollouts or aggressive fiscal pivots. This wave could resemble a WXY pattern or large ABC structure and may unfold alongside capital controls, deflationary pressure, and a resurgent tech or dollar narrative. However, this will likely be the last major buying opportunity before gold enters its final, euphoric revaluation. 🟢 Wave V (2033–2045+): The Final Blow-Off Top Wave V is expected to be driven by an overt crisis of confidence in the global fiat system. Scenarios could include: Mass adoption of gold-backed or commodity-tied digital currencies Loss of global trust in the USD as the reserve currency BRICS or emerging alliances introducing gold into cross-border settlements Global central banks returning to physical gold as a monetary base The upside potential here is monumental. The 4.618 Fibonacci extension already targets $78,940 , but under full systemic collapse or monetary reset conditions, gold could reprice toward $100,000–$250,000 per ounce — not as a bubble, but as a return to its role as sound, base-layer money. 📐 Fibonacci Milestones and Structure Alignment Each major wave has closely respected its corresponding Fibonacci extension. Wave I topped around the 1.618 level ($1,887) . The ongoing Wave iii appears on track to reach the 2.618 level ($6,552) . From there, macro Wave III could stretch toward 3.618 ($22,744) . If Wave V extends fully, a 4.618 projection leads to $78,940 — all within the bounds of the established logarithmic trend channel. In a full-blown systemic reset, price could break even higher. These levels are not speculative but grounded in structural alignment with Elliott wave geometry , Fibonacci mathematic s, and long-term institutional order flow . 🧠 Smart Money Concepts & Technical Validations Smart money activity has left clear fingerprints across this cycle. Each break of market structure (in 2016, 2020, and 2023) confirmed higher time-frame bullish continuation. Institutional demand zones — especially during the 2018–2019 consolidation and 2022 pullback — were respected to the dollar. This cycle isn’t retail-driven mania — it's a stealth institutional accumulation that’s now evolving into price discovery. 📊 Market Psychology Across the Cycle Investor sentiment has followed classic psychology stages: From 1999 to 2004, disbelief reigned: “Gold is dead.” Between 2005 and 2011 came growing awareness: “Gold might work again.” The 2011–2015 correction brought denial: “It was just a bubble.” Hope returned in 2016–2020 as price quietly rallied. From 2022 to 2026, euphoria dominates: “Gold will never go down.” Wave IV will likely bring fear and capitulation between 2026 and 2033. Finally, Wave V will ignite mania: “Gold to the moon!” 🚨 Final Synthesis: What This All Means We are living through the largest repricing of monetary value in modern financial history. Gold is no longer just an inflation hedge — it’s becoming a hedge against the system itself . The structure on the chart doesn't just map price — it maps the collapse of fiat trust and the return of monetary sanity. Gold is transitioning from: A commodity hedge → To a central bank hedge → To a currency hedge → And finally, to a system hedge The current leg — Wave iii of III — is nearing its climax. After a correction in Wave IV, Wave V could take gold into previously unthinkable territory, not because gold changed — but because everything else did. 📌 Final Position Summary We are currently in wave (5) of iii of III — the most powerful segment of the bull run The next Fibonacci target is $6,552 The broader Wave III could peak near $22,744 After a correction (Wave IV), the final wave could send gold toward $78,940 , or even into the $100,000–$250,000 zone under extreme monetary reset conditions This is not a mere forecast — it’s a macro-monetary blueprint for the coming decades. 🌊 "Those who understand the waves will ride them. Those who don’t will be swallowed by the tide." – FIBCOS 📘 Disclaimer: This is an educational market outlook based on technical and macroeconomic structure. It is not financial advice. Always do your own due diligence and risk management. #XAUUSD #Gold #GoldAnalysis #ElliottWave #Fibonacci #SmartMoneyConcepts #PriceAction #TechnicalAnalysis #MarketStructure #Commodities #InflationHedge #MacroEconomics #CentralBanks #BRICS #MonetaryReset
fibcos
پایان نزول تاریخی KDA؟ نشانههای تشکیل کف نسلی و بازگشت بزرگ!
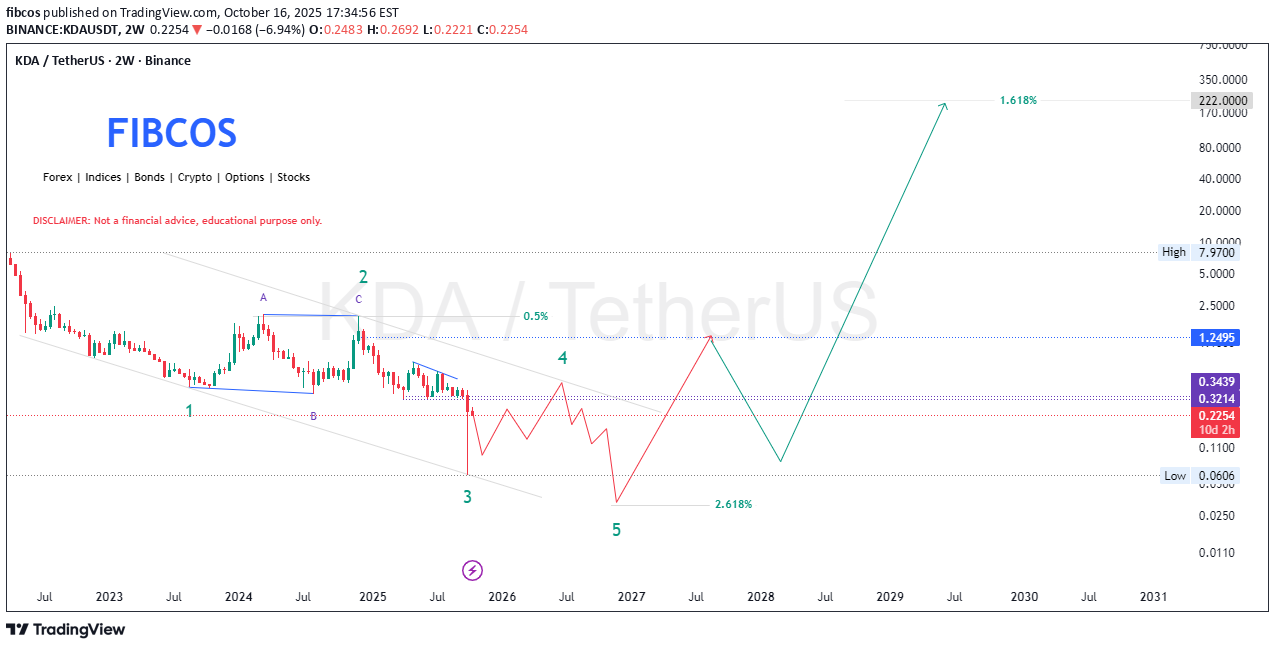
🚨 KDA/USDT - Approaching the End of Macro Wave 3 – Reversal Imminent? After nearly 2 years of consistent decline, Kadena (KDA) appears to be in the final stages of its macro corrective structure. Using a blend of Elliott Wave Theory , Smart Money Concepts (SMC) , Fibonacci tools , and Price Action analysis , there is compelling evidence that we may be forming a generational bottom . The chart outlines a clean 5-wave Elliott impulse to the downside. With Wave 3 nearing completion in a historically strong demand zone ($0.06–$0.03), the probability of a long-term trend reversal is increasing. This zone also aligns with: A full 2.618 Fibonacci extension, Prior accumulation levels, A potential liquidity sweep below Wave 3, Oversold market conditions likely visible on higher timeframes (RSI/MACD divergence). On the fundamentals side, Kadena continues to innovate with its high-throughput PoW Chainweb architecture , human-readable smart contracts via Pact , and growing DeFi infrastructure. It remains one of the most undervalued layer-1s in the market with zero major security exploits since launch. 🔮 If the reversal confirms , long-term targets lie at: $1.25 (0.5 Fib Retracement) $7.97 (prior high) $222 (1.618 macro extension, multi-year projection) This setup may not play out overnight, but it's the type of structure that smart money patiently builds positions into , while retail fears the bottom. 📊 1. Elliott Wave Theory Confluence Looking at the macro Elliott Wave structure: 🔹 A clear 5-wave impulsive decline appears to be forming: Wave 1 & 2 have already played out. Wave 3, being the most aggressive, is complete or near completion. Wave 4 retracement was shallow and corrective (possibly a bear flag/pennant). Wave 5 is projected to complete with a final leg lower— potential bottom expected before a strong reversal. 🔹 Post wave 5, an ABC corrective wave or a larger impulsive reversal is projected (labeled on chart), suggesting a macro trend shift . 🧠 2. Smart Money Concepts (SMC) 💰 Accumulation Zones: Price is hovering in a demand zone (between $0.06 - $0.25). This area has high probability of institutional accumulation as retail sells into fear. 📉 Liquidity Sweeps: Recent price action shows a sharp move down, likely a liquidity grab below previous swing lows (a classic SMC manipulation before reversal). The anticipated "spring" move from this zone aligns with Wyckoff accumulation patterns. 🔄 Break of Structure (BoS): A break above the corrective structure post-wave 5 would confirm a bullish market structure shift . 🌀 3. Fibonacci Retracement & Extension 🔹 Fibonacci Extension: Wave 3 extension seems to have reached the 2.618% level , which is a textbook Elliott wave projection level. This provides high confluence that Wave 5 bottom may be close. 🔹 Fibonacci Retracement Targets: Retracement to 0.5 - 0.618 Fibonacci zone (~$1.25 - $7.97) expected in post-wave rally. The ultimate 1.618 extension target (~$222) could play out if a macro bull cycle aligns , possibly by 2029. 🕵️♂️ 4. Price Action Analysis 📉 Bearish Channel Breakdown : Price has followed a descending channel and is nearing the lower boundary. False breakdowns often result in violent reversals . 📈 Bullish Divergence (likely on RSI) : If RSI or other momentum indicators show divergence, this adds confirmation for a reversal setup . 📌 Key Levels to Watch : Resistance : $0.3439, $1.25, $7.97 Support : $0.13, $0.06, $0.03 A break and hold above $1.25 could signal the start of a macro uptrend . 🔮 Final Thoughts 🔁 We're likely nearing the end of a macro bearish cycle (Wave 3) . 💼 With institutional accumulation signs , Fibonacci confluence , and solid fundamentals **, KDA presents a strong asymmetric opportunity . 🧨 If Wave 5 completes near $0.06 - $0.03, the upside potential toward $7.97 (first macro target) and possibly $222 (1.618 extension) offers high R/R (risk/reward) for long-term investors. ⚠️ DISCLAIMER: This analysis is educational and not financial advice. Always DYOR (Do Your Own Research). #KDA #KDAUSDT #Kadena #CryptoAnalysis #ElliottWave #SmartMoney #Wyckoff #TechnicalAnalysis #CryptoReversal #AltcoinAnalysis #PriceAction #Fibonacci #Layer1 #CryptoFundamentals #TradingSetup #LongTermHold #Accumulation #CryptoMacro #TradingEducation #WaveTheory #CryptocurrencyKDA/USDT Market Update KDA/USDT has experienced a significant 70% retracement, in line with our previous technical forecast. This move appears to have efficiently swept major liquidity below key support levels, signaling a potential completion of Wave 3 within the broader Elliott Wave structure. The current price action suggests a transition phase, where selling pressure is beginning to exhaust. We're now observing early signs of accumulation and potential bullish divergence on lower timeframes, which could mark the beginning of Wave 4 or even the early stages of a new impulsive cycle. From a strategic standpoint, this zone offers a high-reward buying opportunity for medium- to long-term positions, provided confirmation is met through volume support, structural shifts, and key breakout levels. We remain vigilant and will continue to monitor the development of the next moves closely, adjusting our strategy accordingly.
fibcos
قیمت طلا کجاست؟ حمایت ۴۱۰۰ دلار حفظ شد، اهداف بعدی کجاست؟
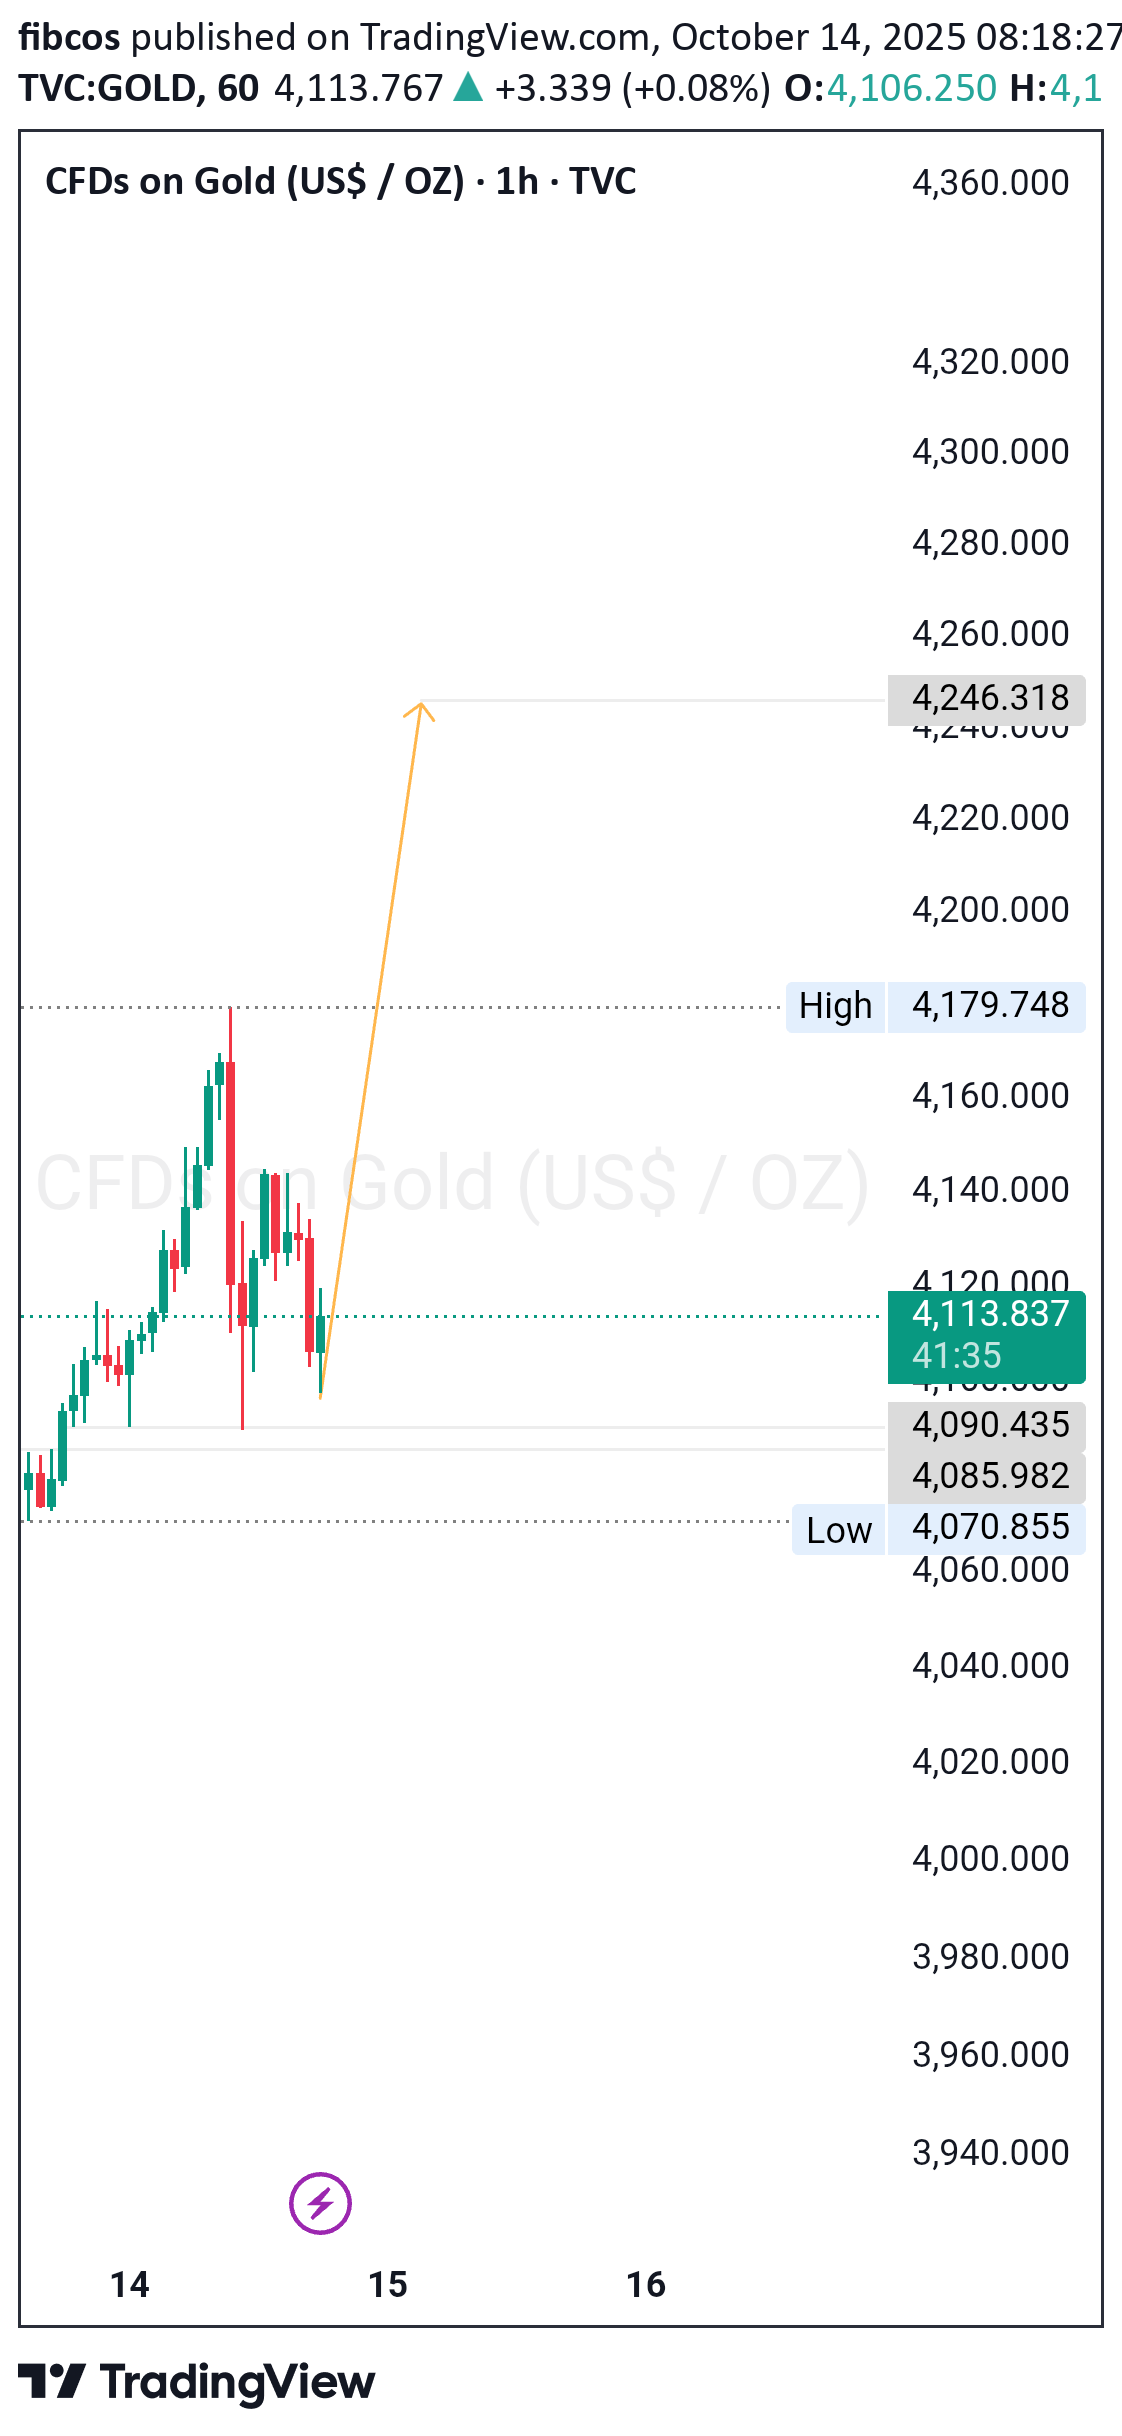
Gold held strong at $4,100 support and is consolidating below $4,150–$4,180 resistance. A breakout targets $4,200+. Uptrend stays valid above $4,100; below it, momentum weakens.✅ Gold Hits Projected Upside Target Gold has reached our anticipated upside target, confirming the bullish structure and confluence setup outlined in previous analysis. The move was supported by strong momentum and aligns with key Fibonacci and resistance levels. We'll now monitor for potential continuation, consolidation, or a reversal as price approaches this critical zone.
fibcos
پیشبینی نهایی طلا: خیزش پول واقعی تا ۲۵۰,۰۰۰ دلار با رمزگشایی امواج بزرگ!

🟡 GOLD (XAU/USD) – FINAL GRAND CYCLE ANALYSIS "The Rise of Real Money in a Failing Fiat World" Elliott Waves | Fibonacci | Smart Money | Macro Fundamentals | Market Structure 📆 Date: October 12, 2025 📈 Current Price: ~$4,017/oz 🕰️ Timeframe: 1950s – 2060+ 🔍 Focus: Multi-decade forecast grounded in wave theory and fundamental macro shifts 🌐 SUPER CYCLE STRUCTURE – GOLD'S MONETARY EVOLUTION 🔵 Wave I (1971–1980): The Rebirth of Gold Gold surged from ~$35 to ~$850 after the collapse of the Bretton Woods system. Nixon ended USD-to-gold convertibility, exposing the world to pure fiat for the first time. Geopolitical shocks like the OPEC oil embargo and soaring inflation shattered trust in paper money. Gold reasserted itself as a monetary anchor , not just a commodity. 🔴 Wave II (1980–1999): The Great Rejection A 19-year bear market saw gold bleed down to ~$250. Volcker’s rate hikes tamed inflation; fiat regained trust temporarily. The dollar surged, stocks soared, and central banks sold gold reserves. This corrective wave reflected confidence in debt-based growth and fiat stability — a long, deceptive calm. 🟢 Wave III (1999–~2045?): The Real Money Renaissance This is the main secular bull market wave , subdivided into five impulsive macro waves. Gold is now in Wave iii of III — the most explosive, powerful phase — and will likely reprice in a way that reflects systemic risk, not just inflation. 📈 MACRO & MICRO STRUCTURE – CURRENT WAVE BREAKDOWN 🟢 Macro Wave I (1999–2011): The First Awakening Gold rose from $250 to ~$1,920. Triggered by the dot-com crash, 9/11, 2008 crisis, and early QE programs. This was the smart money accumulation phase , when institutions quietly began hedging systemic risk. 🔴 Macro Wave II (2011–2015): The Disbelief Phase Gold corrected 45% to ~$1,050. Fed tapering, rising dollar, and low CPI caused a temporary return to confidence in fiat. This reset investor sentiment and created institutional demand zones. 🟢 Macro Wave III (2015–~2026): The Fiat Reckoning (Now Unfolding) Subdivided into five micro-waves: Wave i (2015–2020): Broke out of 4-year base; fueled by Brexit, rate cuts, and China accumulation. Wave ii (2020–2022): ABC pullback post-COVID; reloaded from key SMC demand zones. Wave iii (2022–Now): We're here. Most vertical and extended move yet. Price currently at ~$4,000; next targets are $6,552, $22,744, and $78,940 , all aligning with Fibonacci extensions (2.618, 3.618, 4.618). Wave iv (projected 2026–2031): Likely major correction after parabolic move. Wave v (projected 2031–2045): Final blow-off top in Supercycle III. 🧠 FUNDAMENTAL DRIVERS – BY WAVE 🔹 Wave I Fundamentals (1999–2011): Post-dot-com capital rotation. 9/11 and geopolitical tension. 2008 GFC and collapse of banking trust. Introduction of QE and zero interest rates. Gold ETFs (like GLD) launched, enabling broader exposure. 🔸 Wave II Fundamentals (2011–2015): QE fatigue: “It didn’t cause inflation.” USD strength. Confidence returned to stocks. Retail dumped gold — but central banks quietly accumulated . 🔹 Wave III Fundamentals (2015–2026): $30+ trillion in global QE during COVID. Global real rates deeply negative. Energy crisis and supply chain fragility. War-driven risk premiums (Russia-Ukraine, Middle East, China-Taiwan). De-dollarization: BRICS accumulation, gold in cross-border settlements. Institutional shift toward real assets as fiat credibility wanes. 🔸 Wave IV (Projected 2026–2031): A likely correction tied to: CBDC adoption and capital controls. Temporary resurgence in tech or USD-based confidence. Reforms that appear to restore fiscal sanity. But this will be the last opportunity to enter before the endgame move. 🔹 Wave V (2031–2045+): Fiat collapse becomes mainstream. USD potentially dethroned. Gold-backed CBDCs or DeFi hybrids launched. Mass exodus from fiat into real money. Final revaluation of gold to reflect not inflation, but lost confidence in the entire financial system. 📐 FIBONACCI EXTENSIONS – PRICE TARGETS WITH WAVE ALIGNMENT 🟢 Wave I topped at 1.618 Fib ($1,887) — aligned with 2011 ATH. 🟢 Wave III (in progress): 2.618 Fib: $6,552 (expected peak of wave iii). 3.618 Fib: $22,744 (potential macro Wave III top). 4.618 Fib: $78,940 (if confidence fully collapses). 🟢 Wave V (projected): May extend toward $100,000–$250,000+ under systemic collapse or gold-backed reset conditions. All targets line up perfectly with logarithmic channel projections , Elliott wave extensions , and long-term order flow structure . 🧠 SMART MONEY CONCEPTS & PRICE ACTION CONFIRMATION ✅ BoS (Breaks of Structure) at each wave change validated bullish continuation (2016, 2020, 2023). ✅ Order Blocks and liquidity grabs created institutional entry zones — especially at 2018–2019 lows and 2022 dips. ✅ Demand zones respected across key Fibonacci retracements (0.382 and 0.618). ✅ Current wave iii is a textbook price discovery phase with minimal resistance. This entire market structure is institutionally driven , not retail fueled — a true stealth bull. 📊 MARKET CYCLE PSYCHOLOGY OVERLAY 1999–2004: Disbelief – “Gold is dead.” 2005–2011: Awareness – “Gold might work.” 2011–2015: Denial – “It’s just a bubble.” 2016–2020: Hope – “Maybe gold’s not done.” 2022–2026: Euphoria – “Gold will never go down.” 2026–2033: Fear → Capitulation – Wave IV 2033–2045: Mania – “Gold to the moon!” — Wave V blow-off. 🚨 FINAL SYNTHESIS We are witnessing the greatest revaluation of monetary value in modern history . Gold is transitioning from: A hedge against inflation → to A hedge against central banks → to A hedge against the entire fiat system. 📌 Final Position Summary: 🔄 Current Location: Wave iii of III of Supercycle III 🎯 Immediate Target: $6,552 (2.618 Fib) 💡 Medium-Term: $22,744 (3.618 Fib) 🔥 Parabolic Scenario: $78,940 (4.618 Fib) 💀 Systemic Reset Target: $100,000–$250,000+ 🧠 Conclusion: This is not just a chart. This is a map of the collapse of fiat trust and the ascendance of sound money . Gold is no longer just an asset — it’s insurance on the system. 🌊 "Those who understand the waves will ride them. Those who don’t will be swallowed by the tide." - FIBCOS 📘 Disclaimer: This is a structural, educational market outlook. Not financial advice. Please do your own due diligence and risk management. #XAUUSD #Gold #GoldAnalysis #ElliottWave #Fibonacci #SmartMoneyConcepts #PriceAction #TechnicalAnalysis #MarketStructure #Commodities #InflationHedge #MacroEconomics #CentralBanks #BRICS #MonetaryReset🟡 Gold Following Bullish Structure — Short-Term Target in Sight Gold continues to follow the bullish path outlined in our analysis, with price action progressing steadily toward the short-term target, though it hasn’t been reached yet. The structure remains intact, supported by favorable momentum and technical alignment. As long as key support levels hold, we expect continuation toward the initial objective. 🔭 The primary long-term target remains significantly higher, reflecting the broader bullish thesis driven by both technical and macroeconomic factors.
fibcos
KDA آماده انفجار: تحلیل کامل موج الیوت، اسمارت مانی و پتانسیل 10 برابری!

🔍 1. Elliott Wave Theory – Wave Confluence From the chart: We can clearly observe a complex corrective pattern forming a WXYXZ or triple three structure. The wave labels (A, B, C in red/blue) suggest that the market may have completed a macro correction. The current price action is showing a potential start of an impulsive wave, marking the beginning of Wave 1 of a new bullish cycle 📈. 🧩 Key Confluences: Final leg (C wave) seems to have ended with a falling wedge pattern, a classic reversal signal. Bullish divergence likely present on momentum indicators (not shown but inferred), supporting wave completion. 💹 2. Price Action Analysis Price action is forming a base structure around $0.32 - $0.34 with: Multiple retests of the demand zone (highlighted around $0.3214 and $0.3439). A strong bullish engulfing candle near the low, suggesting institutional accumulation. Current price ($0.3704) has already broken out of a descending wedge pattern (D wave to E), which often precedes explosive moves. 📌 Short-Term Structure: Breakout above minor resistance at $0.41 would confirm a bullish reversal pattern. Targets based on historical PA zones are set at $1.14, $1.24, $2.48, and $3.51 📍. 📐 3. Fibonacci Retracement & Extension Let’s bring in some Fibonacci magic ✨: If we take the high of Wave (B) and the low of Wave (C), potential retracement levels align with: 0.618 Fib at ~$1.14 ✅ 1.0 Fib at ~$2.48 ✅ 1.618 Fib at ~$3.51✅ These Fibonacci levels align beautifully with price structure resistance zones, showing confluence between fibs and market structure. 📊 Fibonacci Extension Target: A minimum 5x-10x move is projected from current price, which takes us close to $3.50+, aligning with the major 1.618 extension. 🧠 4. Smart Money Concept (SMC) Let’s talk about what the "big money" might be doing 🧠💰: ✅ Accumulation Phase Identified: Price is ranging after a prolonged markdown. Liquidity sweeps below previous lows suggest smart money engineered a bear trap to fill orders. Break of structure (BoS) pending above $0.41, which would confirm smart money shift from accumulation to mark-up phase. 🎯 Ideal Smart Money Entry: Sub-$0.40 range. 📈 Next Liquidity Target: $1.24 (equal highs formed during mid-2024). 🌐 5. Fundamentals of Kadena (KDA) Kadena is a layer-1 blockchain featuring a hybrid PoW (proof-of-work) model with scalability via Chainweb. 📌 Bullish Fundamentals: Scalability: Can process 480k+ TPS across multiple chains. Security: PoW-based, making it more secure than many PoS chains. Smart Contracts: Uses Pact, a readable and secure smart contract language. Ecosystem Expansion: Increasing DeFi, NFT, and DAO involvement. Recent Funding: If there's been recent VC or foundation investment (check latest news), it would support a bull case. 🚀 Catalysts to Watch: New partnerships or major DApps launching. Exchange listings or ecosystem grants. Rising sentiment in broader altcoin market. 📈 Final Thoughts & Outlook 🔥 Technical + SMC + Fundamentals are aligning for a potential major move. 🧭 Strategic Outlook: 🎯 Buy Zone: $0.32 - $0.38 (Accumulation Range) 🚨 Breakout Confirmation: Above $0.41 🚀 Targets: $1.14 ✅ (0.618 Fib + structure) $2.48 ✅ (1.0 Fib + structure) $3.51 ✅ (1.618 Fib + macro resistance) "The bigger the base, the higher the space" — and Kadena seems to be building a strong one 👷♂️🧱 ⚠️ DISCLAIMER: This is for educational purposes only. Not financial advice. Always do your own research (DYOR) and manage risk appropriately. Crypto is volatile 🔥. #KDA #KDAUSDT #Kadena #Altcoins #CryptoAnalysis #ElliottWave #WaveTheory #PriceAction #SmartMoneyConcepts #SMC #Fibonacci #TechnicalAnalysis #CryptoTrading #CryptoCharts #BullishSetup #AccumulationPhase #BreakoutTrade #10xPotential #CryptoFundamentals #LongTermInvesting #SwingTrading #TradingViewCommunityWe will review, analyze and update very soon.
Disclaimer
Any content and materials included in Sahmeto's website and official communication channels are a compilation of personal opinions and analyses and are not binding. They do not constitute any recommendation for buying, selling, entering or exiting the stock market and cryptocurrency market. Also, all news and analyses included in the website and channels are merely republished information from official and unofficial domestic and foreign sources, and it is obvious that users of the said content are responsible for following up and ensuring the authenticity and accuracy of the materials. Therefore, while disclaiming responsibility, it is declared that the responsibility for any decision-making, action, and potential profit and loss in the capital market and cryptocurrency market lies with the trader.