Technical analysis by fibcos about Symbol KDA on 10/16/2025

fibcos
پایان نزول تاریخی KDA؟ نشانههای تشکیل کف نسلی و بازگشت بزرگ!
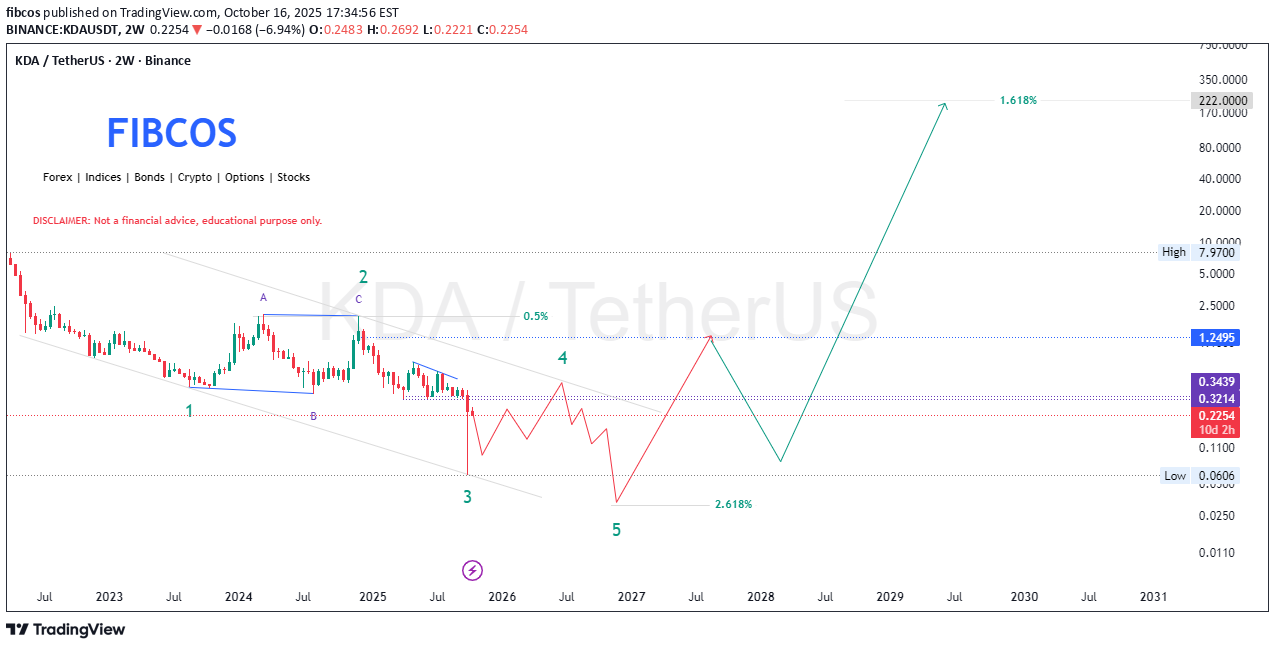
🚨 KDA/USDT - Approaching the End of Macro Wave 3 – Reversal Imminent? After nearly 2 years of consistent decline, Kadena (KDA) appears to be in the final stages of its macro corrective structure. Using a blend of Elliott Wave Theory , Smart Money Concepts (SMC) , Fibonacci tools , and Price Action analysis , there is compelling evidence that we may be forming a generational bottom . The chart outlines a clean 5-wave Elliott impulse to the downside. With Wave 3 nearing completion in a historically strong demand zone ($0.06–$0.03), the probability of a long-term trend reversal is increasing. This zone also aligns with: A full 2.618 Fibonacci extension, Prior accumulation levels, A potential liquidity sweep below Wave 3, Oversold market conditions likely visible on higher timeframes (RSI/MACD divergence). On the fundamentals side, Kadena continues to innovate with its high-throughput PoW Chainweb architecture , human-readable smart contracts via Pact , and growing DeFi infrastructure. It remains one of the most undervalued layer-1s in the market with zero major security exploits since launch. 🔮 If the reversal confirms , long-term targets lie at: $1.25 (0.5 Fib Retracement) $7.97 (prior high) $222 (1.618 macro extension, multi-year projection) This setup may not play out overnight, but it's the type of structure that smart money patiently builds positions into , while retail fears the bottom. 📊 1. Elliott Wave Theory Confluence Looking at the macro Elliott Wave structure: 🔹 A clear 5-wave impulsive decline appears to be forming: Wave 1 & 2 have already played out. Wave 3, being the most aggressive, is complete or near completion. Wave 4 retracement was shallow and corrective (possibly a bear flag/pennant). Wave 5 is projected to complete with a final leg lower— potential bottom expected before a strong reversal. 🔹 Post wave 5, an ABC corrective wave or a larger impulsive reversal is projected (labeled on chart), suggesting a macro trend shift . 🧠 2. Smart Money Concepts (SMC) 💰 Accumulation Zones: Price is hovering in a demand zone (between $0.06 - $0.25). This area has high probability of institutional accumulation as retail sells into fear. 📉 Liquidity Sweeps: Recent price action shows a sharp move down, likely a liquidity grab below previous swing lows (a classic SMC manipulation before reversal). The anticipated "spring" move from this zone aligns with Wyckoff accumulation patterns. 🔄 Break of Structure (BoS): A break above the corrective structure post-wave 5 would confirm a bullish market structure shift . 🌀 3. Fibonacci Retracement & Extension 🔹 Fibonacci Extension: Wave 3 extension seems to have reached the 2.618% level , which is a textbook Elliott wave projection level. This provides high confluence that Wave 5 bottom may be close. 🔹 Fibonacci Retracement Targets: Retracement to 0.5 - 0.618 Fibonacci zone (~$1.25 - $7.97) expected in post-wave rally. The ultimate 1.618 extension target (~$222) could play out if a macro bull cycle aligns , possibly by 2029. 🕵️♂️ 4. Price Action Analysis 📉 Bearish Channel Breakdown : Price has followed a descending channel and is nearing the lower boundary. False breakdowns often result in violent reversals . 📈 Bullish Divergence (likely on RSI) : If RSI or other momentum indicators show divergence, this adds confirmation for a reversal setup . 📌 Key Levels to Watch : Resistance : $0.3439, $1.25, $7.97 Support : $0.13, $0.06, $0.03 A break and hold above $1.25 could signal the start of a macro uptrend . 🔮 Final Thoughts 🔁 We're likely nearing the end of a macro bearish cycle (Wave 3) . 💼 With institutional accumulation signs , Fibonacci confluence , and solid fundamentals **, KDA presents a strong asymmetric opportunity . 🧨 If Wave 5 completes near $0.06 - $0.03, the upside potential toward $7.97 (first macro target) and possibly $222 (1.618 extension) offers high R/R (risk/reward) for long-term investors. ⚠️ DISCLAIMER: This analysis is educational and not financial advice. Always DYOR (Do Your Own Research). #KDA #KDAUSDT #Kadena #CryptoAnalysis #ElliottWave #SmartMoney #Wyckoff #TechnicalAnalysis #CryptoReversal #AltcoinAnalysis #PriceAction #Fibonacci #Layer1 #CryptoFundamentals #TradingSetup #LongTermHold #Accumulation #CryptoMacro #TradingEducation #WaveTheory #CryptocurrencyKDA/USDT Market Update KDA/USDT has experienced a significant 70% retracement, in line with our previous technical forecast. This move appears to have efficiently swept major liquidity below key support levels, signaling a potential completion of Wave 3 within the broader Elliott Wave structure. The current price action suggests a transition phase, where selling pressure is beginning to exhaust. We're now observing early signs of accumulation and potential bullish divergence on lower timeframes, which could mark the beginning of Wave 4 or even the early stages of a new impulsive cycle. From a strategic standpoint, this zone offers a high-reward buying opportunity for medium- to long-term positions, provided confirmation is met through volume support, structural shifts, and key breakout levels. We remain vigilant and will continue to monitor the development of the next moves closely, adjusting our strategy accordingly.