
elfabiiani
@t_elfabiiani

What symbols does the trader recommend buying?
Purchase History
پیام های تریدر
Filter
elfabiiani
KASPA / USDT DAILY CHART KUCOIN - TA + TRADE PLAN

Technical Analysis (Daily Timeframe) by Blaž Fabjan Chart Pattern The price is consolidating within a Symmetrical Triangle pattern. This is a neutral continuation pattern – it signals that a major breakout (either upward or downward) is approaching as the apex is nearing. Both higher lows and lower highs confirm the formation. Key Support & Resistance Levels Immediate support zone: $0.080 – $0.082 Strong support below: $0.070 Immediate resistance: $0.095 – $0.100 Major resistances above: $0.120, $0.140, $0.160, $0.200, $0.220 Indicators Volume: Declining within the triangle – typical before a breakout. RSI (14): ~46 → Neutral, no overbought/oversold signals. Stochastic RSI: Oversold (~20), suggesting possible short-term upside bounce. MFI (Money Flow Index): Neutral (~51), showing balanced inflows/outflows. MACD/VM indicator: Bearish momentum has slowed, histogram flattening. Scenarios Option 1 (Bullish breakout): If KAS breaks above the $0.095–$0.100 zone with volume, next targets are $0.120 → $0.140 → $0.160 → $0.200+. Option 2 (Bearish breakdown): If KAS loses $0.080, potential retest of $0.070 → $0.060 support levels. Trading Plan for KAS/USDT 🔹 Short-Term Swing Trade (1–4 weeks) Entry Zone (Buy): Aggressive: $0.082 – $0.085 (current support area). Conservative: On confirmed breakout above $0.095 with volume. Stop Loss: Below $0.078 (tight stop) OR below $0.070 (safe stop). Take Profit Targets: $0.100 (first resistance, partial TP) $0.120 (main target) $0.140 (strong resistance) 🔹 Medium-Term Position Trade (1–3 months) Entry Strategy: Accumulate in the $0.080–$0.085 range. Stop Loss: Below $0.070 (close daily candle confirmation). Targets: Base case: $0.160 Optimistic case: $0.200 – $0.220 🔹 Risk Management Risk per trade: 1–2% of portfolio. Position sizing according to stop-loss distance. Avoid over-leveraging; triangle breakouts can produce false moves before direction confirms. Kaspa is entering the decision zone – the symmetrical triangle is compressing, and a major breakout is imminent in coming weeks. Momentum indicators show neutrality, giving equal probability for either breakout direction. The safest approach is to wait for breakout confirmation (daily close above $0.095 or below $0.080 with volume). If bullish, Kaspa could target +40–100% upside over the next quarter. If bearish, downside risk is -20–30%. Recommendation: For conservative traders → wait for breakout confirmation. For aggressive traders → accumulate around support ($0.082–$0.085) with tight stop-loss below $0.078 and scale out profits at resistance levels.
elfabiiani
Technical Analysis (KASPA/USDT - Daily Chart)

Technical Analysis (KASPA/USDT - Daily Chart)Trend & Structure OverviewKASPA has been in a prolonged downtrend after peaking near $0.22.The Elliott Wave structure indicates a completed (A)-(B)-(C) correction pattern after a prior bullish wave (4).Price is currently testing a triple bottom structure near $0.060–$0.065, highlighted by orange circles. This zone has previously acted as strong support.Key Support and Resistance LevelsTypePrice Zone (USDT)Strong Support$0.060 – $0.065Intermediate Resistance$0.080 – $0.085Major Resistance$0.100 – $0.105Upper Resistance Zones$0.120, $0.140, $0.160, $0.180, $0.200The price is currently bouncing from the lower bound of this key support zone.Indicators SummaryRSI (14):Current: ~32.2 → Approaching oversold territory, signaling potential reversal or bounce.Stochastic RSI:Current: ~19.3 and crossing up, suggesting a bullish reversal signal forming.Money Flow Index (MFI):Value: 23 → Indicates weak inflows, but any spike could confirm a bottom formation.VMC Cipher B:Multiple green dots and momentum waves bottoming → Suggests bullish divergence and possible accumulation.Volume:No clear breakout volume yet, but prior bounce zones had relatively stronger support volume.Trading Plan for KASPA/USDTEntry StrategyPrimary Long Entry Zone: $0.060 – $0.065 (Current support region)Entry Confirmation:RSI holding above 30Stochastic RSI bullish crossPrice maintaining above $0.065 on a daily closeTargets (Take Profit Levels)TP LevelPrice Target (USDT)RationaleTP1$0.080Nearest horizontal resistanceTP2$0.100Psychological level & prior S/RTP3$0.120Top of major clusterTP4$0.140 – $0.160Mid-term swing high zoneStop-Loss StrategyConservative SL: Below $0.058 (breakdown of key support)Aggressive SL: Below $0.0615 (to avoid wicks)Risk/Reward AssessmentRisk from entry ($0.065) to SL ($0.058): ~10.8%Potential reward to TP1 ($0.080): ~23%R/R Ratio to TP1: ~2.1R/R to TP3 ($0.120): ~8.5+Alternative ScenariosIf KASPA breaks below $0.058 with volume:Re-evaluate long positionsPossible next demand zone: $0.040 – $0.050If volume increases on the bounce and breaks $0.085:Add to position or open swing trade toward $0.100+SummaryCurrent Bias: Cautiously BullishSetup Type: Support Bounce / Reversal PlayKey is holding above the triple bottom, while indicators point toward a possible short-term trend reversal.Watch volume and momentum confirmation closely.
elfabiiani
KAS-USDT (Bybit spot), 4-hour candles TA+Trade plan

1. Market context & chart structureAsset / venue / timeframe: KAS-USDT (Bybit spot), 4-hour candles, data to 12 Jun 2025 06:45 UTC (see image).Primary pattern in play: Price has compressed into a contracting (symmetrical) triangle that began after the 28 May low. The apex is only ~1–2 candles away, so a decisive break is statistically imminent.Preceding structure:17-day descending channel → capitulation into a falling-wedge reversal (27–28 May).Two-legged double-bottom (“Bottom 2”) at 0.075–0.078 USDT.Sideways rectangle 29 May-7 Jun, now morphing into the present triangle.Key horizontal levels (4 h closes): 0.0930 (upper triangle rail / neckline) · 0.0891 (local supply) · 0.0797 (strong demand / wedge base) · 0.0620 (monthly support) Volume picture: Realised volume has been drying up since 31 May, a classic pre-breakout contraction. A spike on the break will confirm direction.2. Indicator read-outMarket Cipher B - Green momentum wave printing, money-flow bars just turned positiveMildly bullish, Early bull divergence vs 28 MayRSI(14) - 46 and curling up - Neutral-to-bullishHidden bullish divergence vs price higher-lowsStoch RSI26/24 and crossing up from oversoldBullishMomentum reset completeArTy Money-Flow Index+3.5 and risingBullishPositive inflow after five sessions of outflowCollectively the oscillators favour an upside resolution, provided volume confirms.3. Scenario probability matrixScenarioTrigger & confirmation Option 1 – Uptrend continuation4 h close ≥ 0.0925 USDT with volume ≥ 2× 20-period averageMeasured-move 0.107 → 0.118; extended fib 1.618 ≈ 0.125–0.128Est. probability: 60 %Option 2 – Downtrend resumption4 h close ≤ 0.079 USDT with similar volume spike 0.072 (range EQ) → 0.067–0.062 structural supportEst. probability: 40 %Weighting derives from: oscillator bias, shrinking supply above 0.092 (order-book heat-map), but tempered by external models calling for a short-term dip toward 0.067 USDT 4. Trading planComponentLong (Option 1) Short (Option 2)Entry Buy stop 0.0926 USDTSell stop 0.0789 USDTInitial stop-loss0.0838 USDT 0.0870 USDT (back inside triangle)Primary target-10.1050 (≈1R) 0.0725 (≈1R)Secondary target-20.1180 (≈2.5R) 0.0670 (≈2.5R)Position sizeRisk ≤ 1 % of account per trade (adjust contracts accordingly)5. Additional catalysts & risk factorsMacro-beta: BTC dominance and broad market risk-on / risk-off could swamp pattern-based setups; monitor DXY and SPX correlations.Protocol news: Kaspa’s DAG-based roadmap upgrades and potential exchange listings remain upside catalysts. Conversely, lack of progress or regulatory headlines could accelerate a downside break. kaspa.orgWeekend liquidity gaps: KAS often shows slippage outside US trading hours; consider reducing size or using wide stops if breakout occurs late Friday–Sunday.6. To sum upBias: I lean 60 % toward Option 1 (bullish breakout) provided we get a 4 h close above 0.092 with volume confirmation. Otherwise, a flush to the 0.07 area (Option 2) is the alternative. Trade the break, not the prediction, and keep risk tight.
elfabiiani
Technical Analysis – HBAR/USDT + TRADE PLAN

Technical Analysis – HBAR/USDT (Daily Chart as of June 4, 2025)Chart Pattern: Falling Wedge (Bullish)The chart indicates a classic falling wedge pattern, often interpreted as a bullish reversal signal.This pattern is marked by descending converging trendlines, suggesting declining volatility and potential breakout.Breakout point is illustrated just above the wedge’s resistance line, with a bullish breakout expected.Key Support & Resistance LevelsImmediate Support Zone: $0.1625 – $0.1723 (blue zone)Primary Resistance Targets:Short-term: $0.1849 (top of Bollinger Band)Mid-term: $0.2070 – $0.2200Long-term: $0.3400 (strong historical resistance)Indicators SummaryBollinger Bands: Price near the lower band, indicating potential upside volatility.Volume Profile: Slightly increasing near wedge apex, often a precursor to a breakout.VMC Cipher_B: Multiple green dots signal bullish divergence; momentum may be reversing upward.RSI (14): Currently recovering from oversold territory (~39.5), suggesting bullish momentum building.Money Flow Index (ArTy): Moving back into the green, indicating capital inflow and potential accumulation.Stochastic RSI: Crossed upward from oversold zone (currently ~23), a common signal for trend reversal.Trading PlanLong Position Setup (Swing Trade)Entry Zone:$0.1650 – $0.1725 (upon retest of breakout from wedge or candle close above wedge resistance)Stop-Loss:$0.1580 (below wedge support and key structure low)Take-Profit Targets:TP1: $0.1850 (Bollinger Band and resistance zone)TP2: $0.2070 (resistance from March 2025)TP3: $0.2200 – $0.2400 (target zone for full wedge breakout)TP4: $0.3400 (macro-level resistance, if rally continues)Risk-to-Reward: Minimum R:R of 1:2.5 to 1:5 depending on TP level.⚠️ Risk Management & Strategy NotesWait for confirmation breakout candle with strong volume above wedge resistance before entering.Scale in gradually between $0.1650–$0.1725 if confirmed.Trail stop-loss after reaching TP1 to lock in profits.Monitor Bitcoin price trend and overall market sentiment—HBAR tends to follow macro market structure.The combination of the falling wedge, bullish divergence, and oversold momentum indicators supports a strong potential for bullish continuation. However, conservative confirmation is essential before committing capital.Outlook: Bullish bias, pending confirmation breakout above the wedge resistance.
elfabiiani
Technical Analysis – Velas (VLX/USD) + TRADE PLAN

Technical Analysis – Velas (VLX/USD) + TRADE PLANDate of Analysis: June 4, 2025Timeframe: 4-hour (H4)Current Price: $0.0023541Chart Pattern: Falling Wedge (Bullish Reversal Potential)Pattern Description: The price is consolidating within a falling wedge formation — historically a bullish reversal pattern.Breakout Potential: If price breaks upward through the wedge resistance, strong momentum could follow.Support Zone: $0.0020 – $0.0022 (Weekly low zone, strong historical support)Resistance Zones:Immediate: $0.00339 – $0.00397Secondary: $0.00444 – $0.00513Major: $0.00707 (high target zone)Indicators OverviewVMC Cipher_B (Momentum Oscillator):Momentum is deep in the red, approaching oversold territory.Green dots signal potential bullish divergence forming (trend exhaustion).RSI (14):Current: 13.30 → Oversold, significant bounce potential.Last low this deep preceded a strong rally — suggesting a possible bottom.Arty Money Flow Index (MFI):Shows low volume inflows → not ideal, but can turn quickly on bullish reversal.Stochastic RSI:Crossing upwards from deep oversold (<15).Bullish crossover forming → early sign of reversal.Two Scenarios – Trading PlanScenario A: Bullish Breakout (Primary Scenario)Entry: On confirmed breakout of falling wedge → above $0.0026 with volumeTargets:TP1: $0.00339TP2: $0.00444TP3: $0.00513TP4 (Moon Target): $0.00707Stop Loss: $0.00215 (below wedge bottom)Risk/Reward: 1:3 to 1:5 depending on TP levelConfidence: 4/5 (RSI + Wedge support)Scenario B: Bearish Continuation (Fails to Break Out)Trigger: Break below $0.00215 with volumeAction:Short-term panic sell possible down to $0.0015 – $0.0012Watch for capitulation wick and rapid V-recoveryRe-entry Opportunity: If oversold bounces with large green engulfing or V-bottom reversal🧠 Strategic Notes:Velas is at a make-or-break point. Fundamentally, adoption and development updates from the team (esp. Alex & Co.) will heavily influence investor confidence.DYOR Reminder: This is a highly speculative coin in an oversold state. Best used for swing trades or speculative long-term entries with tight risk control.
elfabiiani
Technical Analysis: Worldcoin (WLD/USDT) + TRADE PLAN

Technical Analysis: Worldcoin (WLD/USDT)Chart OverviewPattern: A falling wedge formation is clearly visible, typically a bullish reversal pattern.Potential Breakout: The price has broken above the upper wedge resistance line, indicating a potential bullish breakout.Key Levels:Resistance Zones:$1.26 (SMA50)$1.55–$1.65 (major supply zone)$1.80–$1.90 (final resistance target)Support Zones:$1.18 (local support)$1.00–$1.10 (strong green demand zone)$0.90 (final downside support)Indicators & OscillatorsVolumeVolume shows moderate rising interest during breakout—confirmation would be stronger with larger volume spikes.VMC Cipher BMomentum waves and money flow are turning bullish.Green dots at the bottom suggest bullish divergence and likely upward momentum.RSI (14)Currently at 52.77, crossing above 50—a bullish signal.Not yet overbought, so there's room to move upward.Money Flow Index (MFI)Reading at 63, indicating strong inflows and increased buying pressure.Stochastic RSIBullish crossover, currently at 66.78/75.27, heading upward—supports the breakout scenario.Trading PlanScenario A: Bullish Breakout ConfirmationTrigger: Close above $1.20–$1.22 with rising volume and continued RSI/MFI strength.Buy Zone (Spot 1): $1.18–$1.22Buy Zone (Spot 2): On pullback to wedge breakout line ($1.15–$1.17)Targets:TP1: $1.26 (SMA50)TP2: $1.55–$1.60 (supply zone)TP3: $1.80 (long-term resistance)Stop Loss: Below $1.10 (to invalidate breakout)Risk-Reward Ratio: Minimum 1:2 for TP1, up to 1:4–1:5 for TP3Scenario B: Failed Breakout / Bearish RejectionTrigger: Rejection at $1.20–$1.26 and fall below $1.15 with increasing sell volume.Short Entry (only for experienced traders): Under $1.15Targets:TP1: $1.05 (mid-demand zone)TP2: $0.95–$1.00 (major demand zone)Stop Loss: Above $1.22Note: Prefer to stay out if volume is low—wait for clearer structure.Risk Management & Strategy NotesUse position sizing: No more than 3–5% of capital per trade.Be patient—wait for candle close confirmations.If the price consolidates near $1.20 and volume increases, a strong upward move is likely.Avoid emotional trading—react to price action, not assumptions.Worldcoin (WLD/USDT) is showing strong bullish potential with a confirmed breakout from a falling wedge. Indicators support upward momentum, and the structure favors a move toward the $1.50–$1.80 range. Monitor volume and key support levels to manage risk and confirm trend continuation.
elfabiiani
TECHNICAL ANALYSIS – KASPA/USDT (Daily Chart) + TRADE PLAN

TECHNICAL ANALYSIS – KASPA/USDT (Daily Chart)Chart Pattern & Price Action:Descending Channel (Falling Wedge): KASPA has been trading within a falling wedge pattern, typically a bullish reversal setup.Breakout Zone Approaching: Price is currently testing the upper resistance of the wedge (~$0.086–$0.088). A breakout from this level may indicate trend reversal.Key Resistance Zone:$0.105 – $0.127: Significant supply area (marked in red). Previously rejected, it is the next target if price breaks out upward.Support Zone:$0.073 – $0.082: Demand zone. Coincides with the Bollinger Band lower range and historical support.Indicators Overview:Bollinger Bands:Price is trading at or near the middle band, showing a neutral-to-slightly bearish bias.A breakout above the upper band (~$0.0895) could trigger bullish momentum.MACD (VMC Cipher_B_Divergences):Strong bearish momentum continues, but we can observe potential bullish divergence forming.Green dot signal at the bottom may indicate a possible local bottom.RSI (Relative Strength Index):Currently at 37.06, near oversold territory.Could signal a bounce if RSI climbs above 40 and confirms strength.Money Flow Index (Art’ Money Flow):MFI is deep in negative; however, these levels often precede trend reversals.Watch for a crossover into positive territory as confirmation.Stochastic RSI:Bullish crossover around 14.53 / 15.67 in the oversold zone.Early sign of potential short-term bounce.TRADING PLANEntry Points:ZoneTypePrice RangeReasonBuy Spot 1Conservative$0.073 – $0.082Strong historical support & bottom of wedgeBuy Spot 2Aggressive~$0.086 – $0.089Breakout of descending wedgeBuy Spot 3MomentumBreak above $0.105Bullish confirmation + breakout of major resistanceTake Profit Zones:TP LevelPriceNotesTP1$0.105First resistance / psychological levelTP2$0.127Strong resistance – expect rejection hereTP3$0.15–0.16Major extension target if strong momentumStop-Loss Strategy:Strategy TypePlacementConservativeBelow $0.073AggressiveBelow $0.080Risk Management:Use position sizing relative to account size (e.g., 1–3% risk per trade).Adjust stop-loss dynamically if entering at breakout.Combine with on-chain metrics or volume spikes for higher conviction.SCENARIOS:🔼 Bullish Scenario (Blue Up Arrow):Breakout above wedge → retest → rally toward $0.105+Break $0.105 confirms macro uptrend continuation🔽 Bearish Scenario (Blue Down Arrow):Rejection at wedge top → breakdown of $0.082 → revisit $0.073 supportBelow $0.073 would invalidate short-term bullish structure
elfabiiani
Technical Analysis – KASPA/USDT (1D) + spot trade plan

Technical Analysis – KASPA/USDT (1D)Trend Structure & Price ActionKASPA experienced a strong bullish rally (highlighted in orange) starting in mid-April, followed by a descending channel (bullish flag) correction (highlighted in green).Currently, the price is approaching major support zones, indicating a potential reversal opportunity.Support & Buy Zones (Marked)Buy Spot 1: ~$0.062–$0.067 → Key historical support, potential bottom range.Buy Spot 2: ~$0.070–$0.075 → Moderate support, former resistance turned support.Buy Spot 3: ~$0.078–$0.081 → Current local demand zone and trendline interaction.These zones represent incremental buying opportunities during correction.Indicator Analysis Market Cipher / Divergence IndicatorsMultiple bullish divergence signals are forming (green dots), suggesting buyer interest is growing.Momentum is in deep negative territory and may be bottoming.RSI (14)RSI is at 32.95, which is approaching oversold territory (below 30), signaling a potential reversal.Money Flow Index (MFI)MFI is at 19, which is also considered oversold, showing capital is leaving but likely nearing exhaustion. Stochastic RSIStochastic RSI is below 10 (6.22) and starting to cross, indicating a strong potential bullish reversal in the short term.Trading Plan – KASPA/USDT (Spot Strategy)Entry Strategy (DCA)Buy SpotEntry RangeAllocationReasonSpot 1$0.062 – $0.06750%Major long-term support, deep oversold zoneSpot 2$0.070 – $0.07530%Mid-range support, confirmation zoneSpot 3$0.078 – $0.08120%Early entry for aggressive tradersRisk ManagementStop Loss (optional): Below $0.060 (break of long-term structure)Average Entry (if all 3 zones are filled): ~$0.071 (estimated)Capital Allocation: Use max 3–5% of total capital per setup for risk control. Profit TargetsTarget LevelPriceRationaleTP1$0.092 – $0.095Top of descending channelTP2$0.105Previous swing high (April peak)TP3$0.120Breakout and continuation targetKASPA is currently in a healthy correction within a bullish continuation pattern (falling channel). The confluence of oversold indicators (RSI, MFI, Stoch RSI), support zones, and bullish divergence suggests a favorable buying opportunity for swing or position traders. If the price respects these zones, a bounce toward the prior high or breakout levels is likely.
elfabiiani
KASPA CUP AND HANDLE (TA+TRADE PLAN)

Cup and Handle pattern clearly formed with rounded bottom and emerging handle.This is a strong bullish continuation pattern suggesting a potential breakout once the handle completes.The neckline resistance is approximately at $0.12, and a breakout above this could trigger a strong upward move.Support & Resistance Zones (S/R)Current Price: $0.10895Major Resistance Levels:$0.12 (neckline)$0.14$0.16$0.19 (pattern target)Major Support Levels:$0.10$0.085$0.065Volume AnalysisVolume increased during the formation of the right side of the cup – a bullish signal.Volume has decreased slightly during handle formation, which is expected.IndicatorsRSI (14): 52.89 – Neutral zone. Not overbought or oversold. Room for upward movement.Stochastic (14, 3, 1): 27.76 – Close to oversold; potential bullish crossover incoming.Money Flow Index (MFI): 62 – Healthy inflow of money, not overbought yet.Wave Momentum/Cipher B: Shows bullish divergences and momentum building from recent lows.Price Target (Pattern Projection)Cup depth: ~$0.12 - $0.06 = $0.06Breakout target: $0.12 + $0.06 = $0.18–0.19 zone📈 Trading Plan – KASPA/USDTStrategy: Cup and Handle Breakout EntryAggressive Entry: Buy near current price ($0.108–$0.11) if expecting early breakout.Conservative Entry: Buy on confirmed breakout above $0.12 with strong volume (daily close). Stop-LossPlace SL below handle low, approx. $0.096–$0.098 (depending on risk tolerance).Alternative: wider SL below $0.085 support if aiming for longer-term hold.Take Profit LevelsTP1: $0.14TP2: $0.16TP3: $0.19 (pattern target)Use laddered take-profits for partial exits at each level.Risk ManagementRisk per trade: 1–2% of capitalUse position sizing calculator to adjust size based on SL distance🔄 Re-entry PlanIf breakout fails, monitor $0.085–0.095 zone for support and potential re-entry on double-bottom or bull flag.⚠️ Bearish ScenarioBreakdown below $0.085 invalidates cup and handle.Next support at $0.065.Reassess structure and macro sentiment.
elfabiiani
KASPA (KASUSDT) Technical Analysis, 1D Chart KUCOIN + trade plan
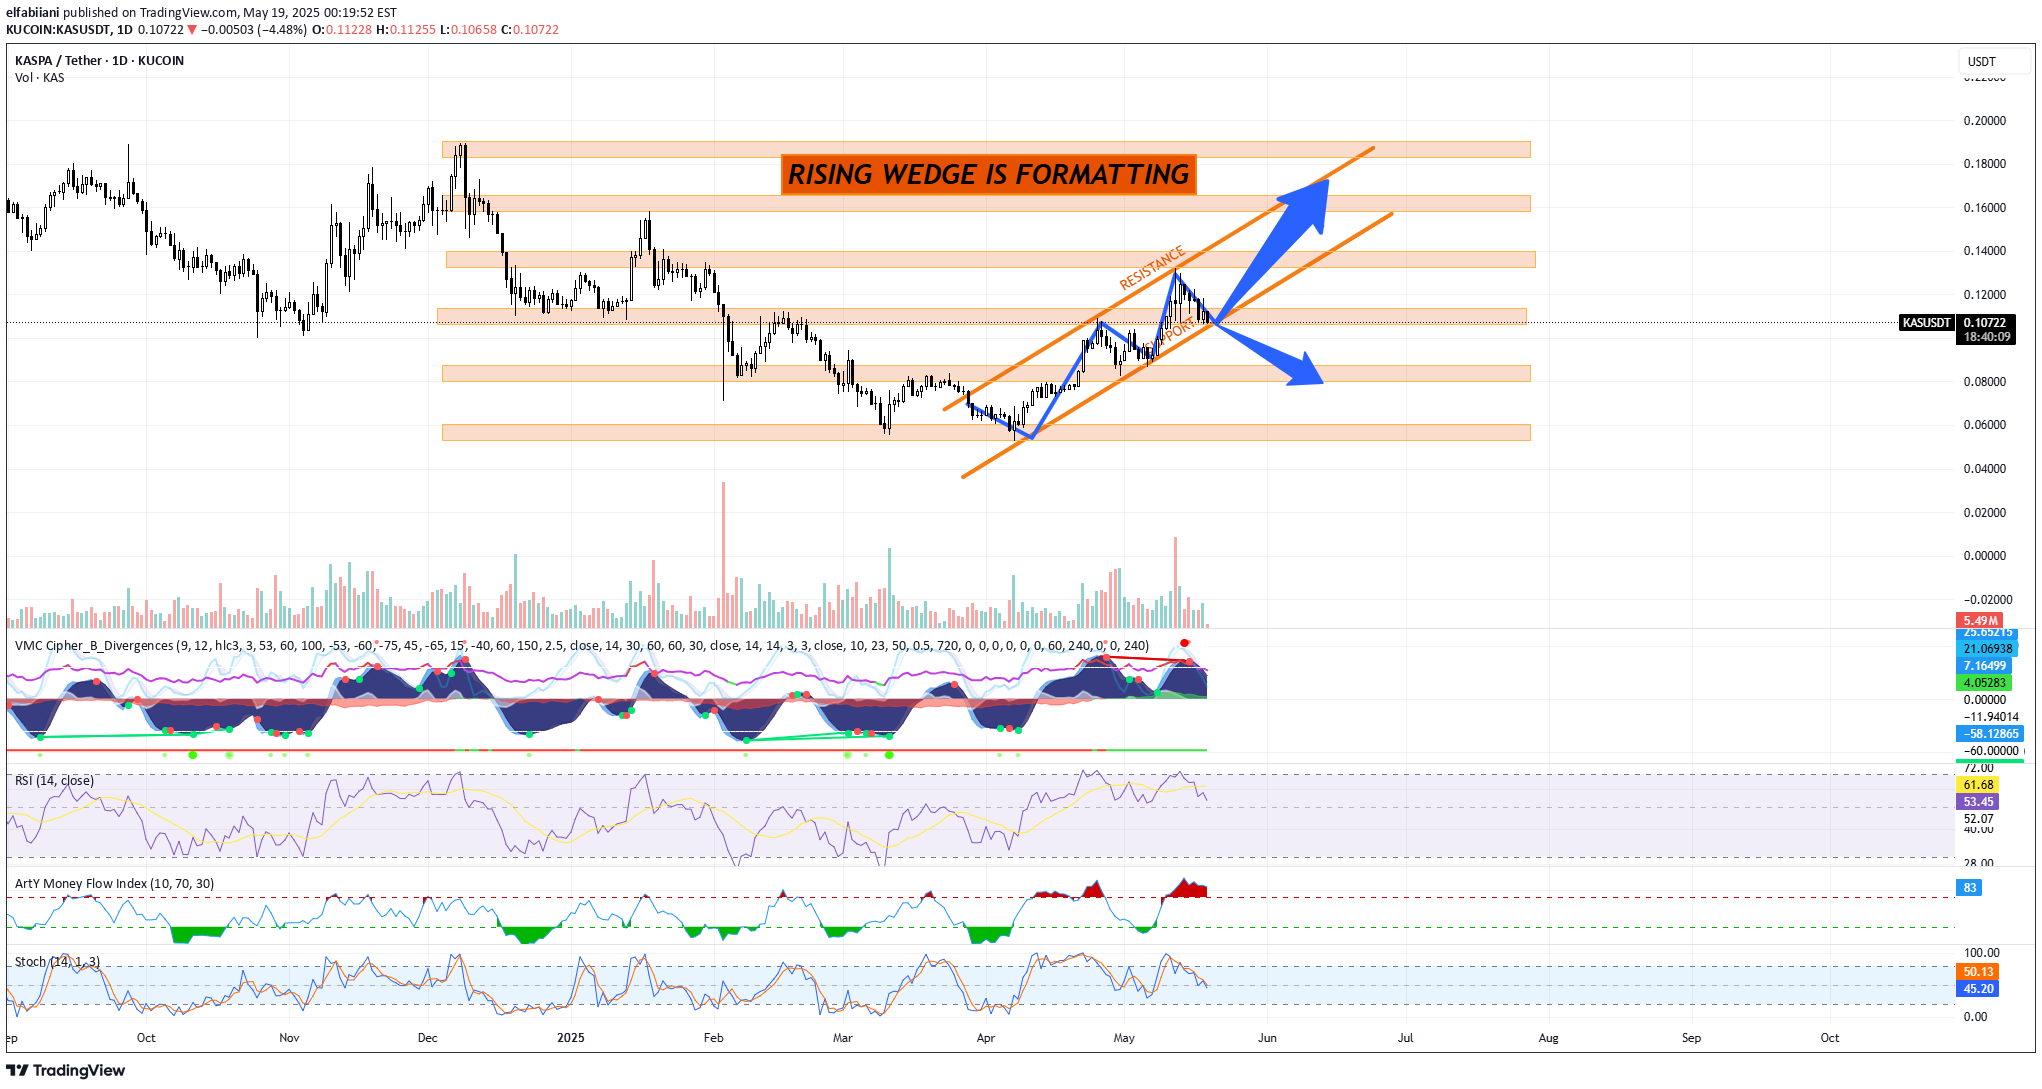
KASPA (KASUSDT) Technical Analysis — 1D Chart by Blaž FabjanDate: May 19, 2025Exchange: KUCOINPair: KAS/USDTChart Pattern: Rising Wedge (Bearish Reversal Signal)A rising wedge is currently forming — characterized by converging trendlines sloping upward.Support and Resistance levels are clearly outlined in the orange zones.This pattern often signals a potential breakdown, but an upward breakout is possible with strong momentum.Key Technical Indicators1. VolumeRecent volume surge on uptrend suggests buying interest, but declining volume into the wedge tip hints at a possible exhaustion.2. VMC Cipher B DivergencesSigns of bearish divergence forming; red dots and momentum wave flattening may signal weakening bullish strength.3. RSI (14)RSI at 53.27: In neutral territory. Slight bearish divergence observed from recent peaks. Watch for a move below 50 as a confirmation of bearish pressure.4. Money Flow Index (MFI)MFI at 83 (overbought zone): Indicates that buying pressure may soon fade, increasing the probability of a correction.5. Stochastic RSI (14, 3, 3)Stochastic RSI near 44–49 and crossing downward: Signaling a potential short-term correction.Key Support & Resistance Zones🟧 Resistance Levels:$0.12 – $0.14 (current wedge resistance zone)$0.16 – $0.18 (next target on bullish breakout)$0.20+ (major resistance if trend continues)🟧 Support Levels:$0.10 (critical support)$0.08 – $0.09 (wedge breakdown target)$0.065 – $0.07 (strong demand zone)Trading Plan for KASPA (KAS/USDT)Bullish Scenario (Breakout Upwards)Entry: Above $0.115 with strong volume confirmationTargets:TP1: $0.14TP2: $0.165TP3: $0.20Stop-Loss: Below $0.10 (to invalidate wedge structure)Bearish Scenario (Breakdown)Entry: Below $0.10 (support break)Targets:TP1: $0.085TP2: $0.072TP3: $0.065Stop-Loss: Above $0.11Neutral/Range StrategyIf KAS trades between $0.10–$0.115 with low volume:Avoid entry.Wait for breakout or breakdown confirmation.Risk ManagementRisk/Reward Ratio: Minimum 2:1Capital Allocation: Max 2–3% of portfolio per tradeUse limit orders to control entry points, especially due to high volatility in crypto markets.The rising wedge pattern is often a precursor to downside in crypto.However, macro bullish news, network upgrades, or volume surges may invalidate the bearish setup.Traders should remain flexible and monitor volume, RSI, and support zones for any signs of reversal.
Disclaimer
Any content and materials included in Sahmeto's website and official communication channels are a compilation of personal opinions and analyses and are not binding. They do not constitute any recommendation for buying, selling, entering or exiting the stock market and cryptocurrency market. Also, all news and analyses included in the website and channels are merely republished information from official and unofficial domestic and foreign sources, and it is obvious that users of the said content are responsible for following up and ensuring the authenticity and accuracy of the materials. Therefore, while disclaiming responsibility, it is declared that the responsibility for any decision-making, action, and potential profit and loss in the capital market and cryptocurrency market lies with the trader.