
ebadshafi89
@t_ebadshafi89

What symbols does the trader recommend buying?
Purchase History
پیام های تریدر
Filter
ebadshafi89
Bitcoin Weekly Chart – Possible Scenarios into September 2025
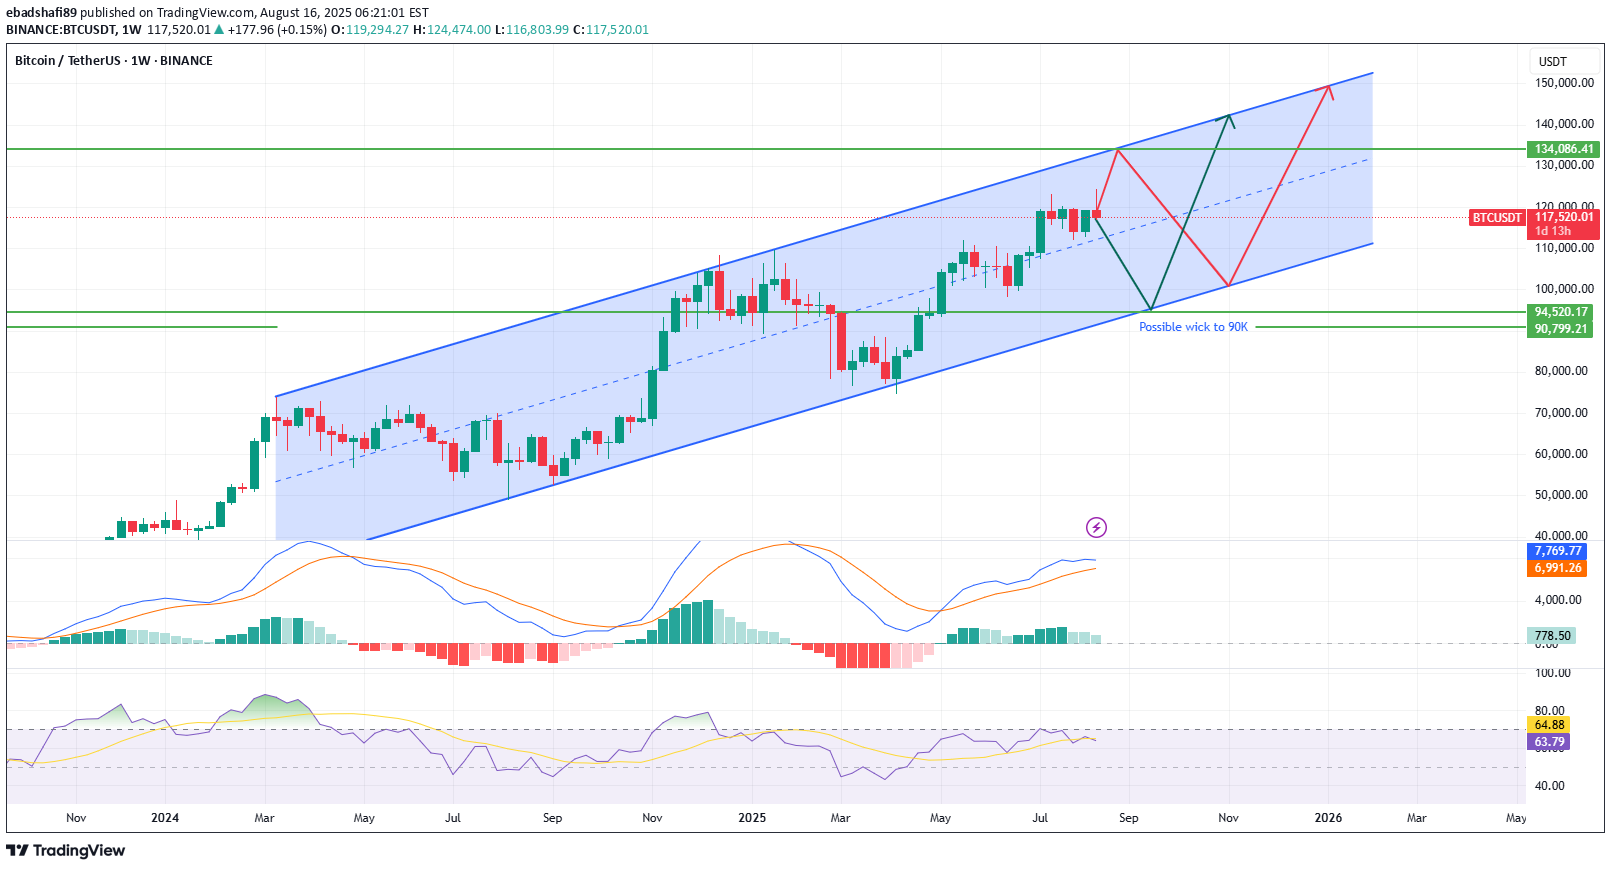
Scenario 1 – Direct Upside Move BTC holds current mid-channel structure and builds momentum. A push toward $134,000 comes first, driven by bullish sentiment and strong inflows. After the rally, possible rejection sends BTC back down to retest $100,000 before any continuation. This path suggests an earlier breakout, followed by a mid-cycle correction. Scenario 2 – Deeper Correction Before Final Rally BTC breaks lower within the channel, sliding toward $94,000 . A wick to $90,500 may form, testing major horizontal support and channel base. This coincides with the September 2025 Fed rate cuts , which could provide the macro catalyst for reversal. From there, BTC rebounds sharply, igniting a strong year-end rally toward $134,000 . This second scenario may align more closely with macro timing, where policy easing sparks the next leg higher. Conclusion: Both scenarios project $134k as the next major upside target. The path differs: Either a direct move with a later retest of $100k (Scenario 1). Or a final deeper flush to $90–94k before the September rate cuts, then a powerful year-end rally (Scenario 2).
ebadshafi89
BTCUSDT 4H: Descending Channel Break—115.4k Retest or 120k Run?
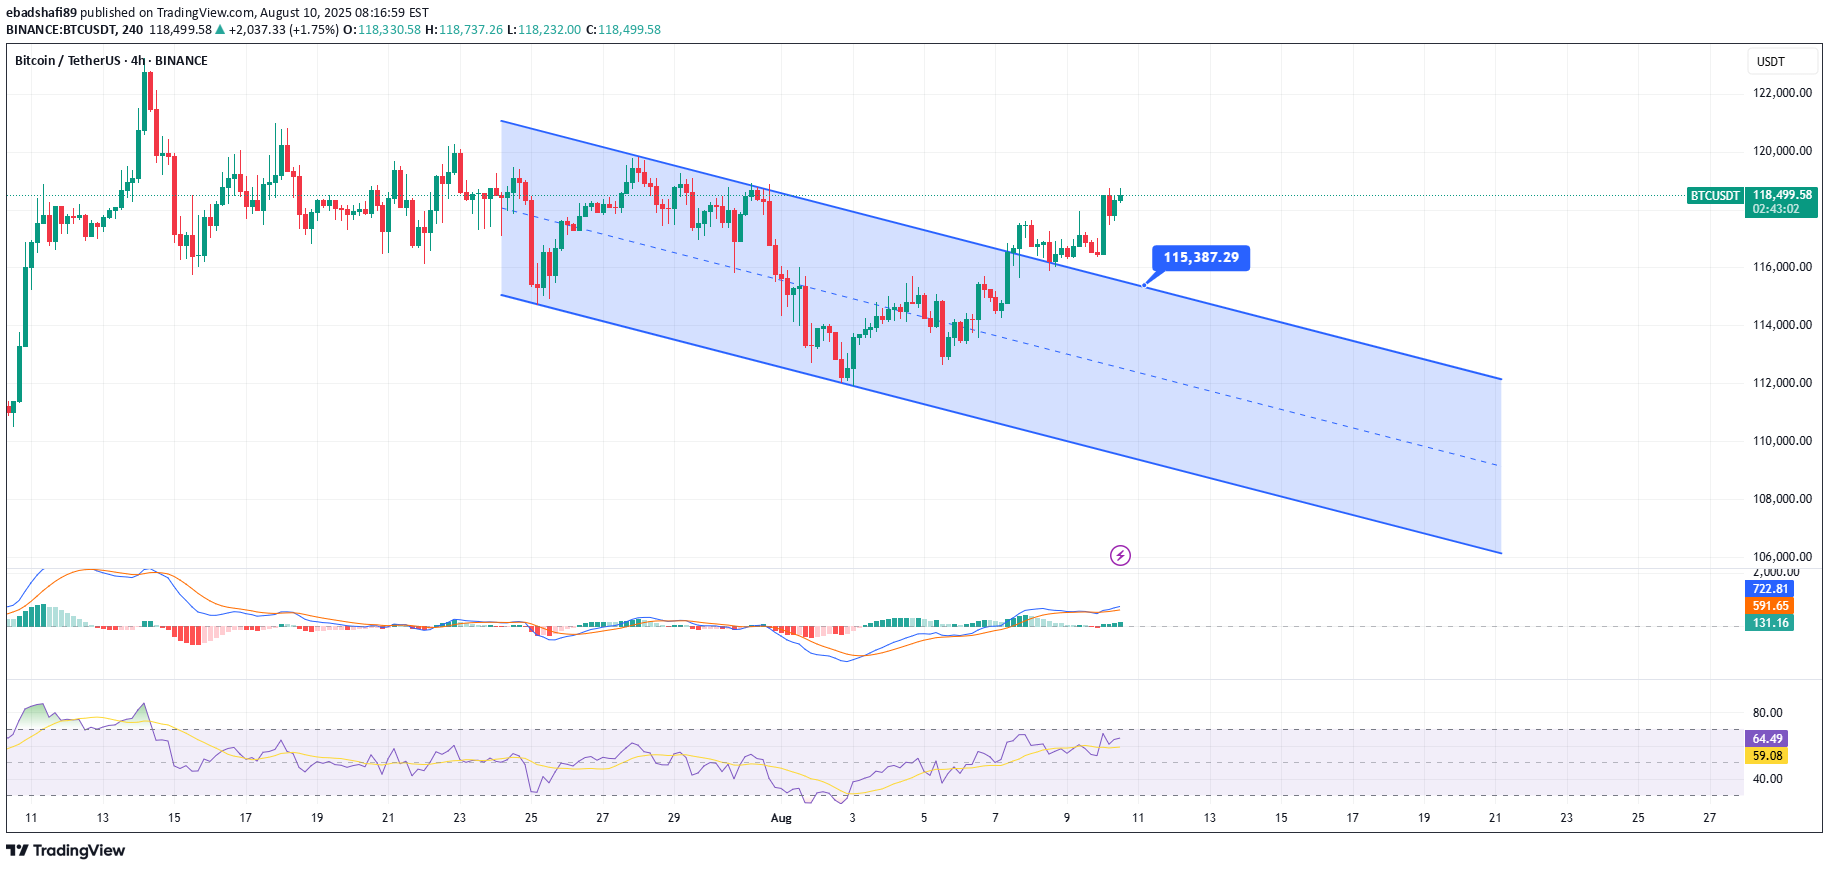
BTCUSDT (BINANCE) – 4H Thesis : Price has broken out of the descending channel (7/25–8/10). Holding above the upper boundary ~115,400 suggests a shift from corrective structure to potential trend continuation higher. A clean retest may offer the better R:R. Key Levels • Resistance : 119,200–120,000; 121,500–122,000; 123,800–124,500 • Support : 117,200–116,500; 115,400 (channel top / breakout line); 113,000; 111,000 Momentum/Signals • MACD is above zero with expanding lines; histogram positive (could cool near resistance). • RSI ~65 on 4H, rising yet not overbought—room higher, but prone to pullback if 70+. Trade Ideas • Long on retest : Look for acceptance above 115,400–116,000 after a pullback (wick + strong 4H close). – Invalidation : 4H close back inside channel <115,400. – Targets : 119,500–120,000 (T1), 121,500–122,000 (T2), 124,000 (T3). • Breakout continuation : If price closes >119,200 with rising volume, consider momentum long. – Invalidation : 4H close <118,200. – Targets : 120,000 (T1), 121,500–122,000 (T2). • Contrarian short (only if failed breakout) : 4H close back below 115,400 and midline rejection. – Targets : 113,000 (T1), 111,000 (T2). – Invalidation : back above 116,300. Risk Management • Size for 1–2% account risk. Wait for 4H candle confirmation; avoid chasing into 120k supply. • Weekend liquidity often creates wicks—plan entries around closes, not intrabar noise. Context : A channel break often precedes a change of character; maintaining higher lows above 115.4k keeps the bullish case intact. Re-entry into the channel would negate. Disclaimer : This is an analysis, not financial advice. Manage your own risk.
ebadshafi89
BTCUSDT – 1H Chart Analysis |Critical Retest at Broken trendline
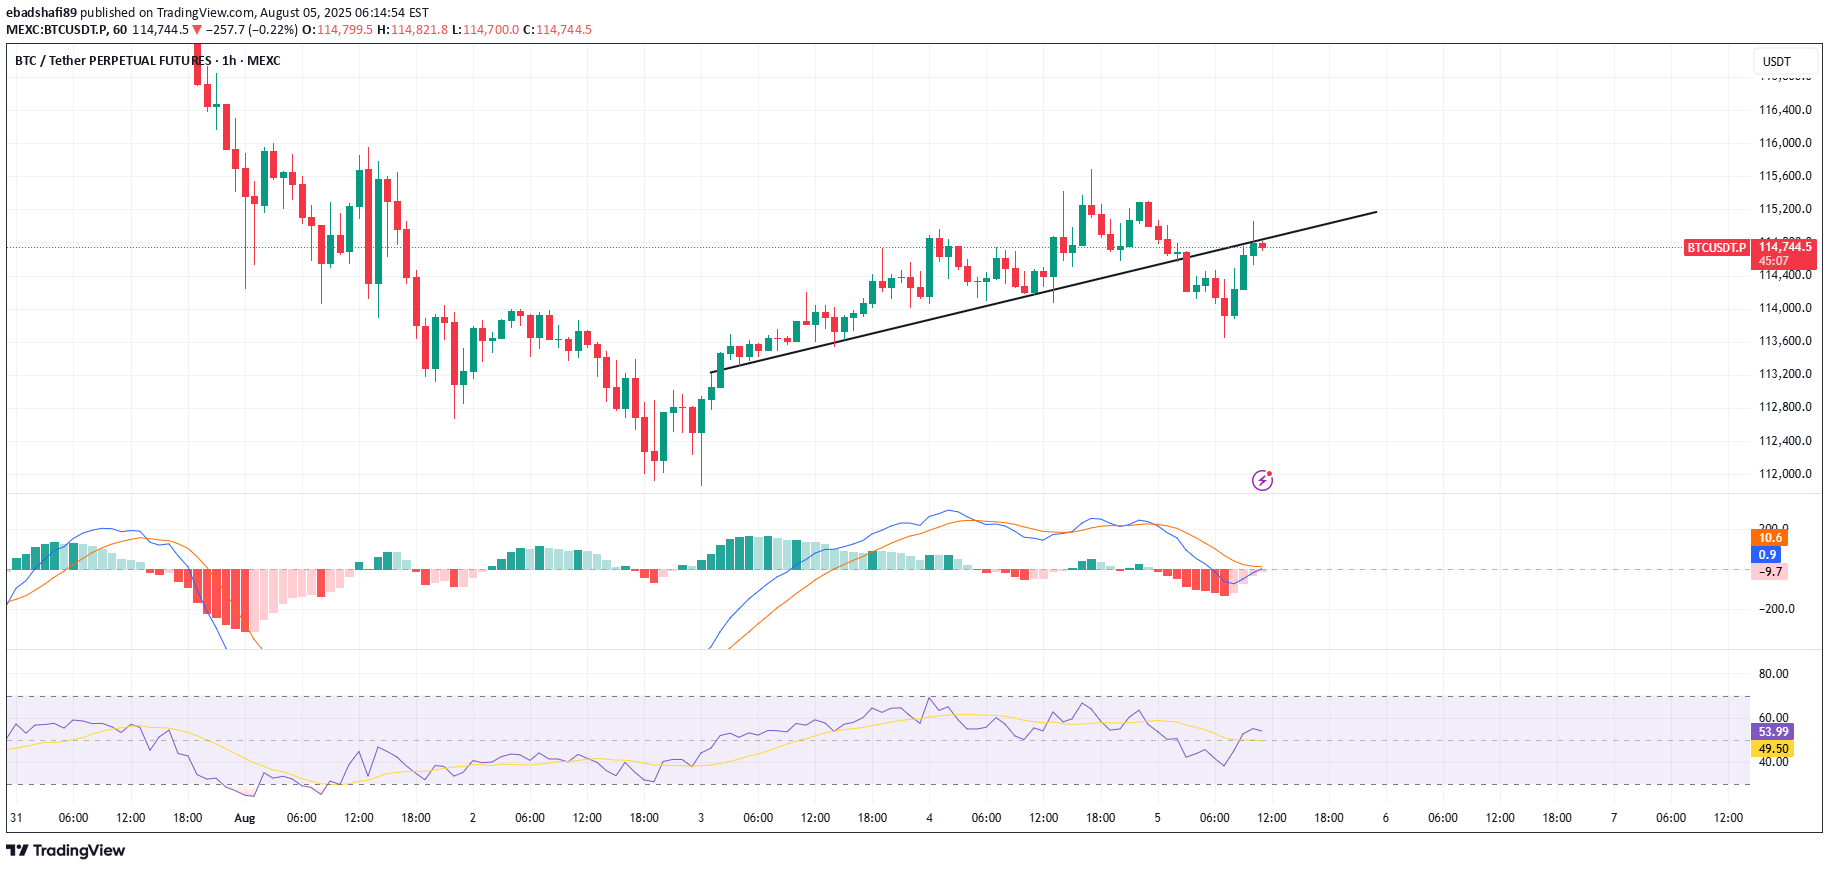
📅 \ Date:\ August 5, 2025 ⏰ \ Timeframe:\ 1H 📍 \ Exchange:\ MEXC 💱 \ Pair:\ BTC/USDT Perpetual Futures --- \ 📉 Trendline Breakdown and Retest\ BTC has broken below the ascending trendline and is now retesting it from the underside. This setup often signals a \ bearish retest\ , especially when momentum is weak and rejection wicks appear near previous support turned resistance. Last rejection came around \ \$114,800\ , right at the underside of the broken trendline. --- \ 🔍 Key Technical Levels\ * \ Resistance:\ \$114,800–\$115,000 (confluence of trendline + supply zone) * \ Support:\ \$113,300 (horizontal green zone, strong historical demand) Failure to reclaim the trendline might open the path toward \ \$113,300\ . A strong breakout above the trendline may flip bias short-term bullish. --- \ 📊 Indicators Overview\ \ MACD\ : • Bearish momentum is fading • Bullish crossover is forming but not yet confirmed • Needs clearer separation and histogram recovery for confirmation \ RSI:\ • Currently at \ 49.43\ , struggling to cross the midline • Facing resistance near \ 53.14\ • Neutral to slightly bearish momentum --- \ ⚠️ What to Watch\ 🔺 \ Bullish Scenario:\ Break and close above \$115,000 → continuation toward \$116,200 🔻 \ Bearish Scenario:\ Rejection at trendline → decline toward \$113,300 --- \ 🧭 Conclusion\ BTC is at a decision point. The next few candles will likely confirm whether this is a failed breakdown or a clean rejection. Watch volume and candle closes carefully. \ Patience is key – confirmation is everything.\ --- \ #Bitcoin #BTCUSDT #TechnicalAnalysis #Trendline #MACD #RSI #SupportResistance #CryptoTrading\ACTIVATED :)
ebadshafi89
"ETH Warning Signal: Is a Bearish Breakdown Imminent?"
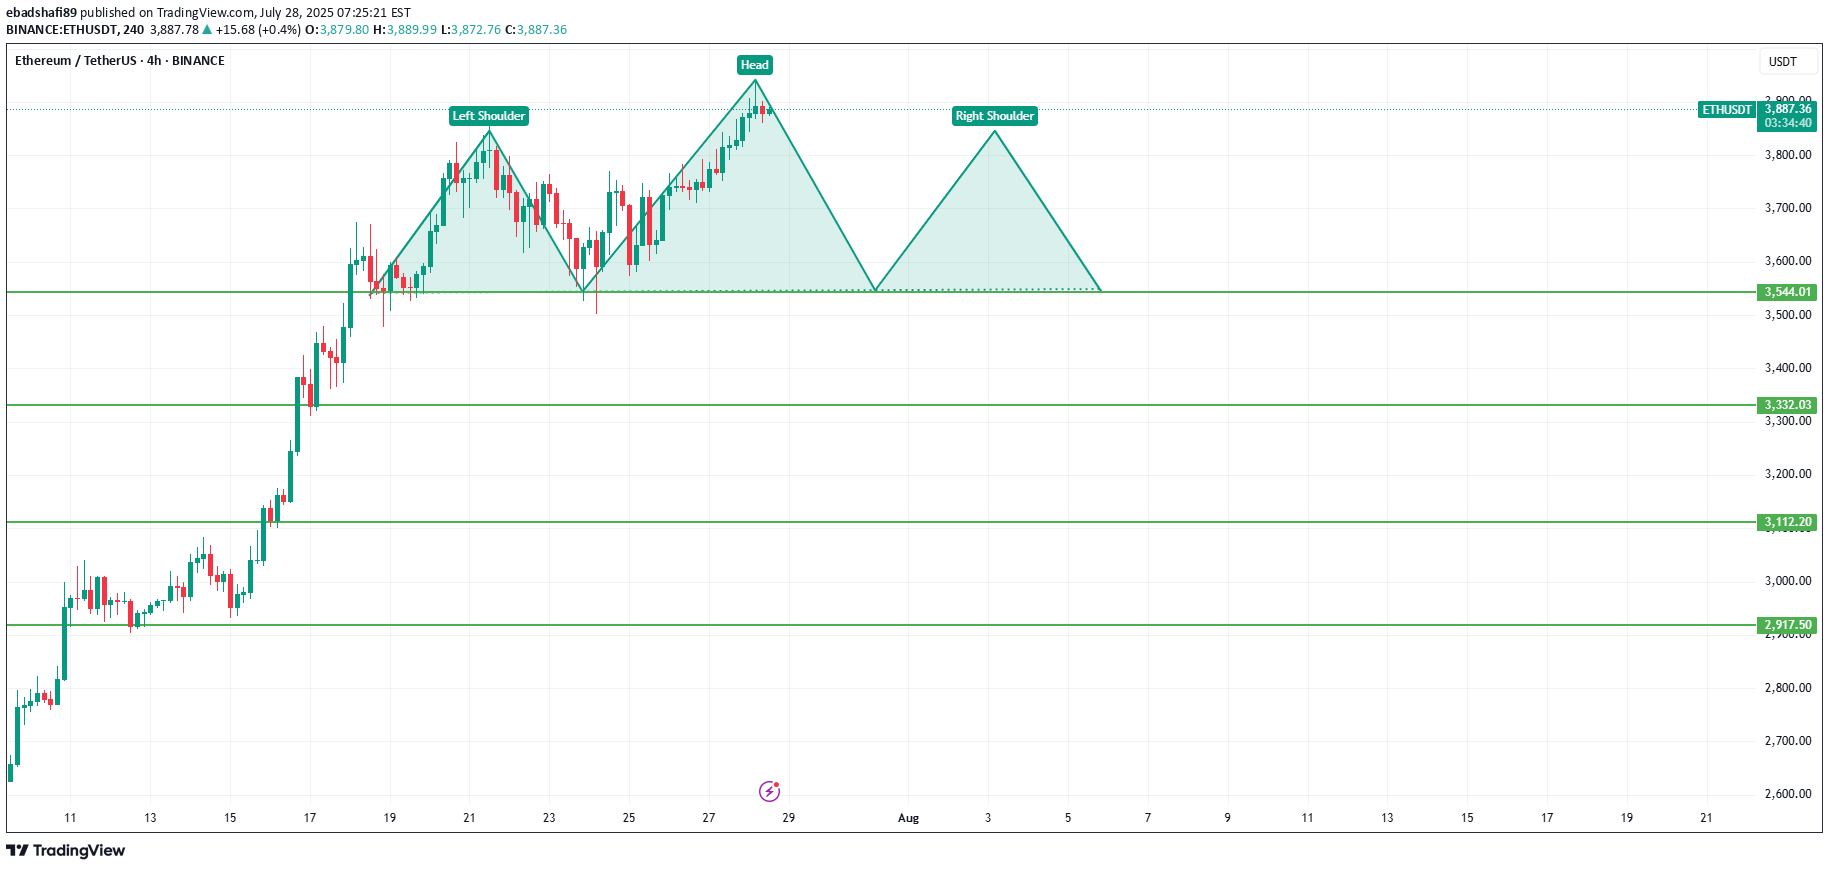
📊 Pattern Overview: Head and Shoulders Left Shoulder: Formed around July 24th, marked by a high near $3,800 followed by a retracement. Head: A higher peak on July 27th, topping out near $3,888, then pulling back again. Right Shoulder: Currently anticipated, projected to form around the same height as the left shoulder, with a potential completion near $3,800 before another decline. Neckline: Flat support line around $3,544, acting as the crucial level that, if broken, confirms the pattern. 🧠 Interpretation The Head and Shoulders is generally interpreted as a trend reversal pattern. In this context, Ethereum has been in a strong uptrend, but the pattern signals a potential topping out and shift toward a bearish phase. If ETH breaks below the neckline at $3,544 with volume confirmation, it would signal that bulls are losing control, and sellers may take over. 📉 Bearish Breakdown Target The theoretical downside target can be calculated by measuring the distance from the Head to the Neckline and projecting it downward from the neckline: Head peak: ~$3,888 Neckline: ~$3,544 Height: ~$344 📌 Target after breakdown: $3,544 - $344 = $3,200 (approx.), with interim support levels around: $3,332 (horizontal support) $3,112 $2,917 These levels might act as pause points or bounce zones if the breakdown unfolds. 🟢 Invalidation Scenario If Ethereum invalidates the pattern by: Breaking above the Head level ($3,888) and holding Sustaining higher highs with strong volume Then the bearish thesis would be invalidated, and bulls may aim for continuation toward $4,000+ levels. 🧩 Strategic Takeaways Aggressive traders might short the neckline break at $3,544, with stops just above the right shoulder (~$3,800). Conservative traders may wait for a retest of the neckline post-breakdown. Risk management is key, especially in crypto markets, which are known for head fakes and false breakouts. ⏳ Final Thought This setup doesn't guarantee a drop—it merely increases the probability of a reversal. Watch for volume on the neckline break and monitor how price reacts at key support levels. DYOR before taking a trade
ebadshafi89
BTC at CROSS ROADS

### 📌 **BTC/USDT – Crucial 4H Price Action Ahead!** 📌 BTC is currently navigating within an *ascending channel* pattern on the **4-hour timeframe**. Recently, we experienced a brief *fake breakdown*, quickly reversed by bullish momentum. BTC is now approaching the critical resistance level near **\$107.4k**. ### 🚩 **Key Levels:** * **Resistance:** \$107.4k (critical test) * **Immediate Support:** \$105k ### 📊 **Technical Indicators:** * **RSI:** *Neutral (\~50)* – Direction undecided, waiting for a clear move. * **MACD:** *Momentum weakening* – Indicates traders should remain cautious. ### 🔮 **Potential Scenarios:** * **✅ Bullish:** A breakout above **\$107.4k** would likely open the gates to higher targets around **\$109k–\$110k**. * **❌ Bearish:** A rejection at **\$107.4k** could trigger a move back toward support near **\$105k**, with potential further downside. ### 📢 **Summary & Trading Tips:** Watch closely for BTC’s reaction around **\$107.4k**. Confirm breakouts with additional signals from RSI and MACD to mitigate risk. **Trade carefully!**
ebadshafi89
Fart going to Fart again
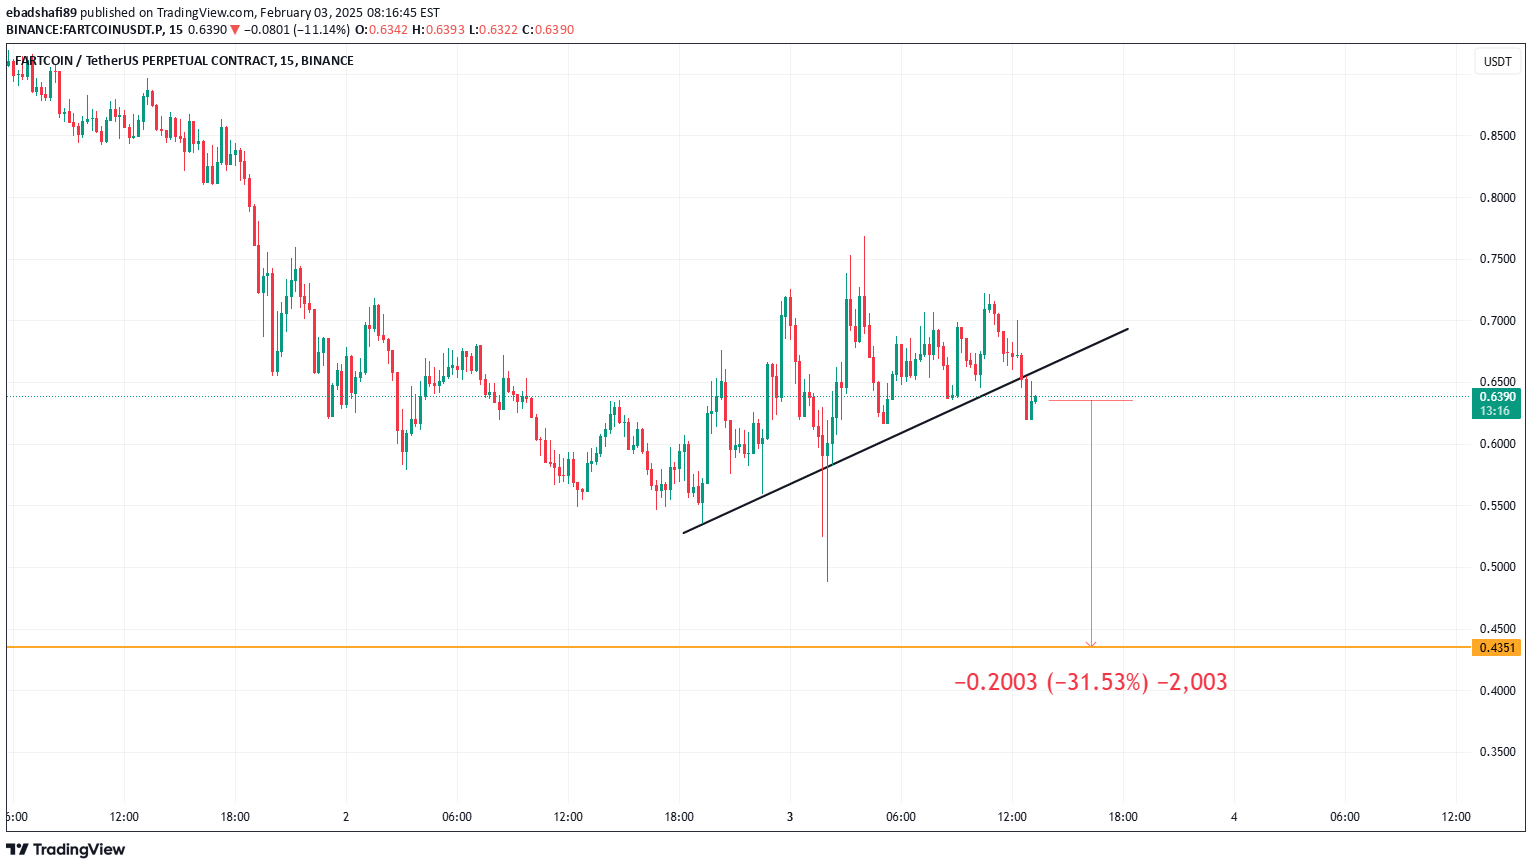
After it has liquidated many traders It is going further down now Rejection on EMA50 on 15mins time frame Target value 0.43 - 0.44 Long from there.
ebadshafi89
BTC to touch 104 - 105 and then another fall next weekend

Get ready for some short term gains. Alt rally after 2 weeks.
ebadshafi89
Bitcoin down to 92K

Triangle Pattern Formation: The chart initially shows Bitcoin forming a symmetrical triangle pattern, which is a consolidation phase where the price oscillates between two converging trendlines (one upward-sloping and one downward-sloping). Triangle Breakdown: The price breaks down below the lower trendline of the triangle, signaling a bearish move. This breakdown typically indicates that sellers have gained control, and further downward momentum is expected. Volume Confirmation: Notice the spike in trading volume during the breakdown. This validates the bearish breakout as higher volume confirms market participants' interest in the move. Retest of Broken Support: After the breakdown, the price reverses and "retests" the previous support level (now turned into resistance). This is a common occurrence in technical analysis, where the price revisits the broken level before resuming the downtrend. Current RSI Levels: At the bottom of the chart, the Relative Strength Index (RSI) is displayed. The RSI dipped into oversold territory during the breakdown, signaling that selling pressure was extreme. The RSI has since rebounded, which may indicate reduced selling momentum or a potential short-term bounce. Key Observations: Breakdown and Retest: The triangle's support acted as a resistance upon retest, which suggests bearish continuation unless the price strongly reclaims the level. Bearish Momentum: The initial breakdown with volume suggests further downside may be possible if the retest fails. Monitoring Levels: If the price closes above the resistance line, it could invalidate the bearish setup.
ebadshafi89
TRUMP is clearly going in a downtrend
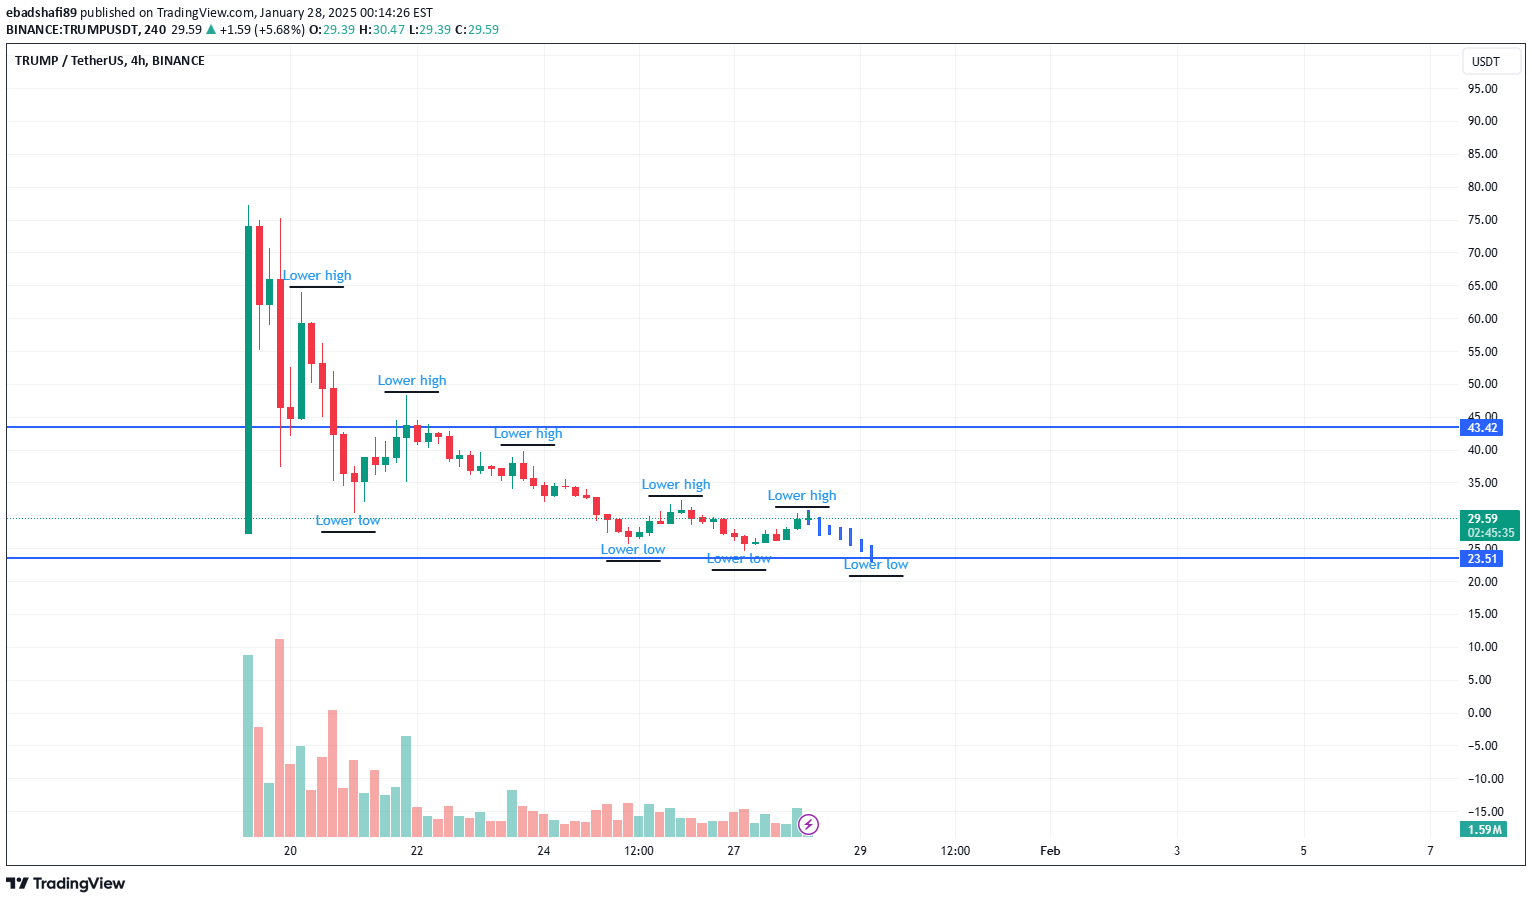
Making lower highs and lower lows, you can easily trade the coin Long way for a bullish trend to come on this Many spot holders are present, and they'll have to wait for long time to break even at prices purchased above. Next one week, we might see trump going to 23$
ebadshafi89
POWR USDT ready for another bullish wave

This coin is ready to break out in the next one week for another bullish wave. Get ready for some profits. Entry on CMP
Disclaimer
Any content and materials included in Sahmeto's website and official communication channels are a compilation of personal opinions and analyses and are not binding. They do not constitute any recommendation for buying, selling, entering or exiting the stock market and cryptocurrency market. Also, all news and analyses included in the website and channels are merely republished information from official and unofficial domestic and foreign sources, and it is obvious that users of the said content are responsible for following up and ensuring the authenticity and accuracy of the materials. Therefore, while disclaiming responsibility, it is declared that the responsibility for any decision-making, action, and potential profit and loss in the capital market and cryptocurrency market lies with the trader.