Technical analysis by ebadshafi89 about Symbol BTC: Sell recommendation (8/5/2025)

ebadshafi89
BTCUSDT – 1H Chart Analysis |Critical Retest at Broken trendline
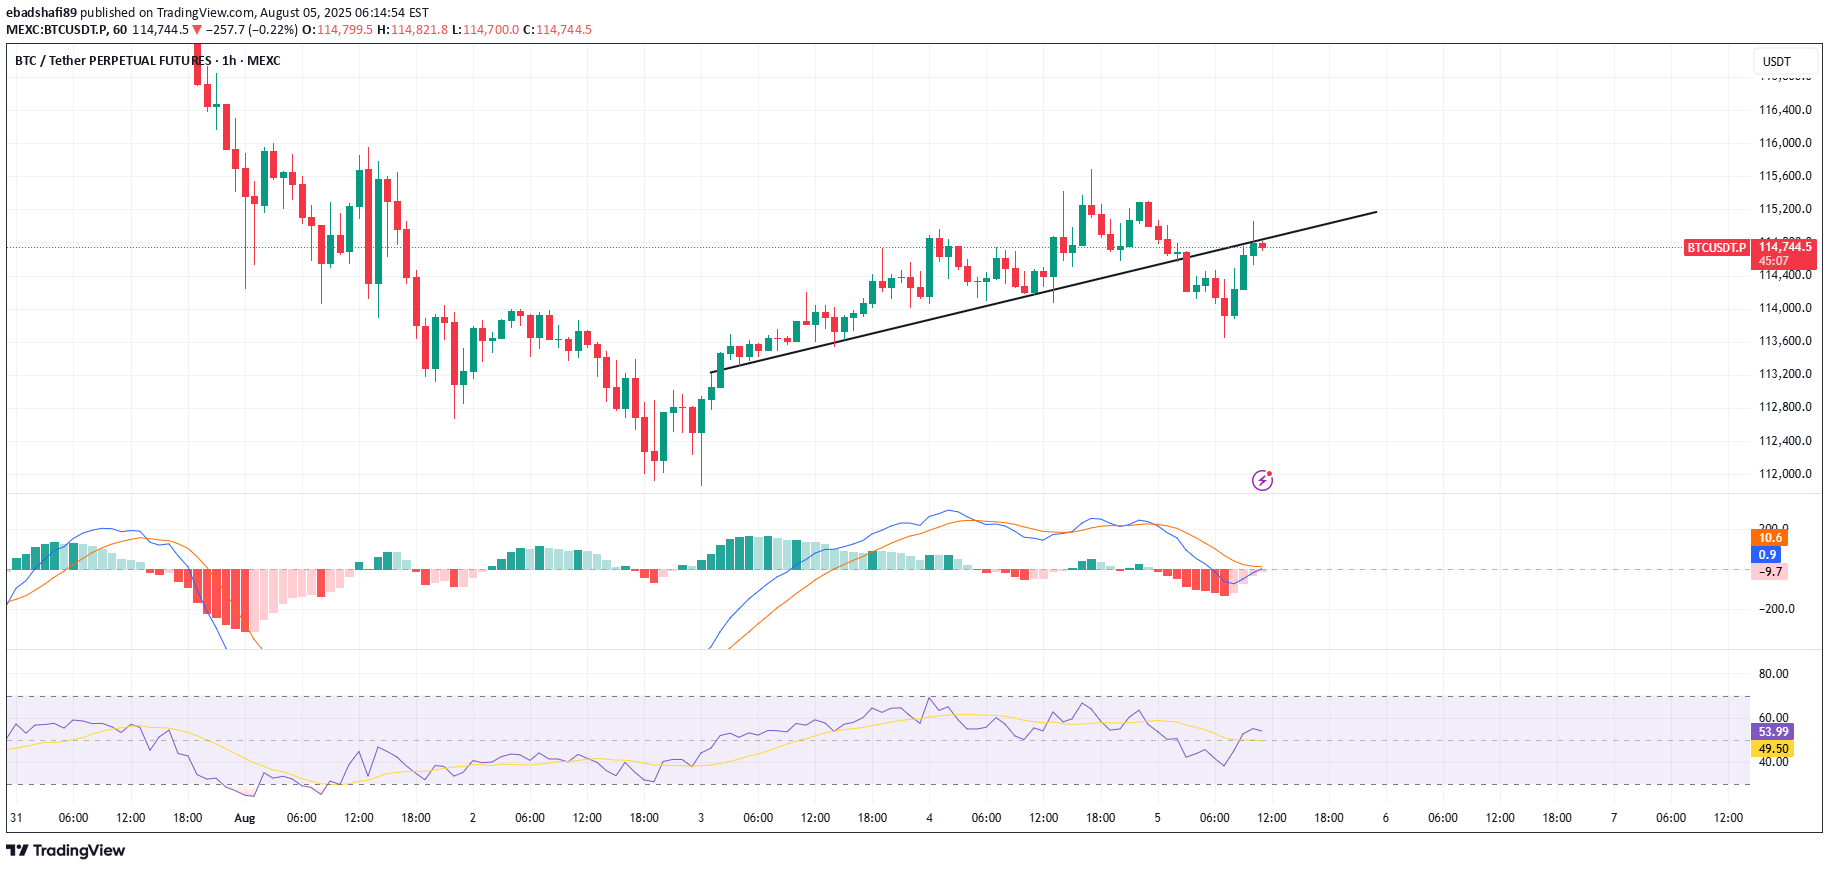
📅 \ Date:\ August 5, 2025 ⏰ \ Timeframe:\ 1H 📍 \ Exchange:\ MEXC 💱 \ Pair:\ BTC/USDT Perpetual Futures --- \ 📉 Trendline Breakdown and Retest\ BTC has broken below the ascending trendline and is now retesting it from the underside. This setup often signals a \ bearish retest\ , especially when momentum is weak and rejection wicks appear near previous support turned resistance. Last rejection came around \ \$114,800\ , right at the underside of the broken trendline. --- \ 🔍 Key Technical Levels\ * \ Resistance:\ \$114,800–\$115,000 (confluence of trendline + supply zone) * \ Support:\ \$113,300 (horizontal green zone, strong historical demand) Failure to reclaim the trendline might open the path toward \ \$113,300\ . A strong breakout above the trendline may flip bias short-term bullish. --- \ 📊 Indicators Overview\ \ MACD\ : • Bearish momentum is fading • Bullish crossover is forming but not yet confirmed • Needs clearer separation and histogram recovery for confirmation \ RSI:\ • Currently at \ 49.43\ , struggling to cross the midline • Facing resistance near \ 53.14\ • Neutral to slightly bearish momentum --- \ ⚠️ What to Watch\ 🔺 \ Bullish Scenario:\ Break and close above \$115,000 → continuation toward \$116,200 🔻 \ Bearish Scenario:\ Rejection at trendline → decline toward \$113,300 --- \ 🧭 Conclusion\ BTC is at a decision point. The next few candles will likely confirm whether this is a failed breakdown or a clean rejection. Watch volume and candle closes carefully. \ Patience is key – confirmation is everything.\ --- \ #Bitcoin #BTCUSDT #TechnicalAnalysis #Trendline #MACD #RSI #SupportResistance #CryptoTrading\ACTIVATED :)