
cryptoonchain
@t_cryptoonchain

What symbols does the trader recommend buying?
Purchase History
پیام های تریدر
Filter
cryptoonchain
بیت کوین به کجا میرود؟ خطر سقوط به مرز 70 هزار دلار!
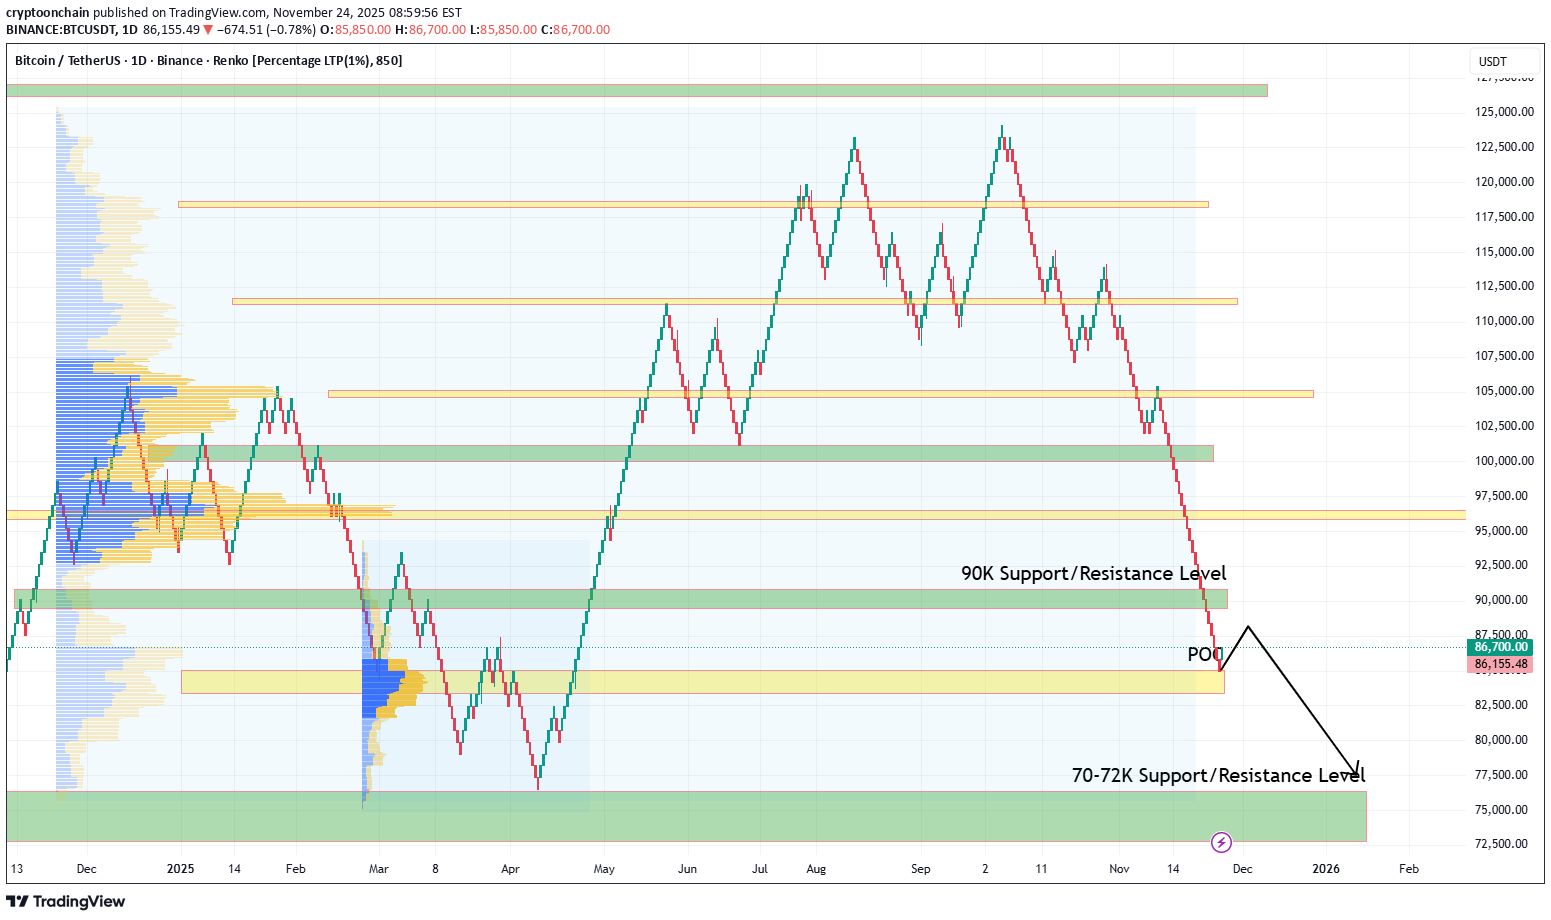
BTC has officially lost the critical 90K support level and is now getting magnetized toward the POC (Point of Control) of the 70K–90K range, which sits around $83K. We are now trading back inside this major fluctuation zone. The 70K–72K area is historically significant — it was the cycle top resistance previously, and now acts as crucial support. 🔮 Outlook: Since entering this range, a retest of the lower boundary is highly probable. I expect BTC to drop toward the 70K–73K support/resistance level. ⏳ Timing: This move might not happen immediately. We could see consolidation or choppy price action around/above the POC for a few days or weeks before the final leg down to test the support. #Bitcoin #BTC #Crypto #Trading #TechnicalAnalysis #POC #SupportAndResistance
cryptoonchain
بیت کوین در مرز ۱۰۰ هزار دلار: نبرد سرنوشتساز خریداران و فروشندگان!
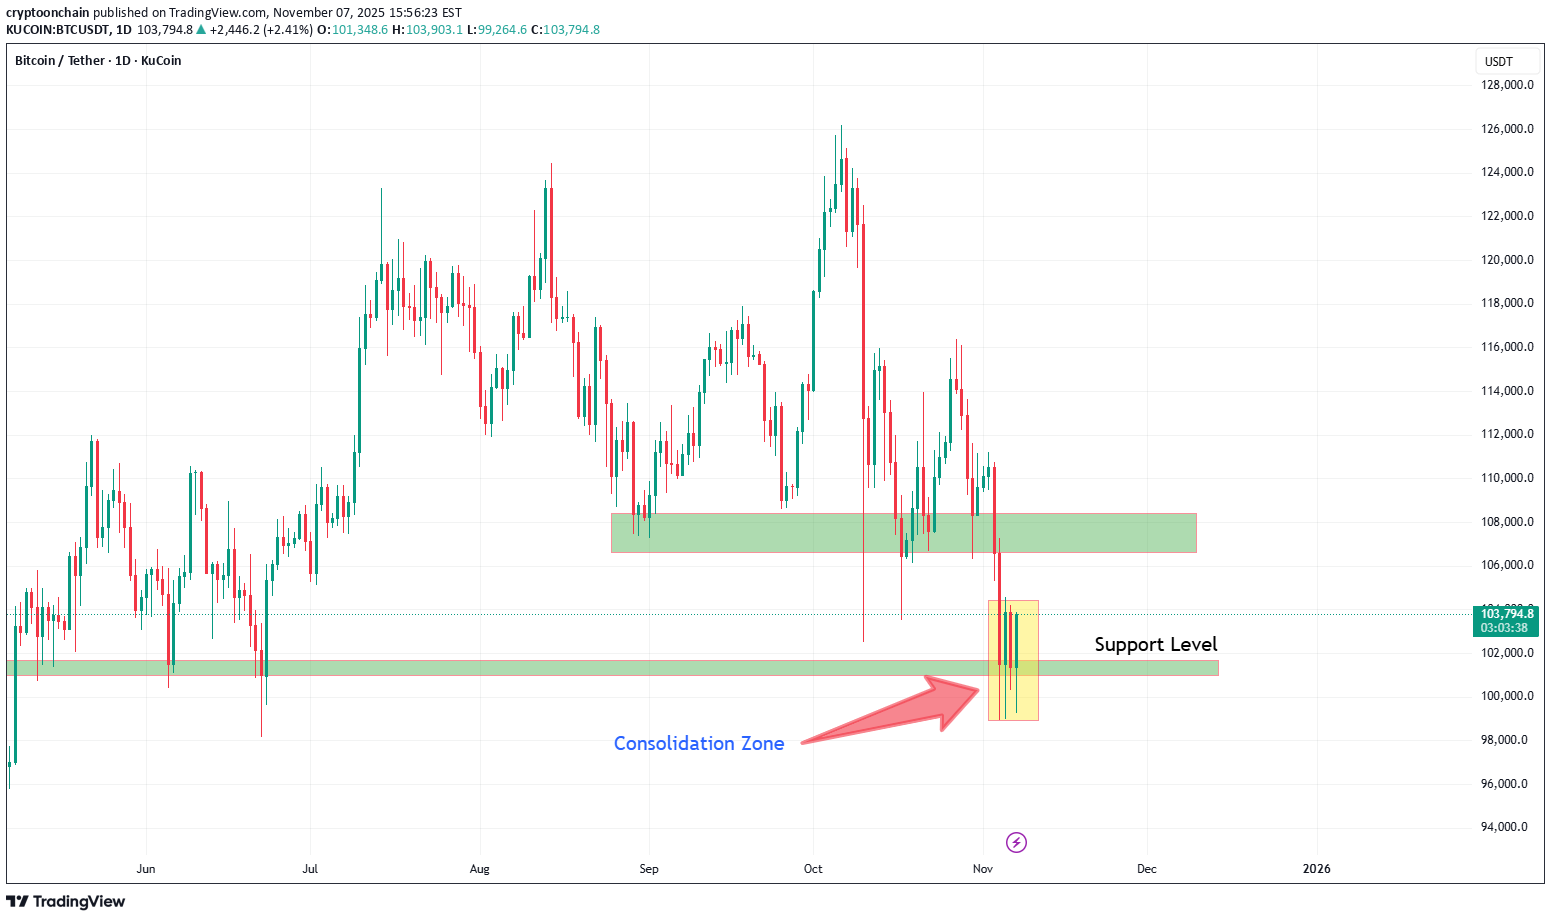
The price has reached a crucial support zone at $102,000 and has stalled after a sharp decline. 🛑 The pattern in the yellow box is a Consolidation Zone, signifying a fierce battle between buyers and sellers and diminishing selling pressure. 🥊 #PriceAction If the price breaks above the ceiling of this Consolidation Zone, we can expect a rally towards the next resistance at $108,000. 🚀 #BullishScenario However, if this support fails and the price closes below the floor of the Consolidation Zone, more downside can be expected. 😨 #Risk The market is currently indecisive 🤔; it’s best to wait for a confirmation signal (a breakout) before entering a trade. Patience is the best strategy at this point, until the market’s next direction becomes 💰
cryptoonchain
GOLD (XAU/USD): Ascending Triangle Signals Imminent Breakout to
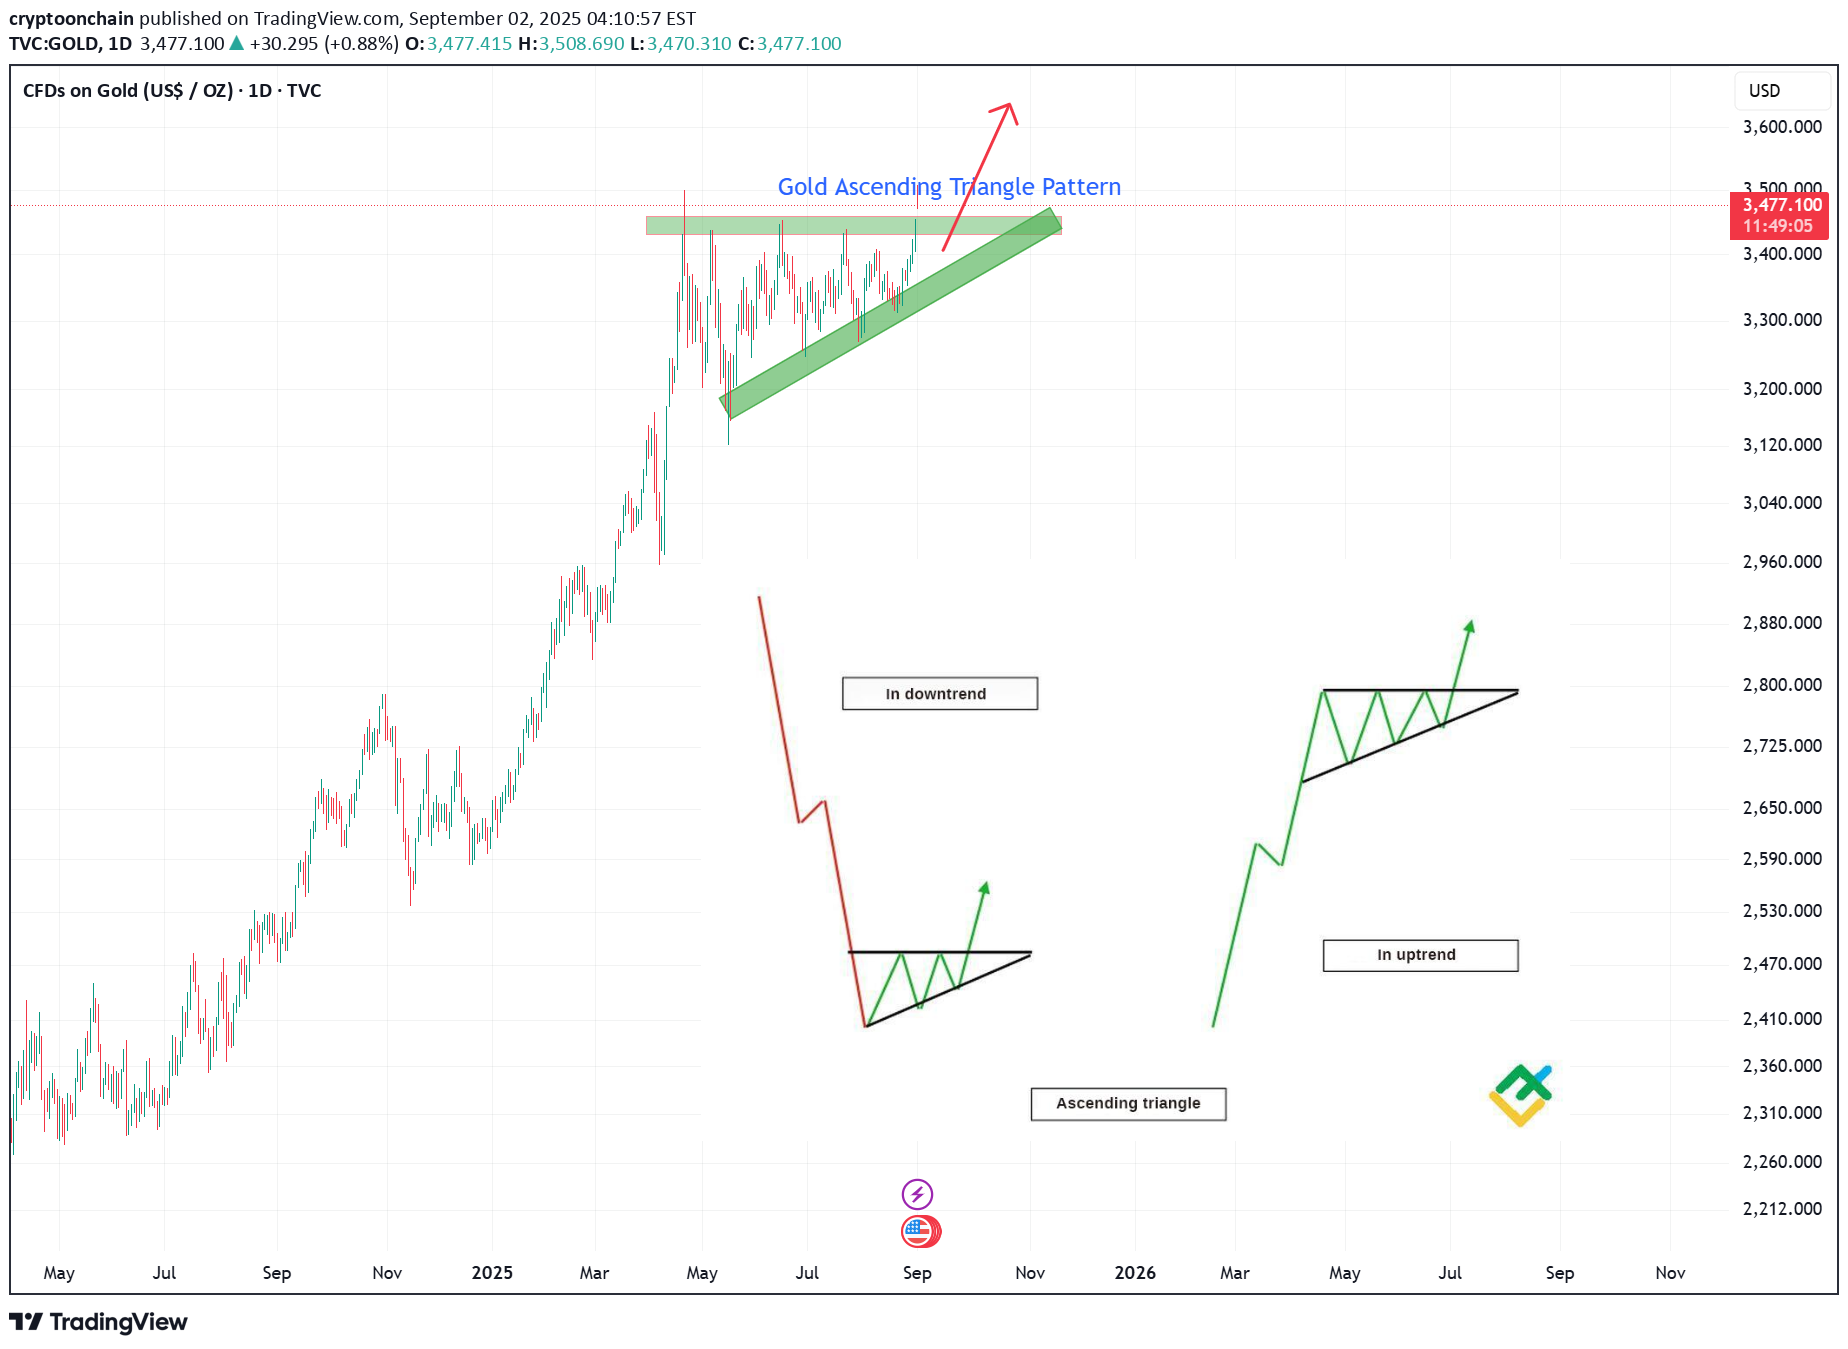
Gold is coiling up for a major move. The daily chart reveals a classic Ascending Triangle, a powerful bullish continuation pattern, suggesting the uptrend is ready to resume. Key Pattern Elements: Resistance: A flat, horizontal resistance level has formed around the $3,460 - $3,480 zone. This level has been tested multiple times, confirming its significance as a major hurdle. Support: A rising trendline connects a series of higher lows, indicating consistent and strengthening buying pressure. Trade Plan & Key Levels: Entry Signal (Long): A decisive daily candle close above $3,480. A surge in volume on the breakout would provide strong confirmation. Price Target: Based on the height of the triangle, the measured move projects a target near $3,800. Invalidation: The bullish setup is negated if the price breaks down below the ascending support trendline. Conclusion: The battle between buyers and sellers is nearing its climax. The structure strongly favors the bulls. Patience is key—wait for a confirmed breakout above resistance before entering a long position. This setup offers a clear path to new all-time highs. Disclaimer: This is not financial advice. Always conduct your own analysis.
cryptoonchain
Gold (TVC:USOIL) Forms Bullish Ascending Triangle - ATH Breakout
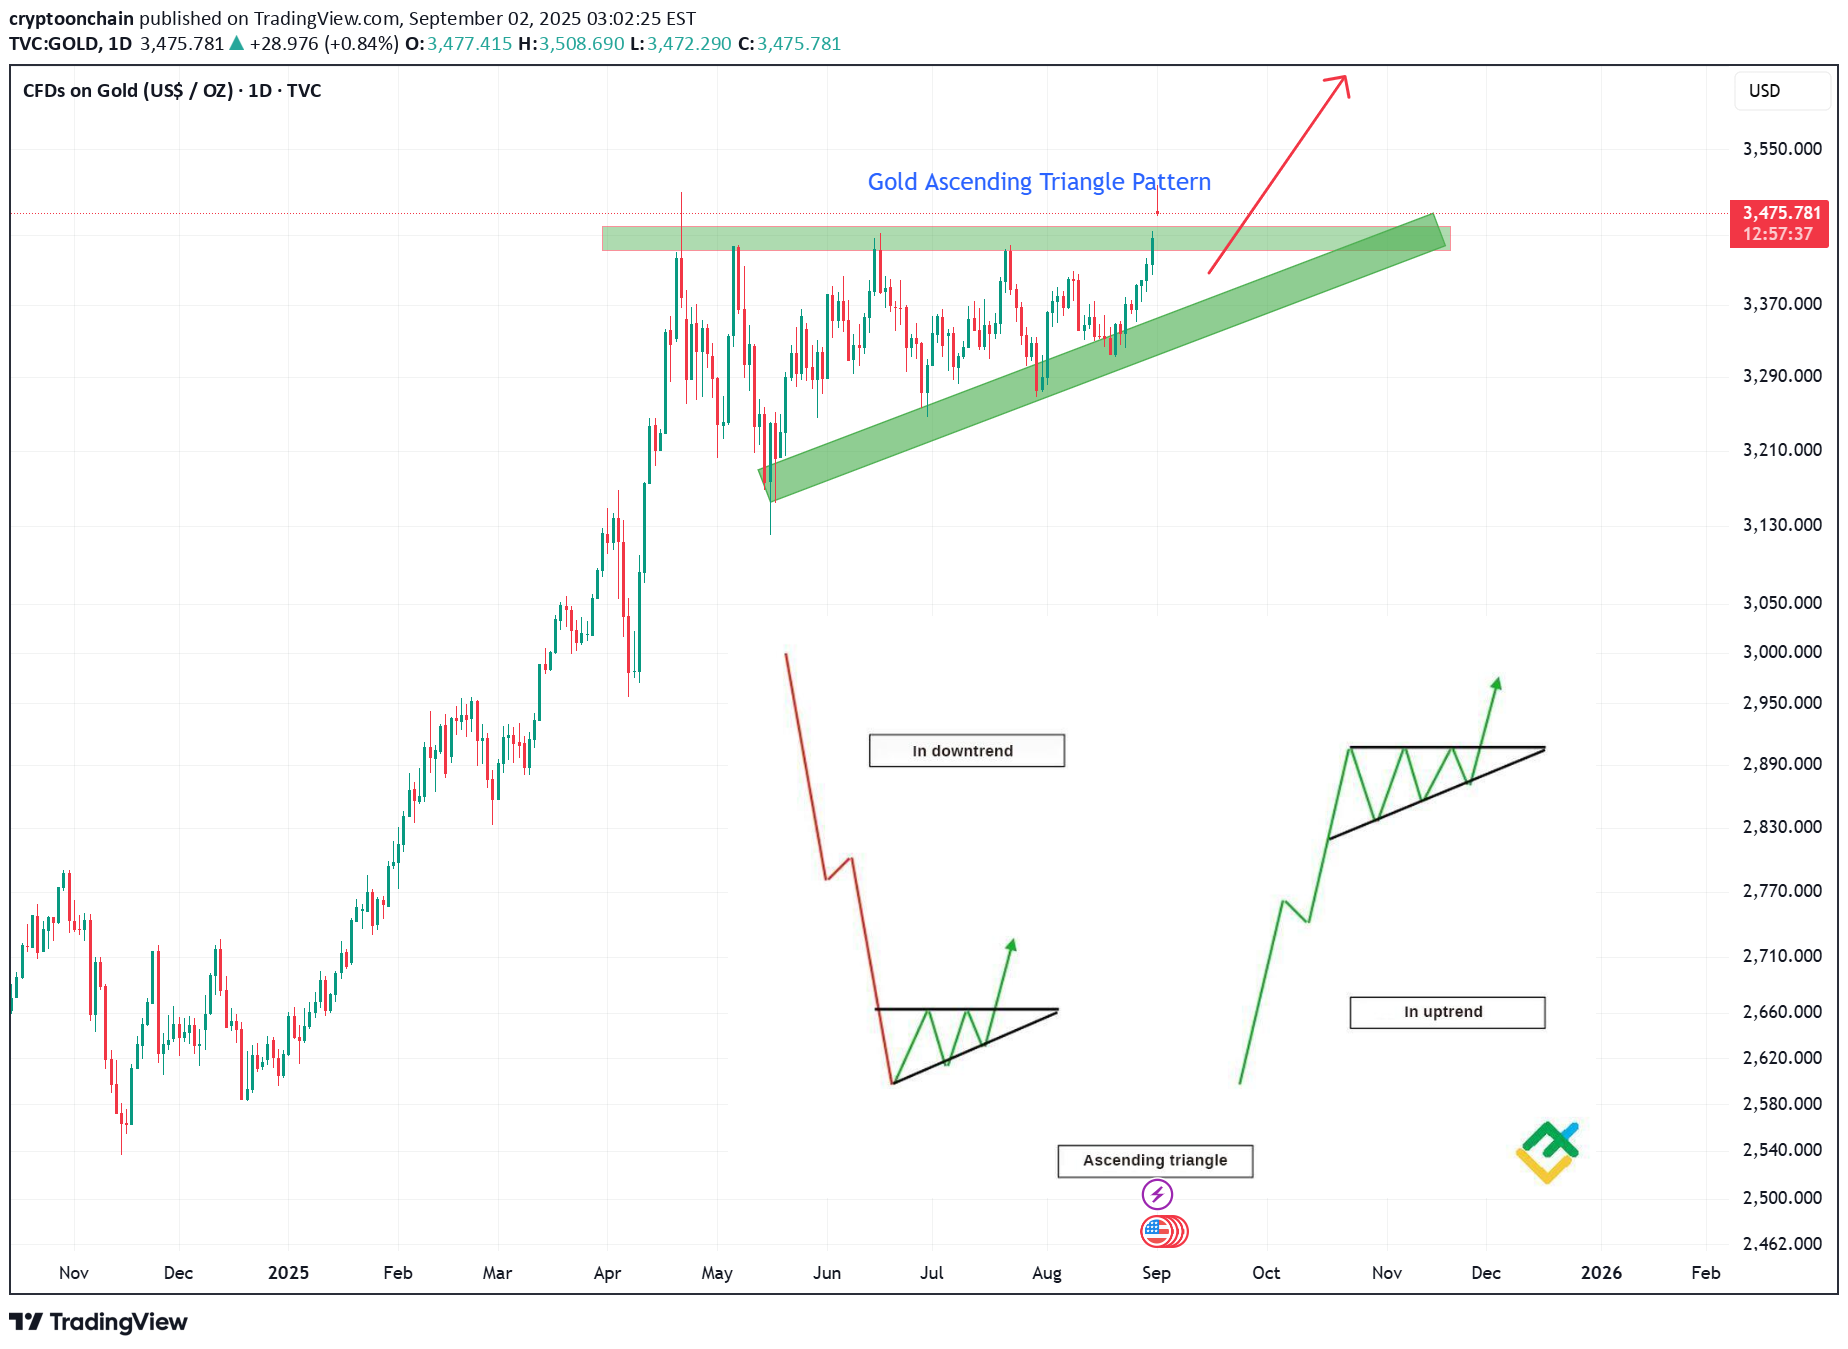
Gold is painting a compelling technical picture on the daily chart, consolidating within a clear Ascending Triangle pattern—a classic continuation signal that often breaks to the upside. Pattern Structure: Support: A rising trendline connecting higher lows, indicating consistent buying pressure at increasingly elevated levels. Resistance: A horizontal barrier near the $3,477 - $3,550 zone, which has been tested multiple times, confirming its significance. Key Levels: Breakout Target: A successful breakout above $3,550 could trigger a measured move projection targeting $3,800+, based on the pattern's height. Support to Hold: The pattern remains valid as long as price holds above the ascending support. A break below could invalidate the setup and signal a deeper pullback. Volume & Momentum: The formation of higher lows suggests accumulation and weakening selling pressure at key resistance. A breakout accompanied by rising volume would strongly confirm bullish momentum. Macro Context: This pattern forms within a larger uptrend, reinforcing its reliability. Gold's role as a safe-haven asset amid global economic uncertainty continues to underpin demand. Trading Outlook: Bulls should await a decisive close above $3,550 to enter, targeting new all-time highs. Bears need a break below the ascending trendline to regain control.
cryptoonchain
Ethereum Approaching Price ATH While Transaction Count Hits Reco
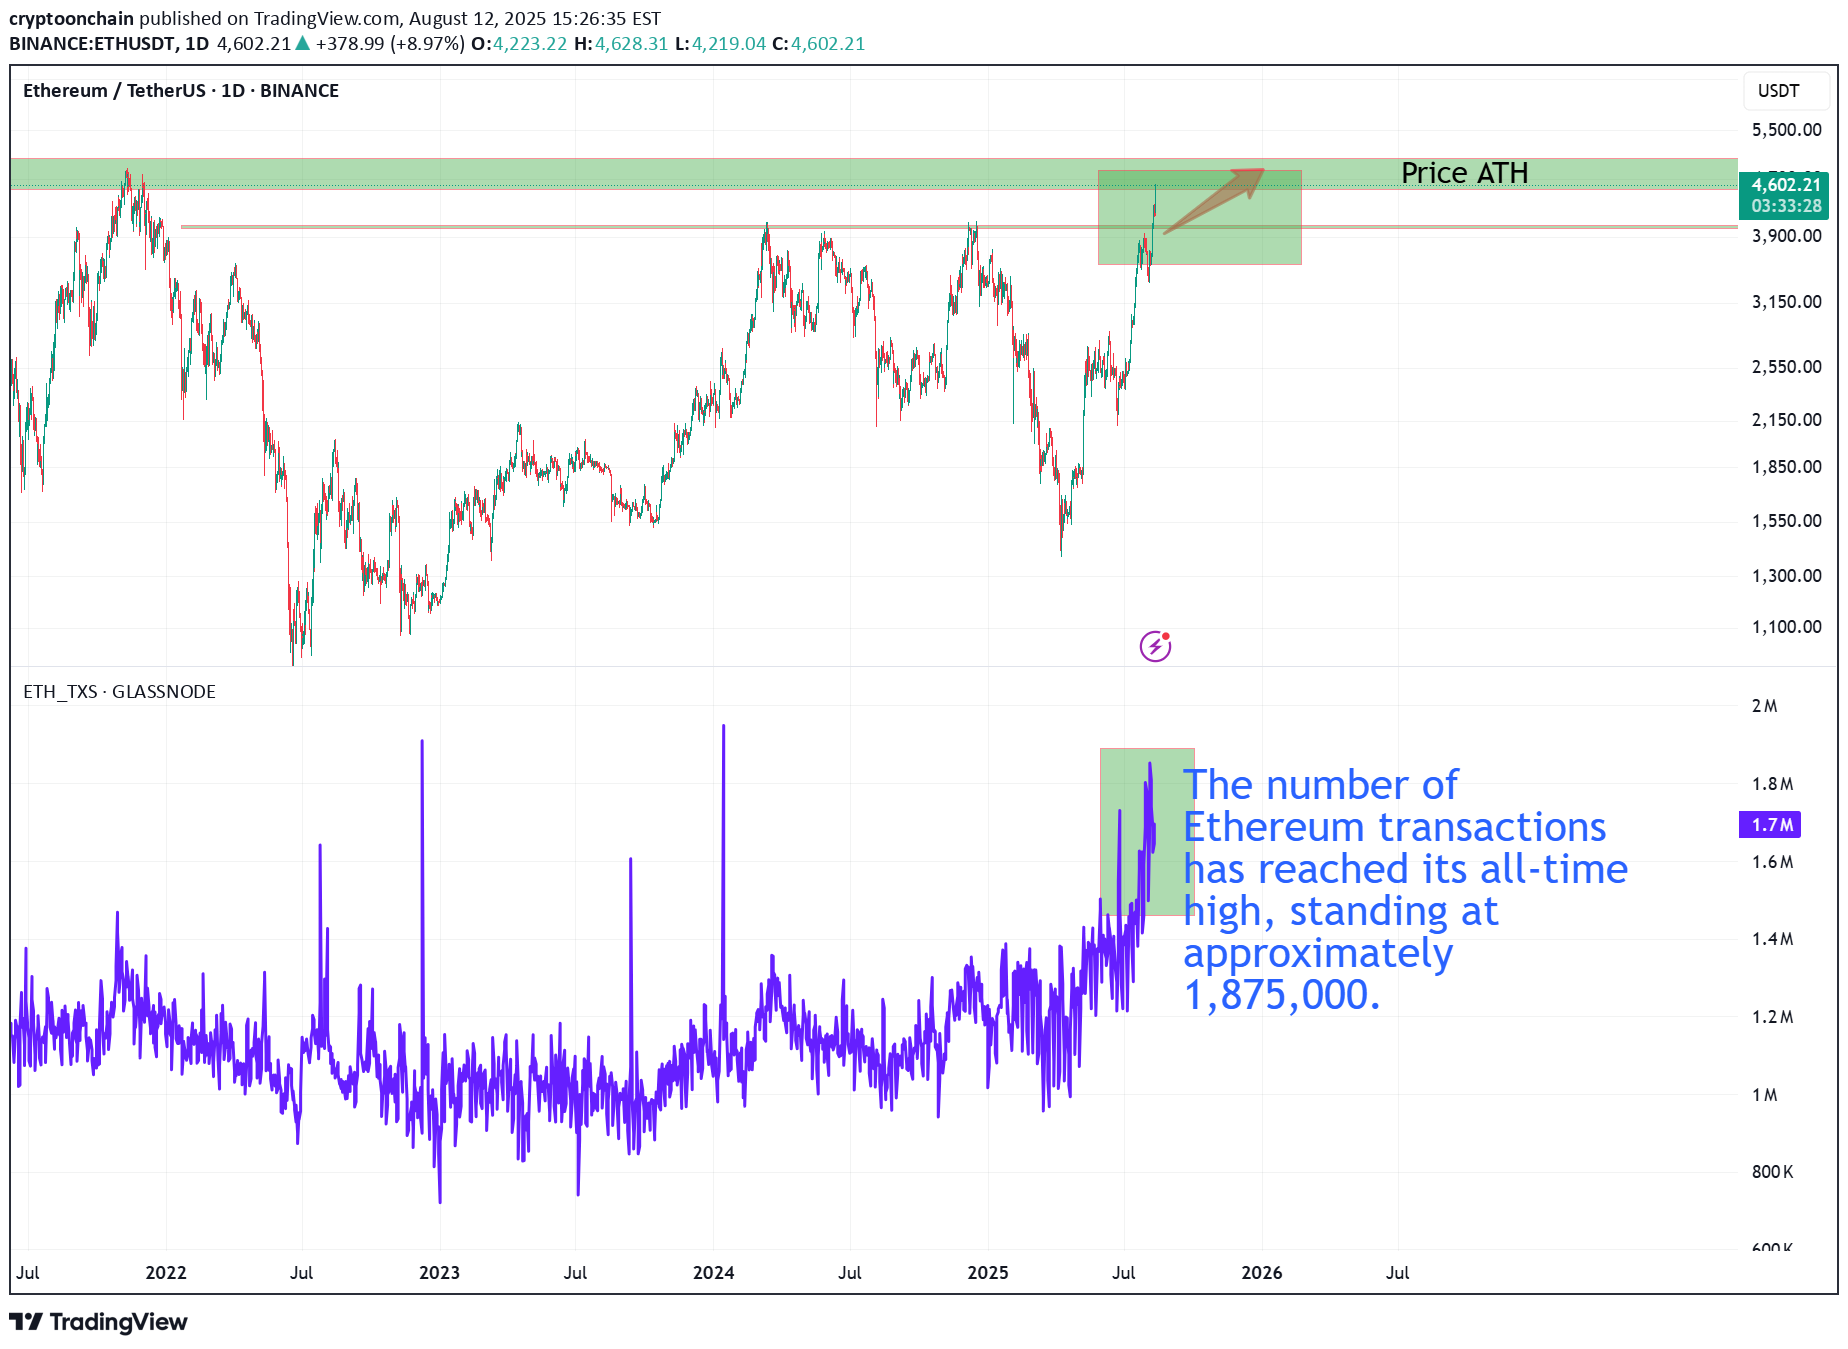
Ethereum’s network activity has surged to unprecedented levels, with daily transactions reaching an all-time high of approximately 1.875 million. This parabolic rise in on-chain activity reflects heightened user engagement and growing demand for block space. On the price chart, ETH is now testing the critical resistance zone just below its historical all-time high (~$4,750). This is a confluence point — price is approaching a major supply area, while network fundamentals show peak activity. Key points to watch: A breakout above $4,750 with sustained transaction momentum could ignite a price discovery phase. If sellers defend the ATH zone, short-term consolidation or a pullback toward $3,950 support is likely. On-chain highs combined with price stagnation could indicate network overextension, warranting caution. In summary, Ethereum is sitting at a junction where record network usage meets historical price resistance — the next few sessions could determine whether we see a decisive breakout or a rejection.
cryptoonchain
Remarkable Growth in TRON (TRX/USDT) Stability and Price – Suppo

In recent months, the TRON (TRX) network and price have witnessed remarkable stability and growth. According to a recent analysis by CryptoOnchain published on the CryptoQuant platform, one of the main indicators of this stability has been the unprecedented consistency in daily block production on the TRON network. The report highlights that the daily block count has remained nearly constant (around 28,500 blocks), mainly attributed to recent technical improvements, an increase in network energy capacity, and the implementation of a dynamic energy model. On the provided Renko chart, TRX’s positive price momentum is also clear. Following the recovery from the0.20–0.22 support zone and strengthening bullish momentum (as indicated by the histogram indicator), a breakout above the $0.3150 resistance could accelerate the upward trend. Technical & Fundamental Context: Based on the CryptoOnchain analysis on CryptoQuant: The network’s energy capacity has doubled and a dynamic energy model has been implemented, ensuring operational stability even alongside record transaction volumes. Despite high on-chain activity, the block production rate has stayed stable, and strong fundamentals supported by security upgrades continue to strengthen both the network and price. Technically, reclaiming key supports, holding above the Ichimoku cloud, and positive signals from the IMACD_LB indicator all confirm the strength of the trend. Summary: The synergy between strong fundamentals (as highlighted in the CryptoOnchain/CryptoQuant analysis) and the chart’s technical structure creates a positive outlook for TRX. If the price holds above the 0.22–0.25 support and overcomes the $0.3150 resistance, higher targets become more likely.
cryptoonchain
Remarkable Growth in TRON (TRX/USDT) Stability and Price – Suppo
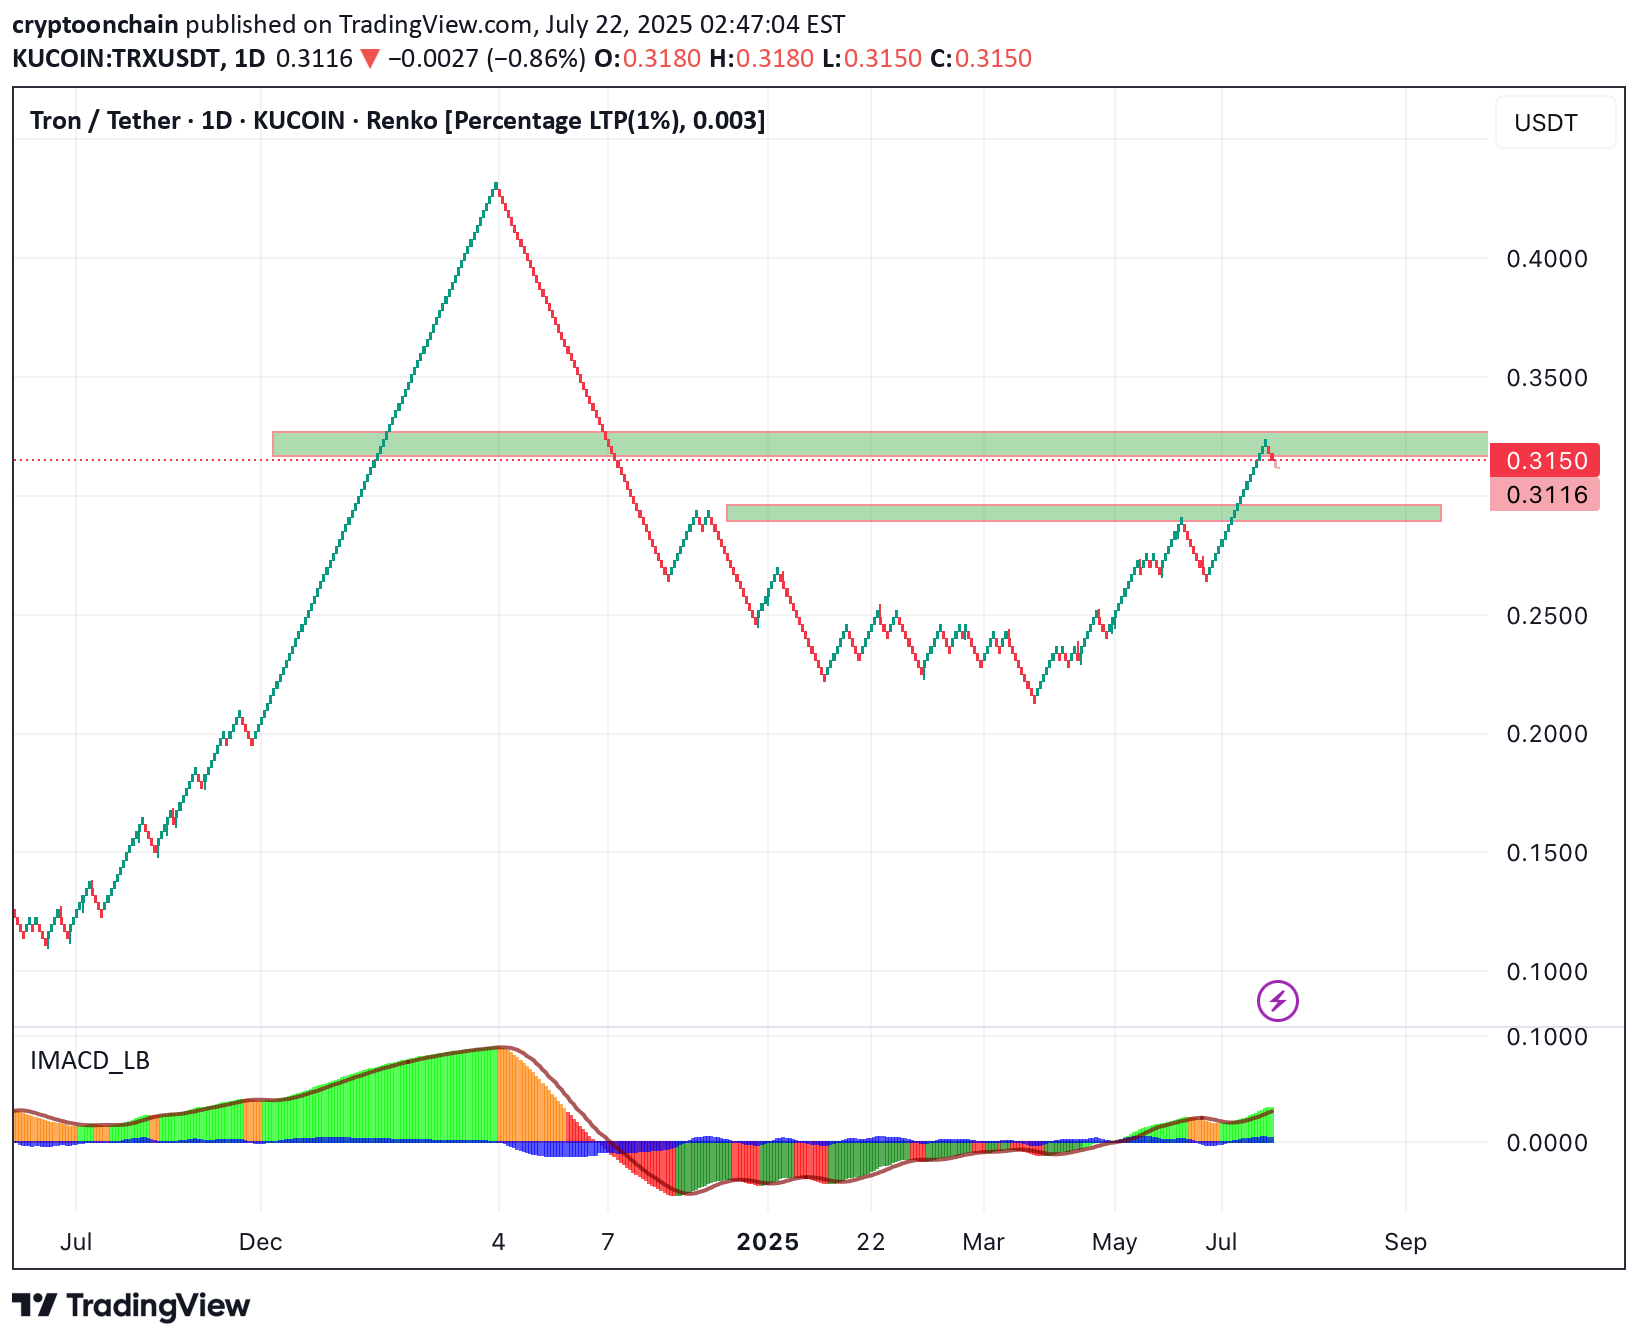
In recent months, the TRON (TRX) network and price have witnessed remarkable stability and growth. According to a recent analysis by CryptoOnchain published on the CryptoQuant platform, one of the main indicators of this stability has been the unprecedented consistency in daily block production on the TRON network. The report highlights that the daily block count has remained nearly constant (around 28,500 blocks), mainly attributed to recent technical improvements, an increase in network energy capacity, and the implementation of a dynamic energy model. On the provided Renko chart, TRX’s positive price momentum is also clear. Following the recovery from the 0.20–0.22 support zone and strengthening bullish momentum (as indicated by the histogram indicator), a breakout above the $0.3150 resistance could accelerate the upward trend. Technical & Fundamental Context: Based on the CryptoOnchain analysis on CryptoQuant: The network’s energy capacity has doubled and a dynamic energy model has been implemented, ensuring operational stability even alongside record transaction volumes. Despite high on-chain activity, the block production rate has stayed stable, and strong fundamentals supported by security upgrades continue to strengthen both the network and price. Technically, reclaiming key supports, holding above the Ichimoku cloud, and positive signals from the IMACD_LB indicator all confirm the strength of the trend. Summary: The synergy between strong fundamentals (as highlighted in the CryptoOnchain/CryptoQuant analysis) and the chart’s technical structure creates a positive outlook for TRX. If the price holds above the 0.22–0.25 support and overcomes the $0.3150 resistance, higher targets become more likely.
cryptoonchain
Shiba Inu (SHIBUSD) Weekly Analysis – Positive Divergence
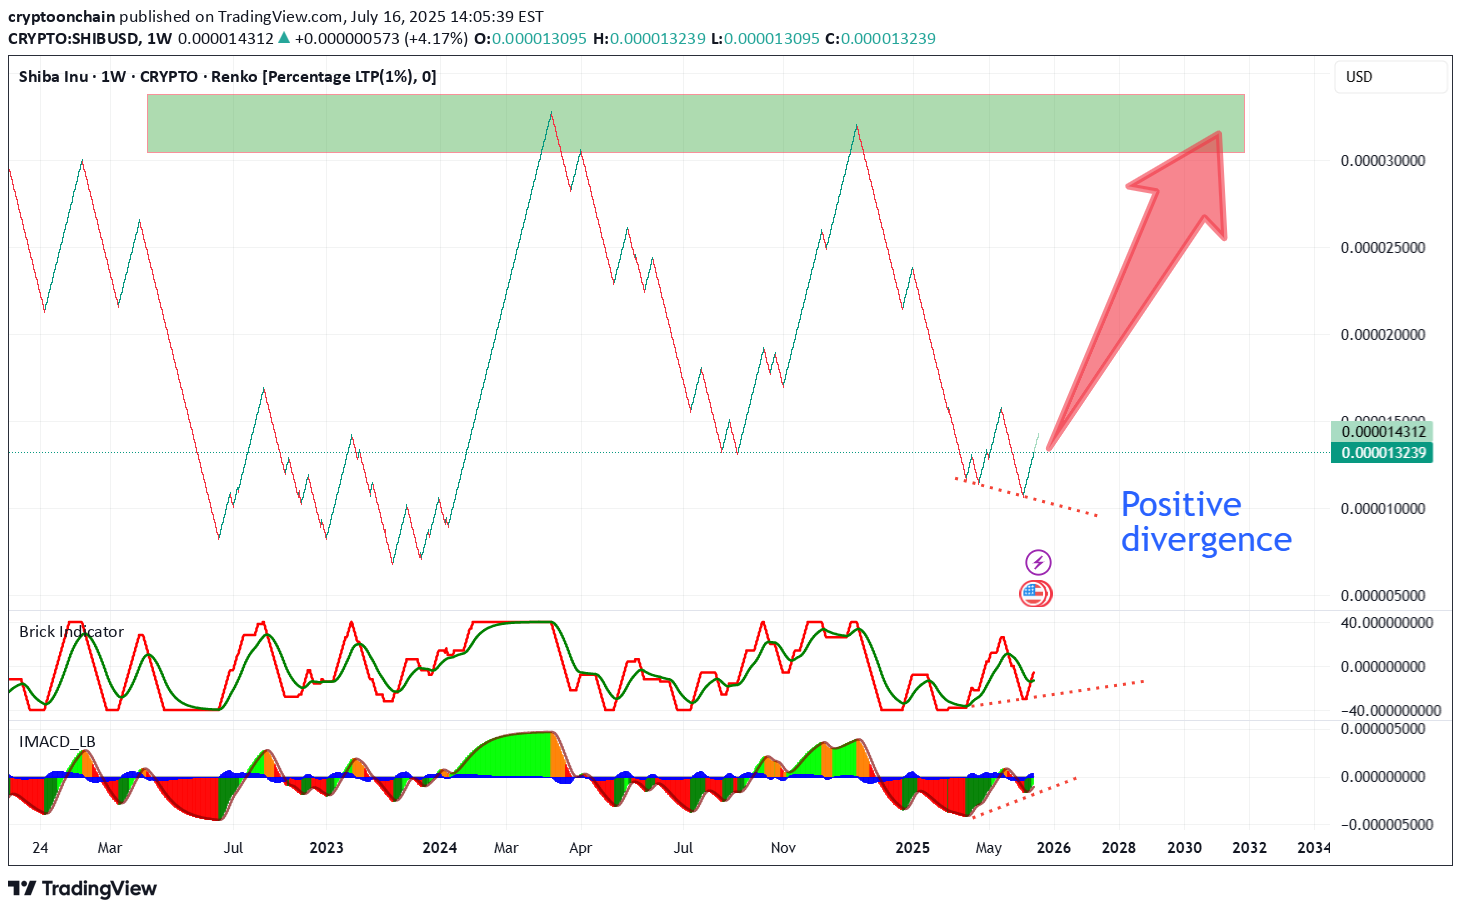
Positive divergence detected! On the weekly SHIBUSD chart (Renko, %), we see a clear positive divergence between price action and both the Brick Indicator and MACD. While the price printed new lows, momentum indicators are forming higher lows, suggesting fading bearish pressure and a possible reversal ahead. Key Resistance / Target: The main resistance zone is at 0.000032 USD (highlighted in green on the chart). This level marks a strong supply area from previous cycles and serves as a potential upside target if the bullish momentum continues. Summary: Positive divergence on momentum indicators is confirmed. Bearish trend is losing strength; reversal potential is increasing. Next key target is the 0.000032 USD resistance area. ⚠️ This analysis is for informational purposes only and is not financial advice. Always DYOR before trading.
cryptoonchain
TRON Technical & On-chain Analysis: Is a Breakout Imminent?
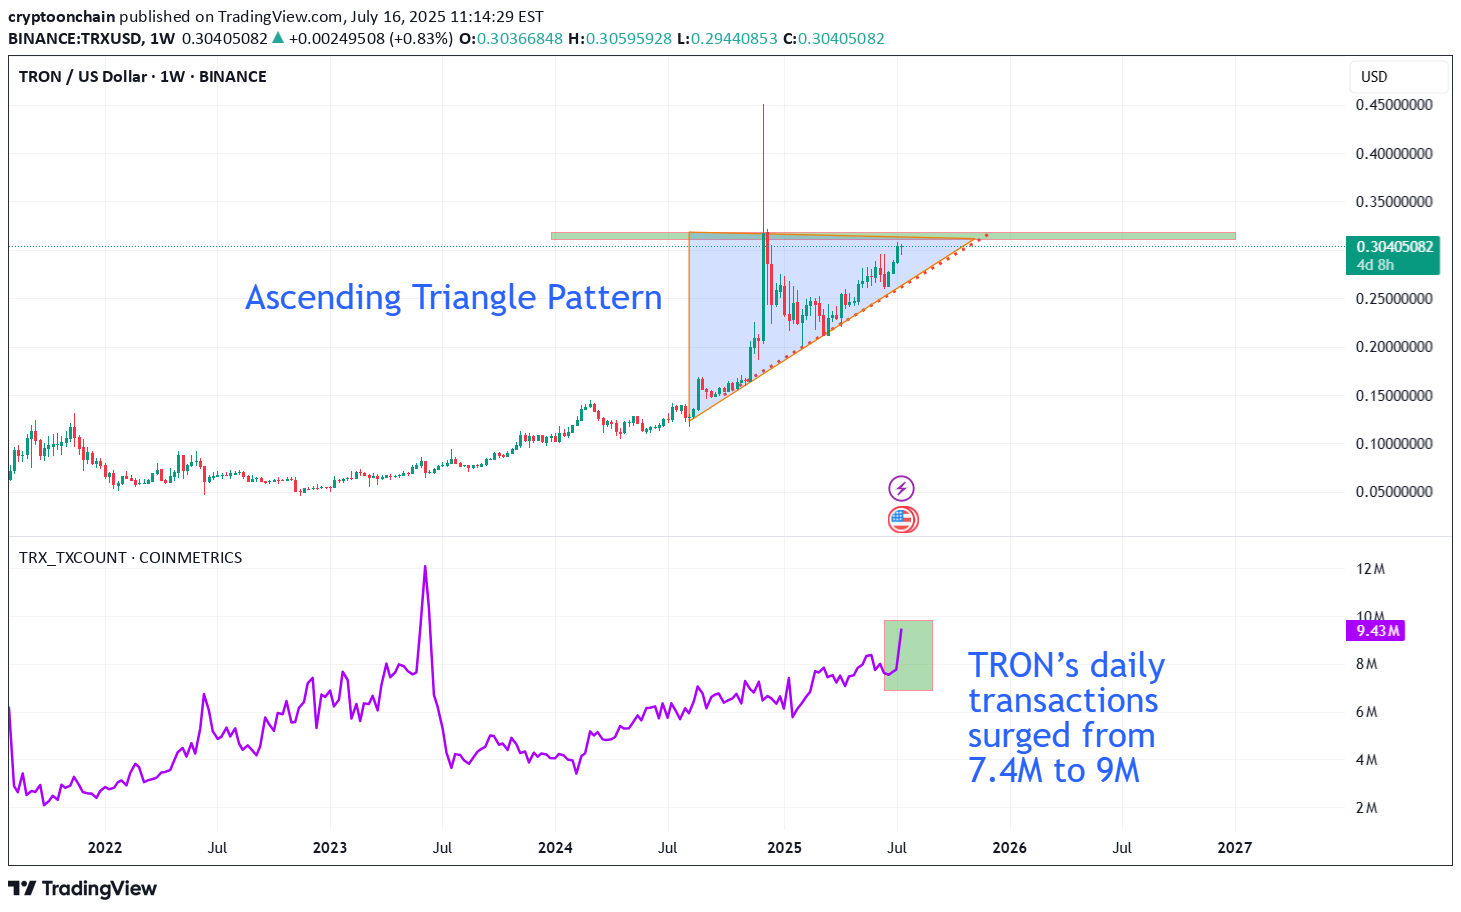
The TRX/USDT weekly chart is showing TRON testing a major resistance zone near $0.32, while forming a classic ascending triangle pattern just below this level. This bullish structure typically signals increasing momentum from buyers and raises the potential for a breakout above resistance. What makes the bullish case even more compelling is the strong on-chain activity. According to Cryptoonchain (using CryptoQuant data), daily transactions on the TRON network have surged above 9 million, with the 100-day moving average also hovering close to its all-time highs. This significant growth reflects not only rising user engagement but also a sustained demand for network utility. Historically, sharp increases in on-chain activity have often fueled major price moves, especially when combined with clear bullish technical charts. If TRX can achieve a decisive breakout above the $0.32 resistance with meaningful trading volume, a new bullish phase could be triggered in the medium term. However, traders should be cautious about the potential for fake-outs or temporary pullbacks after the first breakout. Summary: A combination of the ascending triangle formation and record-high on-chain activity (as reported by Cryptoonchain with CryptoQuant data) noticeably increases the odds of a successful breakout for TRON. Still, true confirmation relies on a clear, sustained close above the $0.32 level.
cryptoonchain
Binance Holds 25% of Exchange ETH: Smart Accumulation?
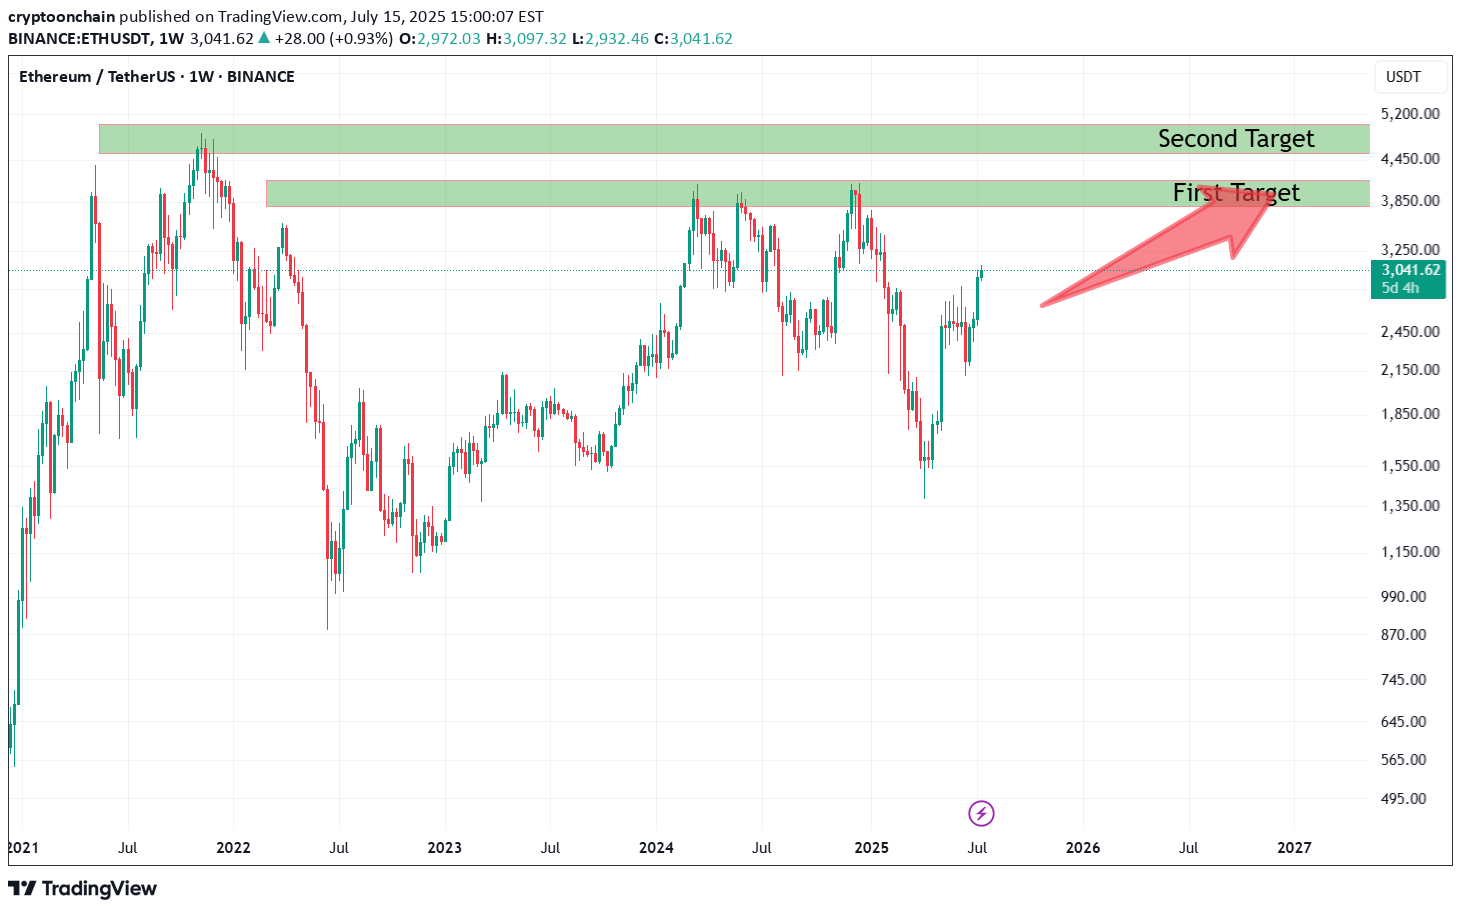
According to cryptoonchain’s analysis of on-chain data from CryptoQuant, Binance now holds about 25% of the total Ethereum reserves across all exchanges. This significant figure could be a sign of smart accumulation by major market participants. Notably, Binance’s rising share has occurred while overall ETH reserves on exchanges have remained stable. In a situation where Ethereum’s price is still below its all-time highs—even as Bitcoin has set new records—this accumulation on Binance may signal that large investors are entering and expecting future price growth. On the weekly chart, Ethereum is showing signs of strength and a possible continuation of its upward trend. If buyers maintain their momentum, the first target lies in the 3,900–4,200 zone, with the second target in the 4,850–4,950 range—close to previous all-time highs.
Disclaimer
Any content and materials included in Sahmeto's website and official communication channels are a compilation of personal opinions and analyses and are not binding. They do not constitute any recommendation for buying, selling, entering or exiting the stock market and cryptocurrency market. Also, all news and analyses included in the website and channels are merely republished information from official and unofficial domestic and foreign sources, and it is obvious that users of the said content are responsible for following up and ensuring the authenticity and accuracy of the materials. Therefore, while disclaiming responsibility, it is declared that the responsibility for any decision-making, action, and potential profit and loss in the capital market and cryptocurrency market lies with the trader.