Technical analysis by cryptoonchain about Symbol TRX: Buy recommendation (7/16/2025)

cryptoonchain
TRON Technical & On-chain Analysis: Is a Breakout Imminent?
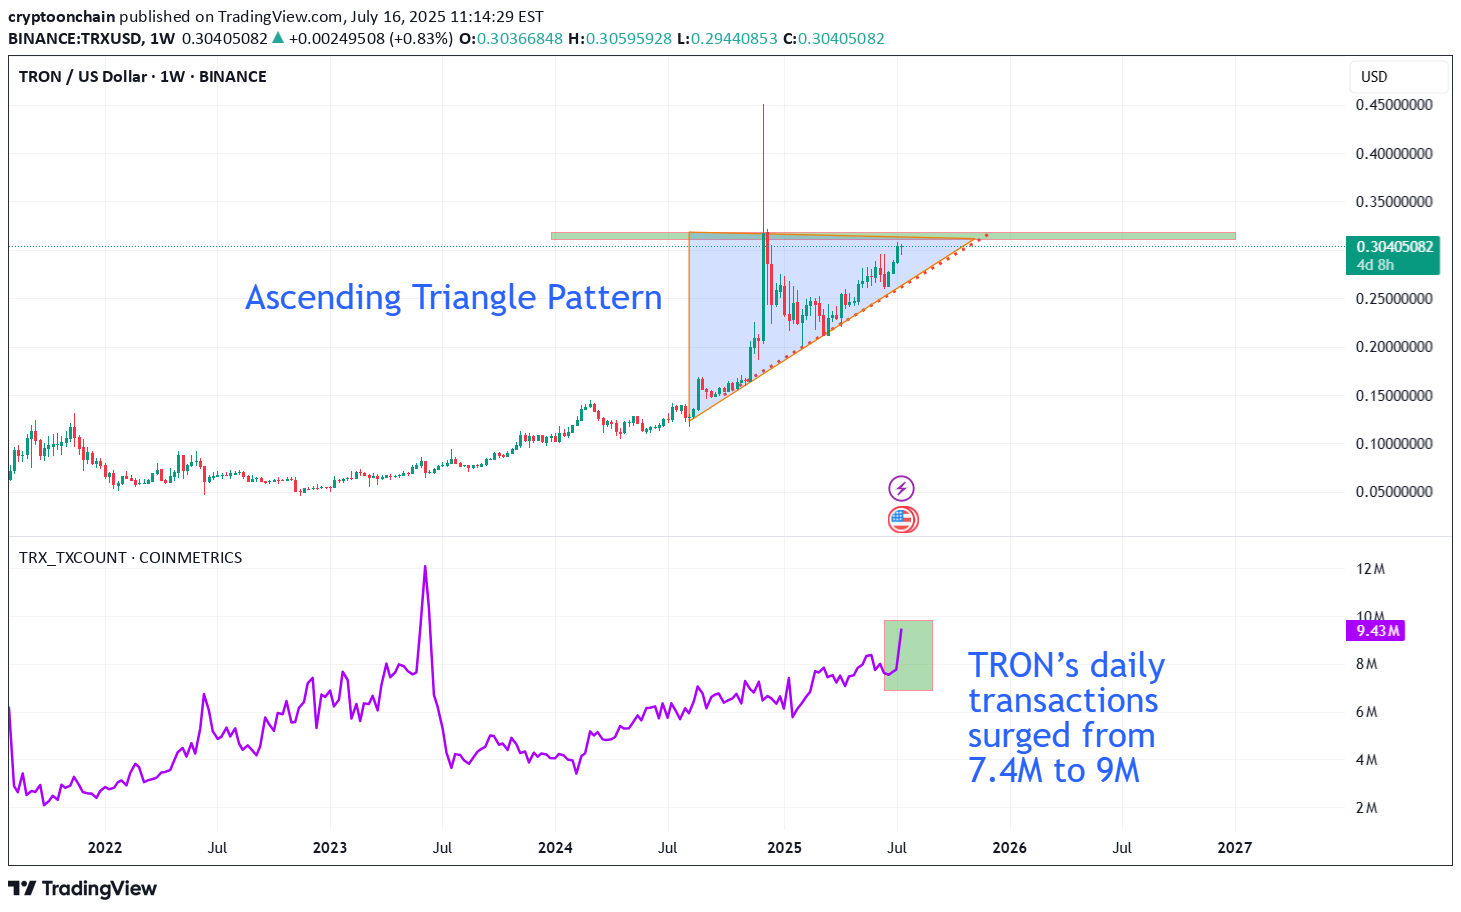
The TRX/USDT weekly chart is showing TRON testing a major resistance zone near $0.32, while forming a classic ascending triangle pattern just below this level. This bullish structure typically signals increasing momentum from buyers and raises the potential for a breakout above resistance. What makes the bullish case even more compelling is the strong on-chain activity. According to Cryptoonchain (using CryptoQuant data), daily transactions on the TRON network have surged above 9 million, with the 100-day moving average also hovering close to its all-time highs. This significant growth reflects not only rising user engagement but also a sustained demand for network utility. Historically, sharp increases in on-chain activity have often fueled major price moves, especially when combined with clear bullish technical charts. If TRX can achieve a decisive breakout above the $0.32 resistance with meaningful trading volume, a new bullish phase could be triggered in the medium term. However, traders should be cautious about the potential for fake-outs or temporary pullbacks after the first breakout. Summary: A combination of the ascending triangle formation and record-high on-chain activity (as reported by Cryptoonchain with CryptoQuant data) noticeably increases the odds of a successful breakout for TRON. Still, true confirmation relies on a clear, sustained close above the $0.32 level.