
crypto_vulture_signals
@t_crypto_vulture_signals
What symbols does the trader recommend buying?
Purchase History
پیام های تریدر
Filter
Signal Type

crypto_vulture_signals
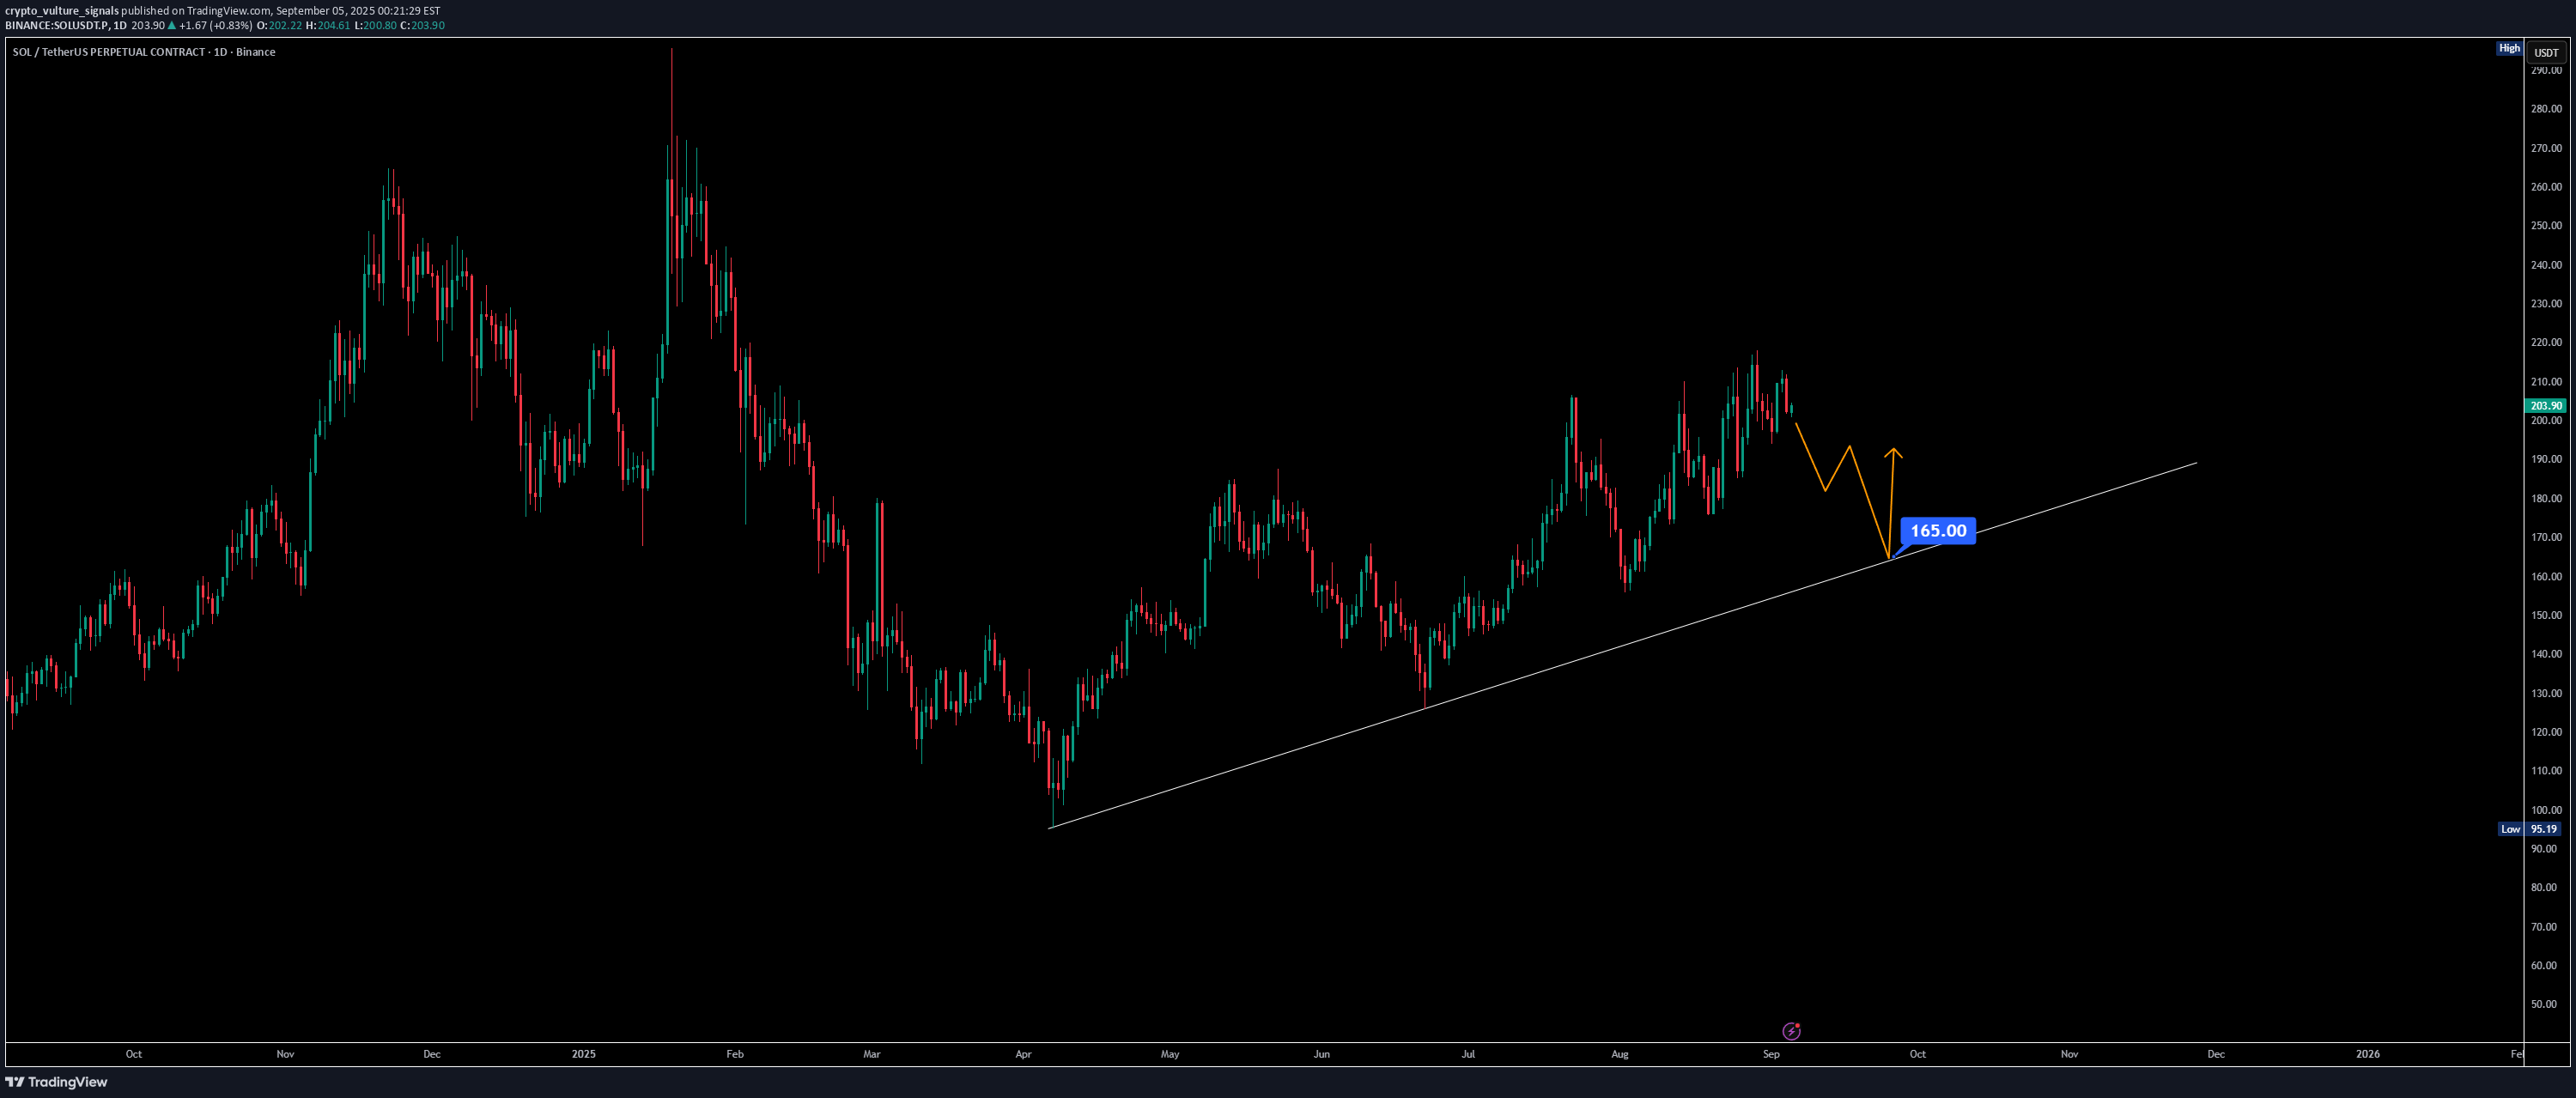
If we look at Solana on the daily timeframe, the structure has been holding higher lows consistently, which shows strength. But the reality is that liquidity from the retail side is drying up while Bitcoin dominance keeps climbing. On top of that, today’s U.S. unemployment data will be a key driver. A stronger report could put pressure on the market and trigger a correction, while weaker numbers may shift sentiment but won’t erase the need for a healthy pullback. Right now, both MACD and RSI, along with Stochastic RSI, are hinting at momentum exhaustion. Volume is steadily declining, which usually signals an upcoming correction phase. The critical zone to watch is around $165. If Solana holds this trendline support, the structure remains intact. But if this level breaks, the move could accelerate toward the $100 region — a deeper, more volatile correction. Overall, I’m expecting September to deliver that correction. It’s not a bearish outlook but rather a needed reset. Without such a shakeout, the market won’t have the fuel to retest previous all-time highs or push into new ones. A correction here is not weakness — it’s preparation for the next strong rally.

crypto_vulture_signals
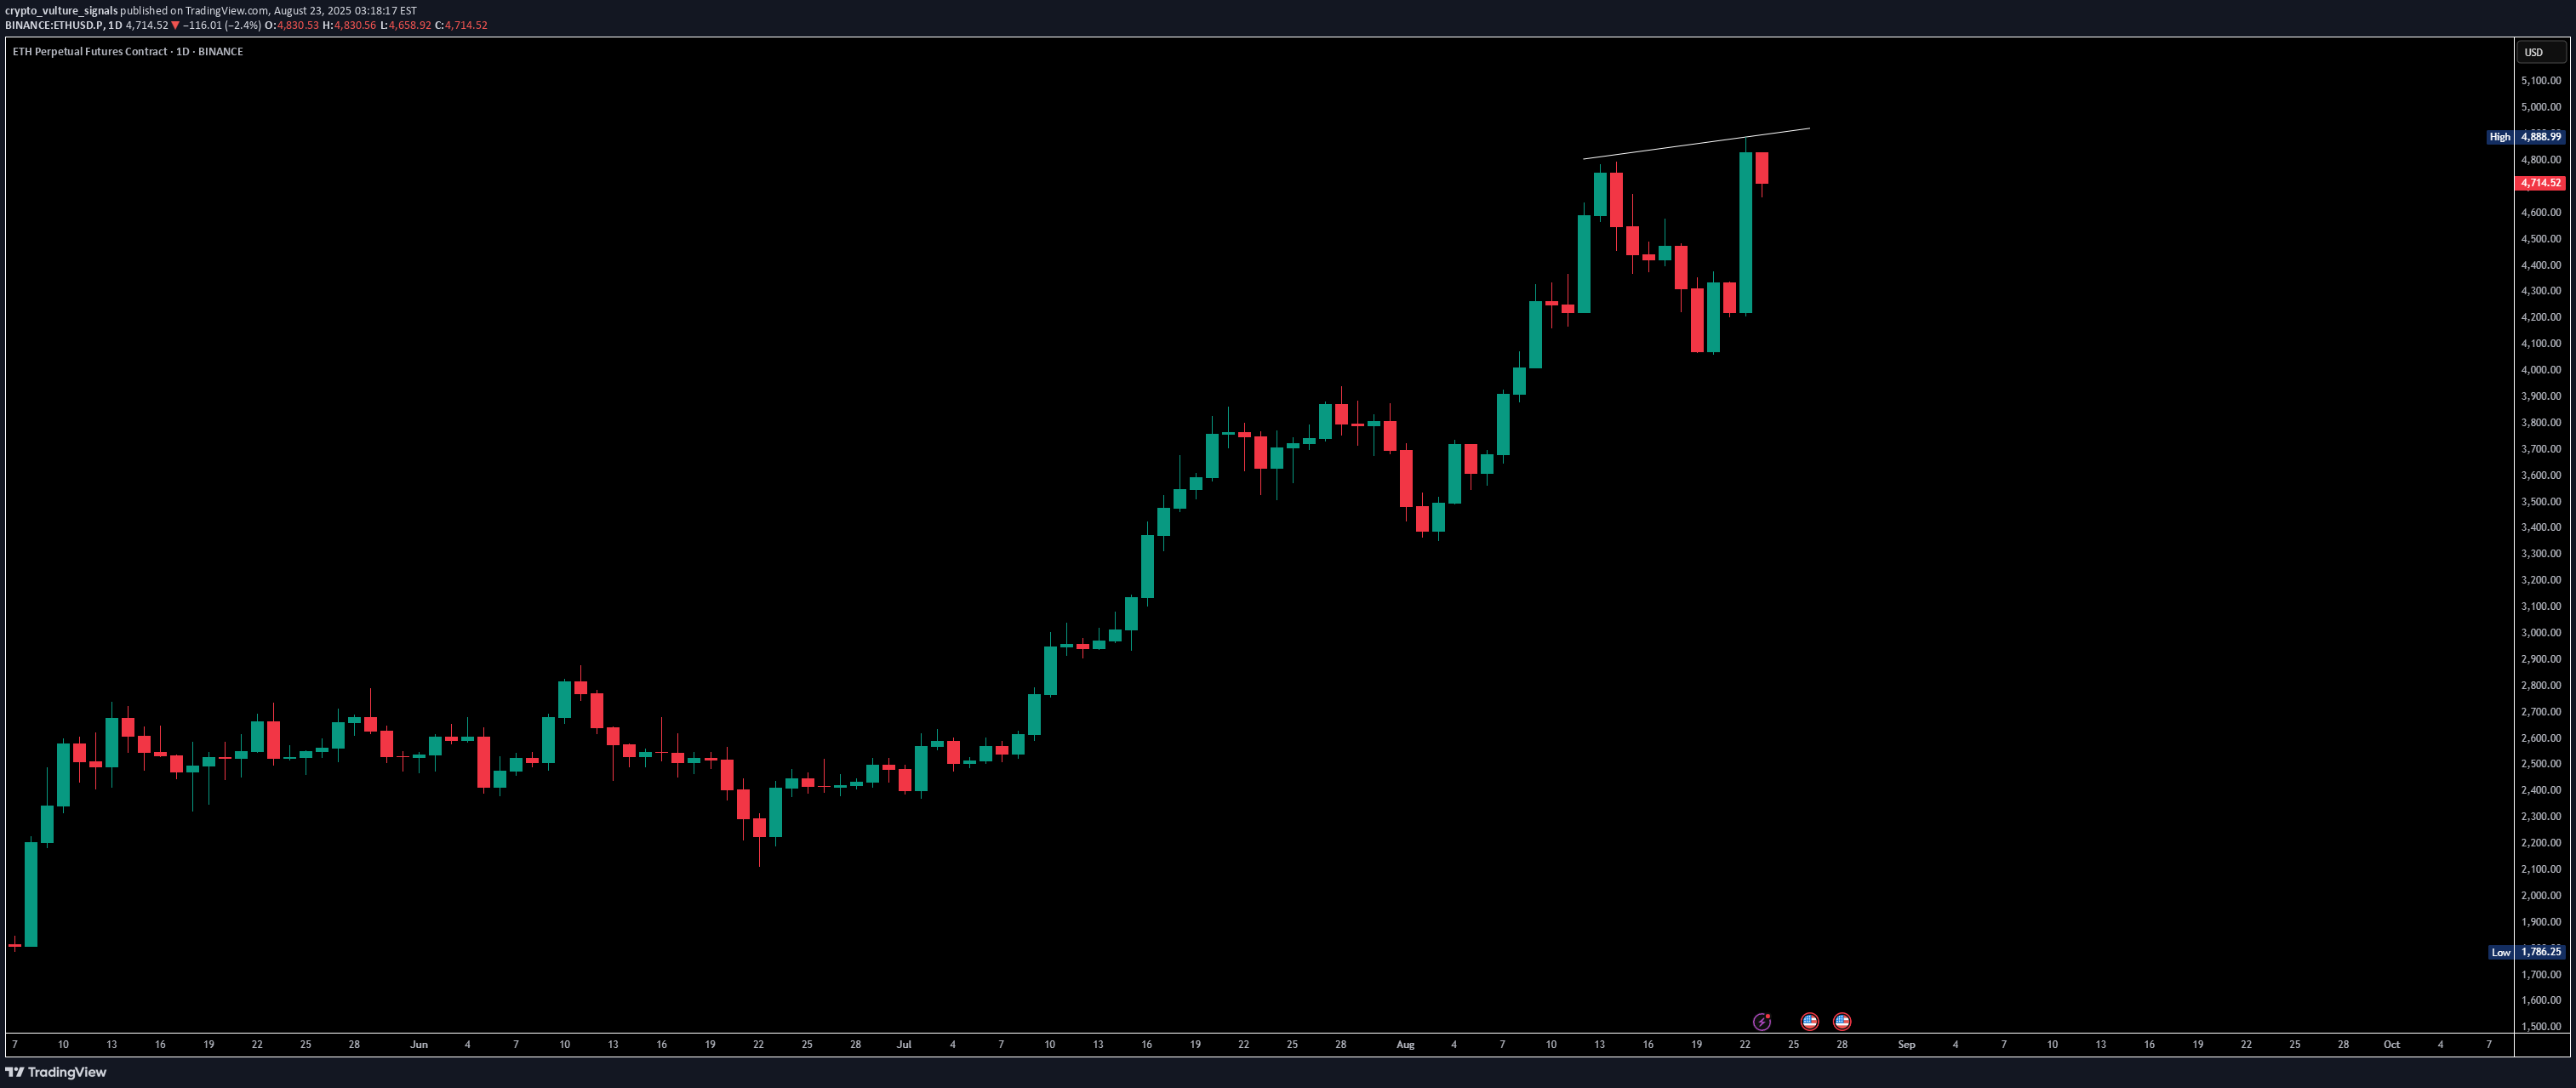
Looking at ETH on the daily timeframe, price action is pushing higher highs, but RSI isn’t fully aligned — it’s only forming a higher low. That usually tells us this move could just be a pullback rather than a strong bullish divergence. ETH already retested the May 2021 levels, and from here a correction toward $4,450 seems likely. If it holds and rebounds there, momentum can continue, but if it fails, we should be ready for deeper downside. The key support to watch is $4,000 — losing that would open doors for another correction. On the other side, the stochastic RSI is near the bottom, which suggests a possible bounce. But weekends often come with fake pumps and dumps, so patience is important. Monday evening or Tuesday morning looks like a better window to see whether ETH attempts a proper correction or not.

crypto_vulture_signals

NEAR USDT Double Top Pattern in Play On the daily chart, NEAR/USDT has formed a clear double top pattern. Alongside this, a bearish divergence has also developed, suggesting weakness in upward momentum. At the moment, price is sitting near the key support zone around 2.3. Support at 2.3 and the Bounce Possibility If NEAR manages to hold this 2.3 support, a bounce could follow toward the 2.85 resistance area. This zone will act as a critical decision point. A rejection here would likely confirm the double top pattern and bring back selling pressure. Break of 2.3 Could Lead to 1.8 Retest On the flip side, if the 2.3 support fails, the double top comes into full effect, and NEAR could slide further down to the 1.8 area, where it has found strong support in the past. Until then, the focus remains on whether the current bounce can push through 2.85 or not.

crypto_vulture_signals
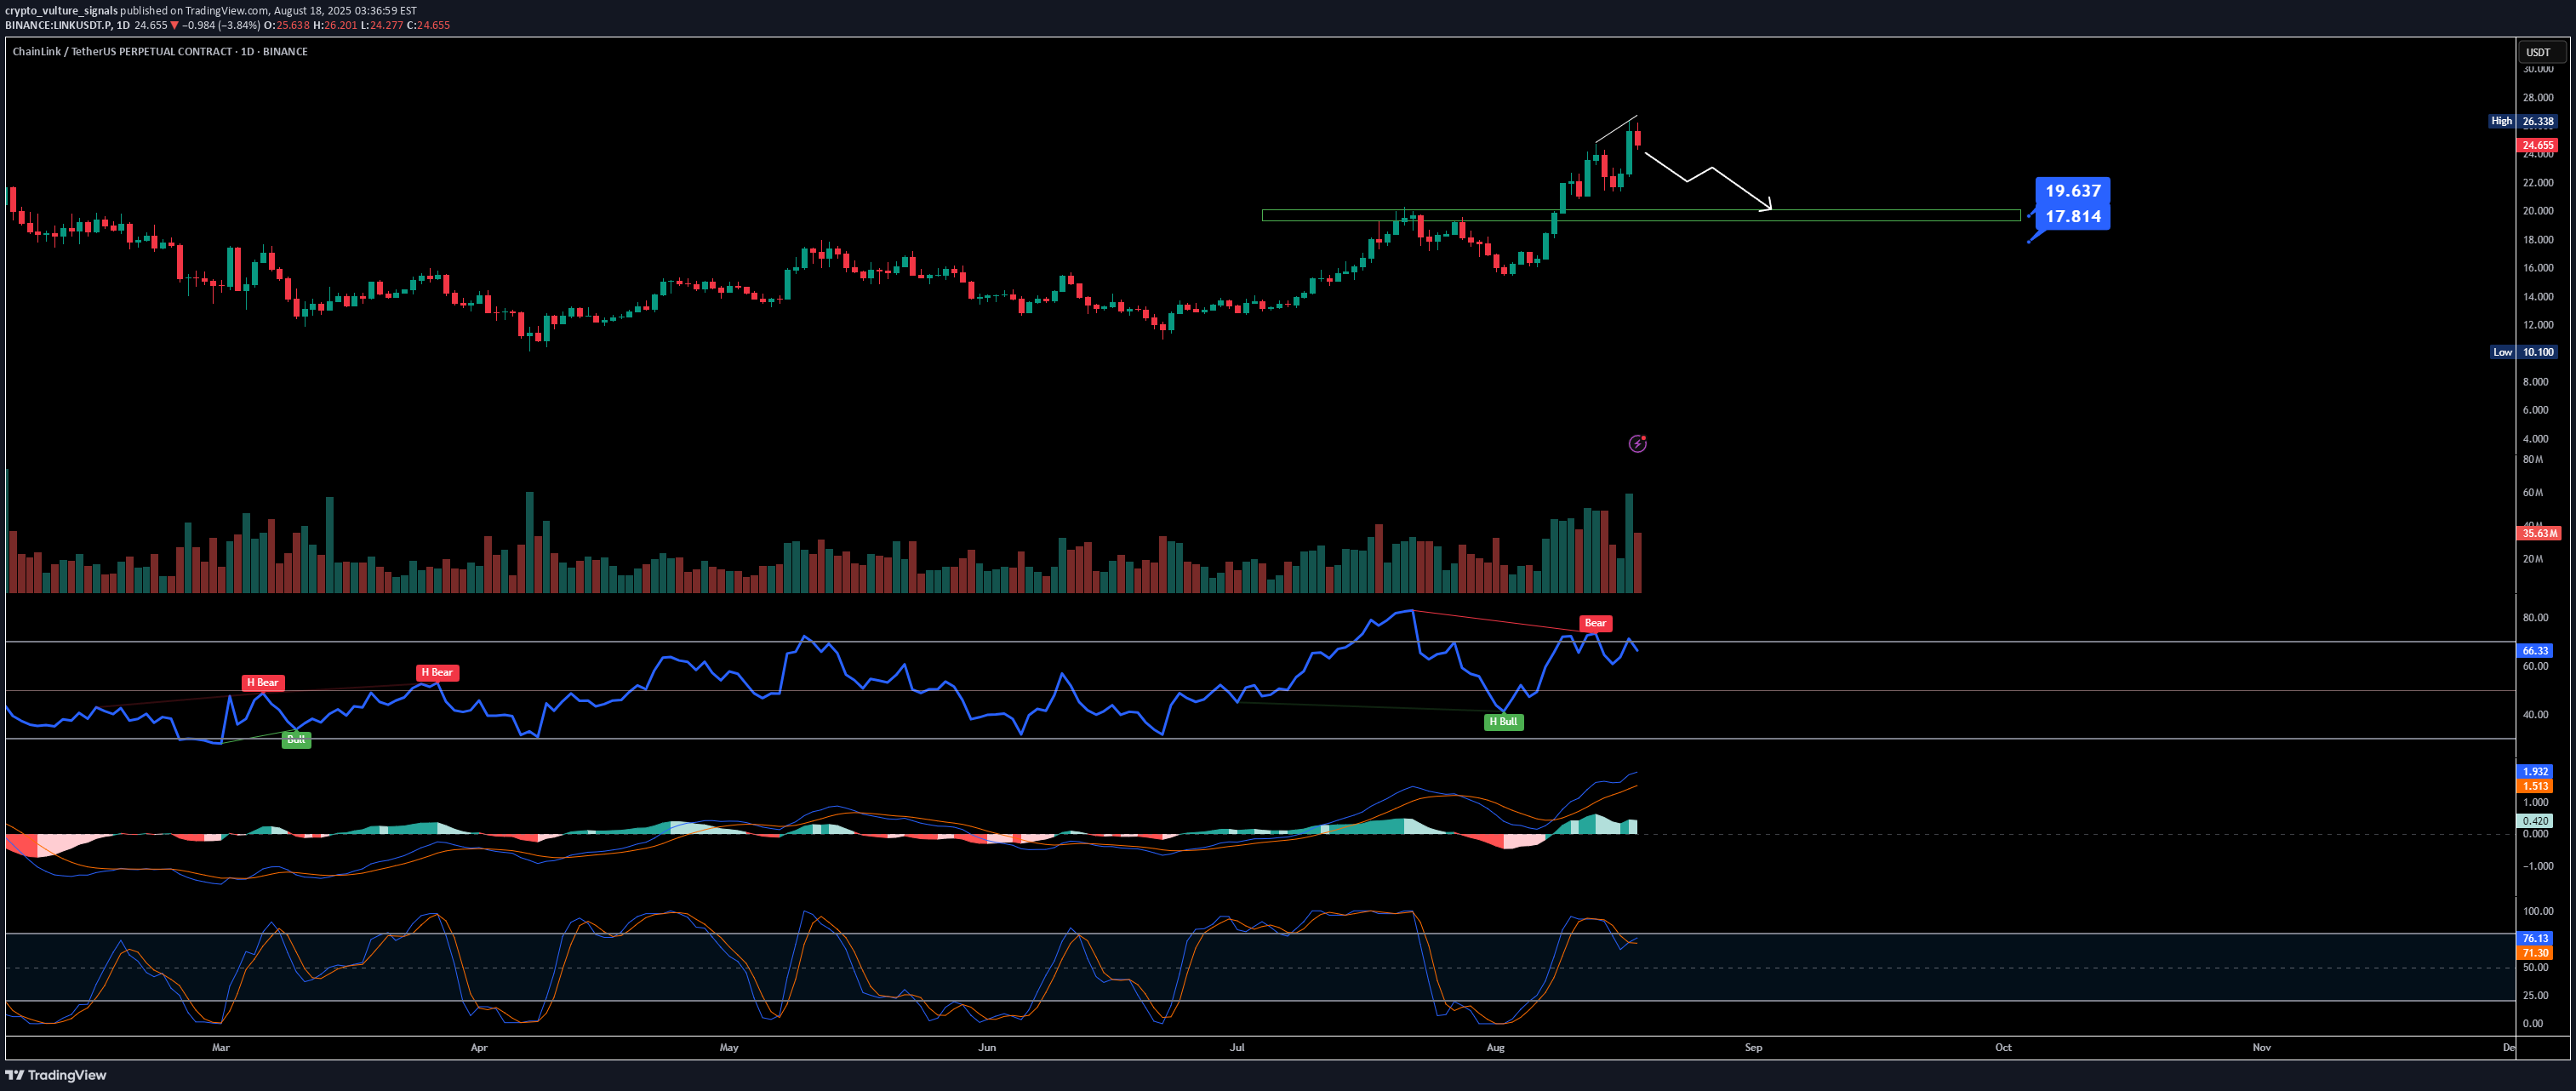
If we look closely at LINK/USDT right now, the charts are flashing a clear bearish divergence. This setup usually acts as a warning sign, and the price action is already hinting at a potential correction. The first important zone to watch is around 19.5 – it lines up with the golden pocket as well as a previous resistance that can now flip into support. But if Bitcoin dominance continues climbing, there’s a risk of LINK moving deeper into correction territory. In that case, the 17.5 zone becomes a realistic target, and a move into that range would confirm a stronger bearish dump. So the play here is simple: keep an eye on 19.5 as the first defense zone. If it holds, bulls might get some relief. If it breaks, prepare for the possibility of LINK sliding down toward 17.5.

crypto_vulture_signals
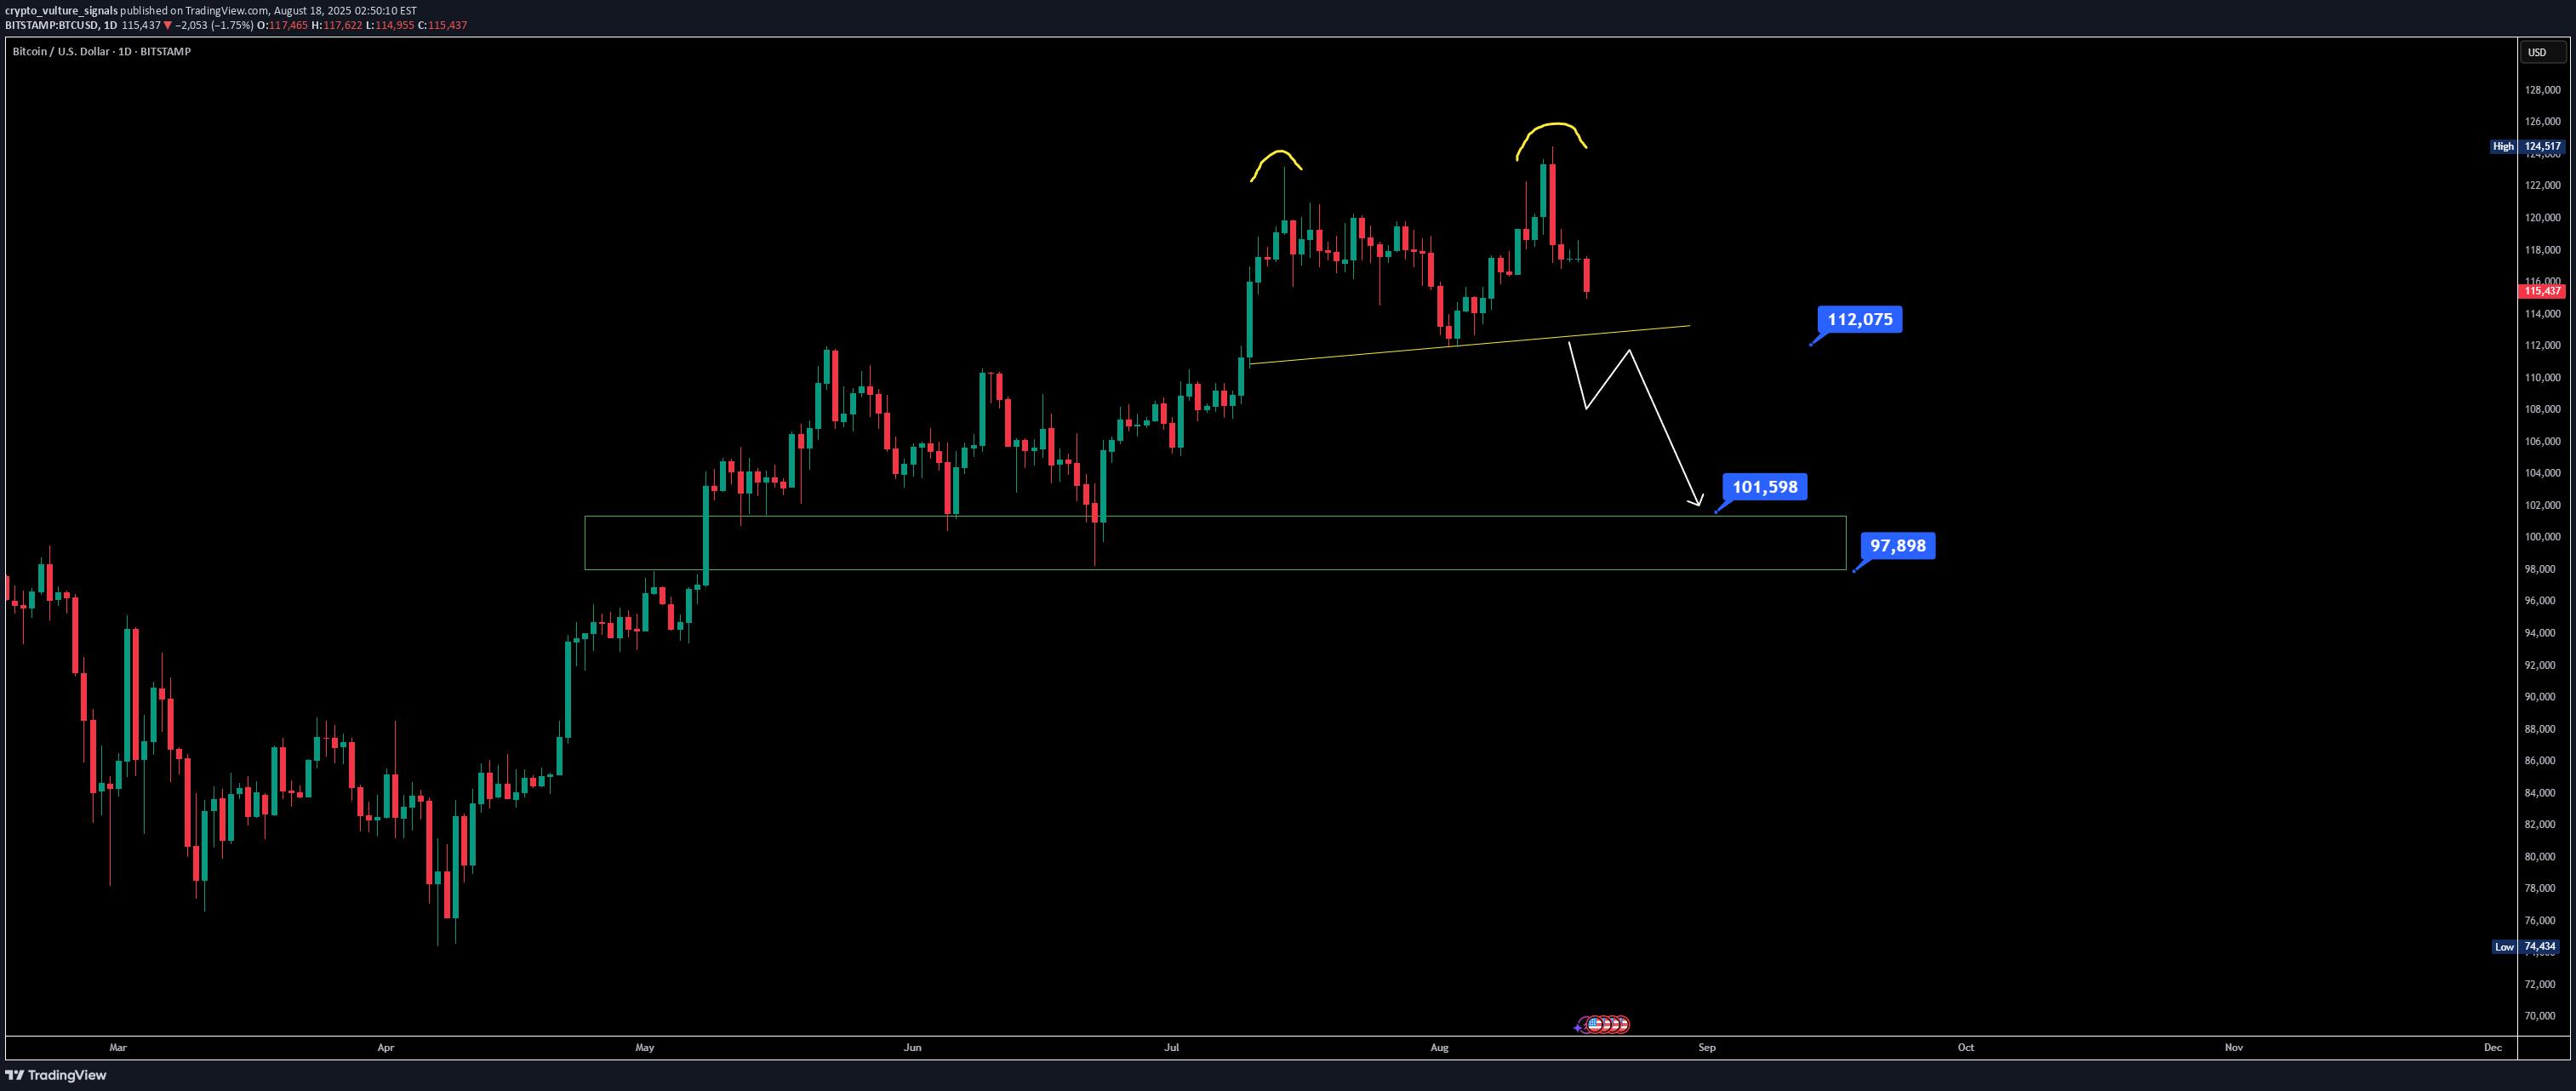
If we take a close look at Bitcoin on the daily timeframe, it’s shaping up into a clear double top pattern. Alongside this, there’s a strong bearish divergence that’s hard to ignore. The key level right now is around $112,000—if BTC loses that support, the double top comes into play, and the market could see a sharper correction. The immediate downside target would be around the $100,000–$101,500 zone, where buyers may attempt to step in. Below that, the stronger support sits near $98,000, and this level could decide whether BTC simply pulls back or actually transitions into a broader bearish cycle. If $98K gives way, we’re not just talking about a correction anymore—we could be looking at the start of a recession-like market cycle. On the flip side, if BTC manages to hold $112K and bounce, we may see higher levels tested again before any larger trend shift. So right now, the market is in a decision zone where the next few moves are crucial.

crypto_vulture_signals
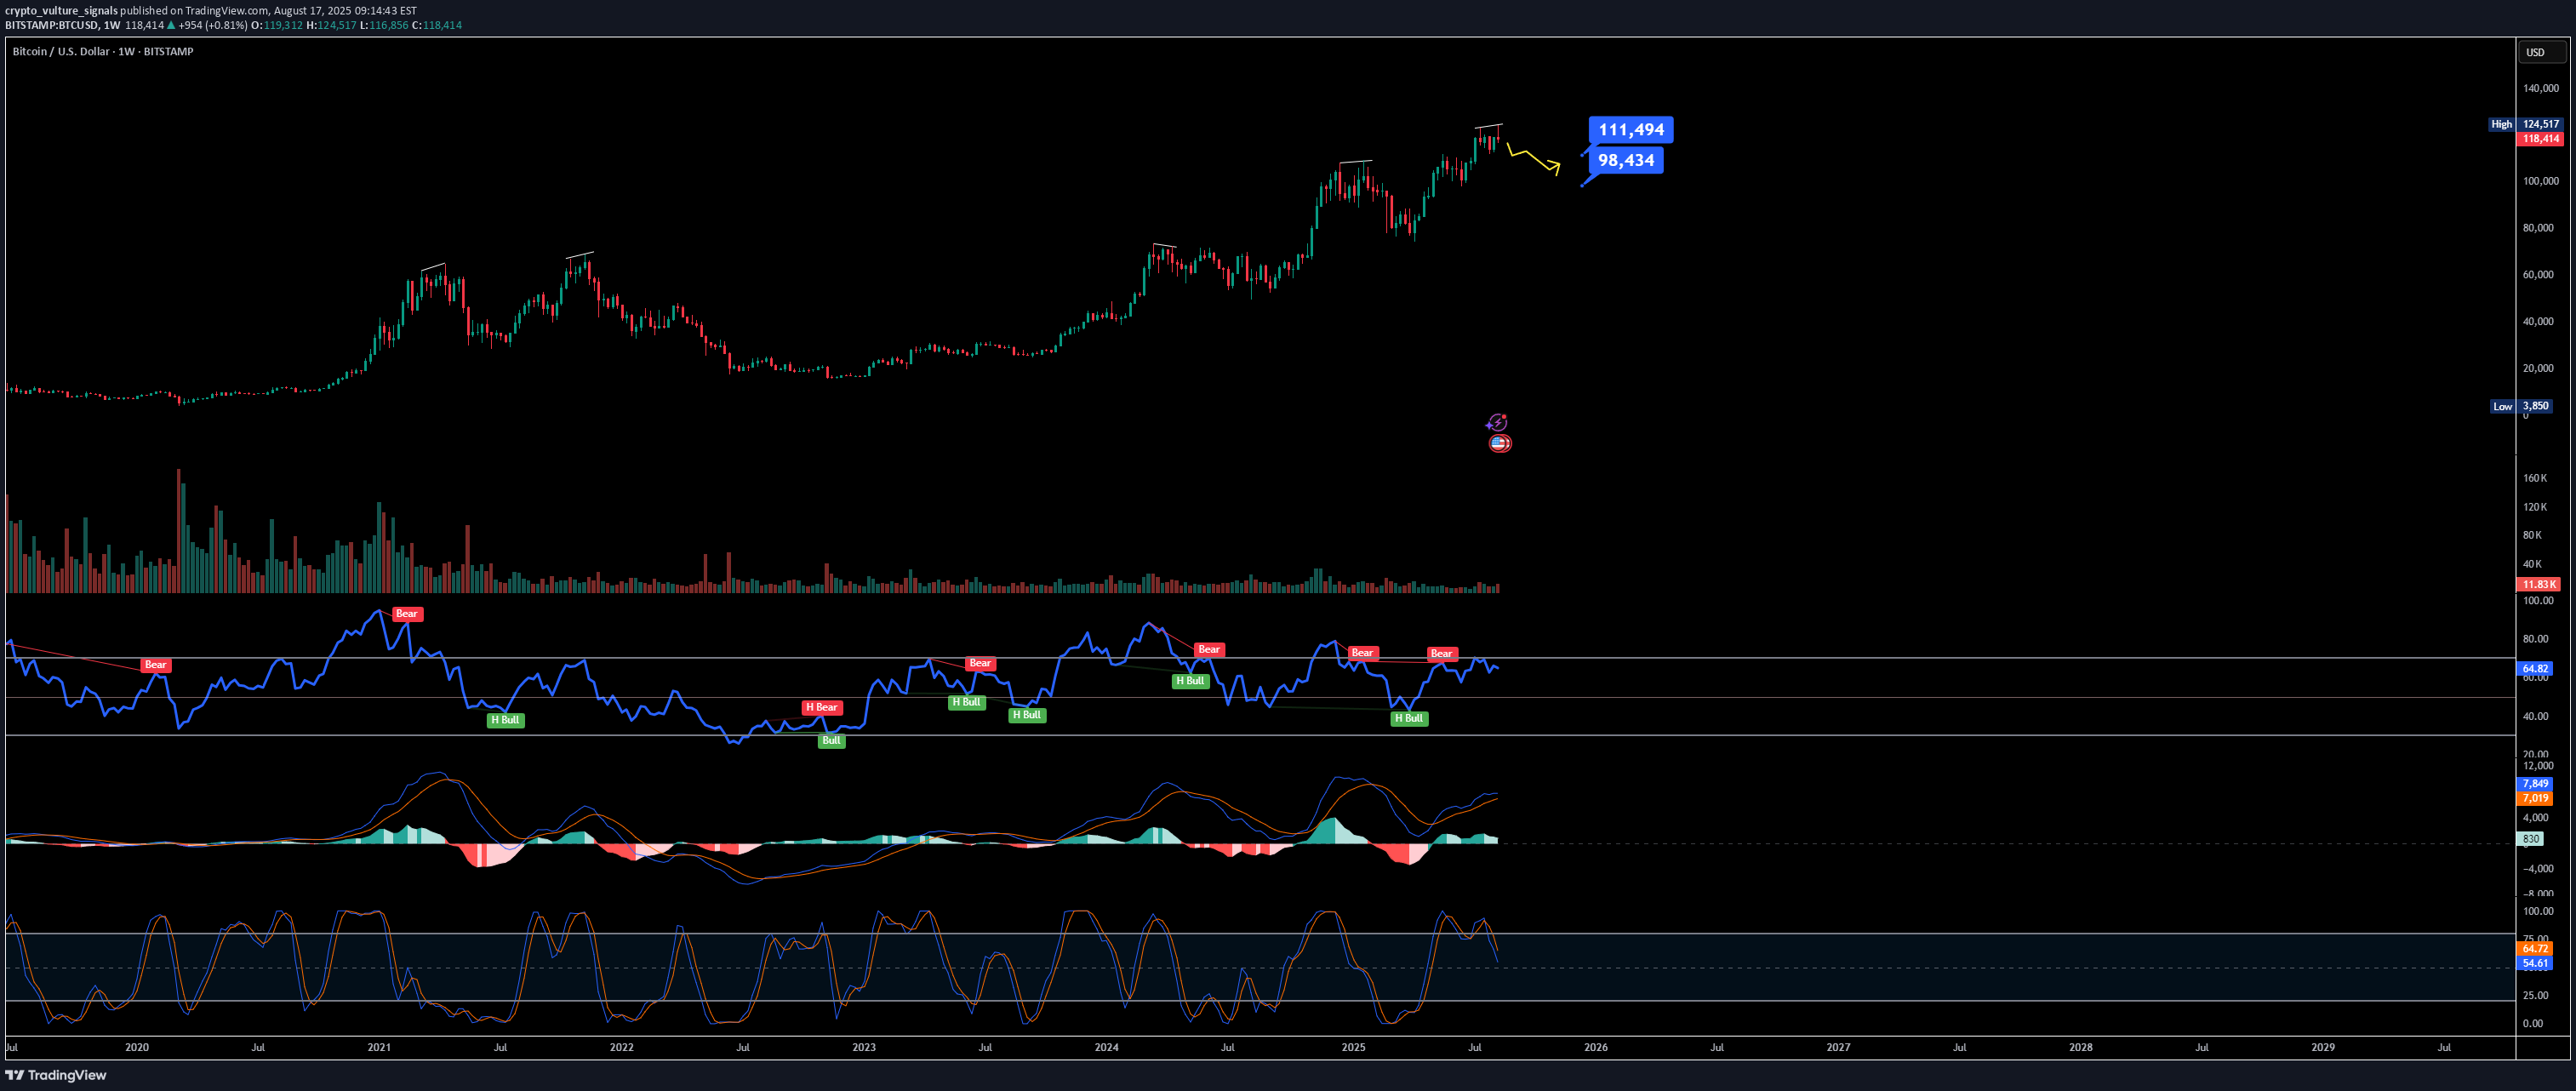
Bitcoin has once again shown a strong upward wick similar to previous cycles, where such moves often aligned with bearish divergence signals. Historically, when these divergences appeared, the market either corrected or transitioned into a bearish phase. Right now, BTC may attempt a retest around the $120,000–$122,000 zone, potentially fueled by short-term hype or news. However, if the divergence plays out as in past cycles, the market could begin correcting soon after. The first key liquidity zone sits near $98,000 — holding above this level keeps the structure healthy. But if BTC breaks below $98K support, the risk of a deeper bearish correction increases, possibly shifting the broader trend into a prolonged downcycle. Traders should be cautious here: watch the $120K retest for rejection and the $98K support for confirmation of the next major move.

crypto_vulture_signals
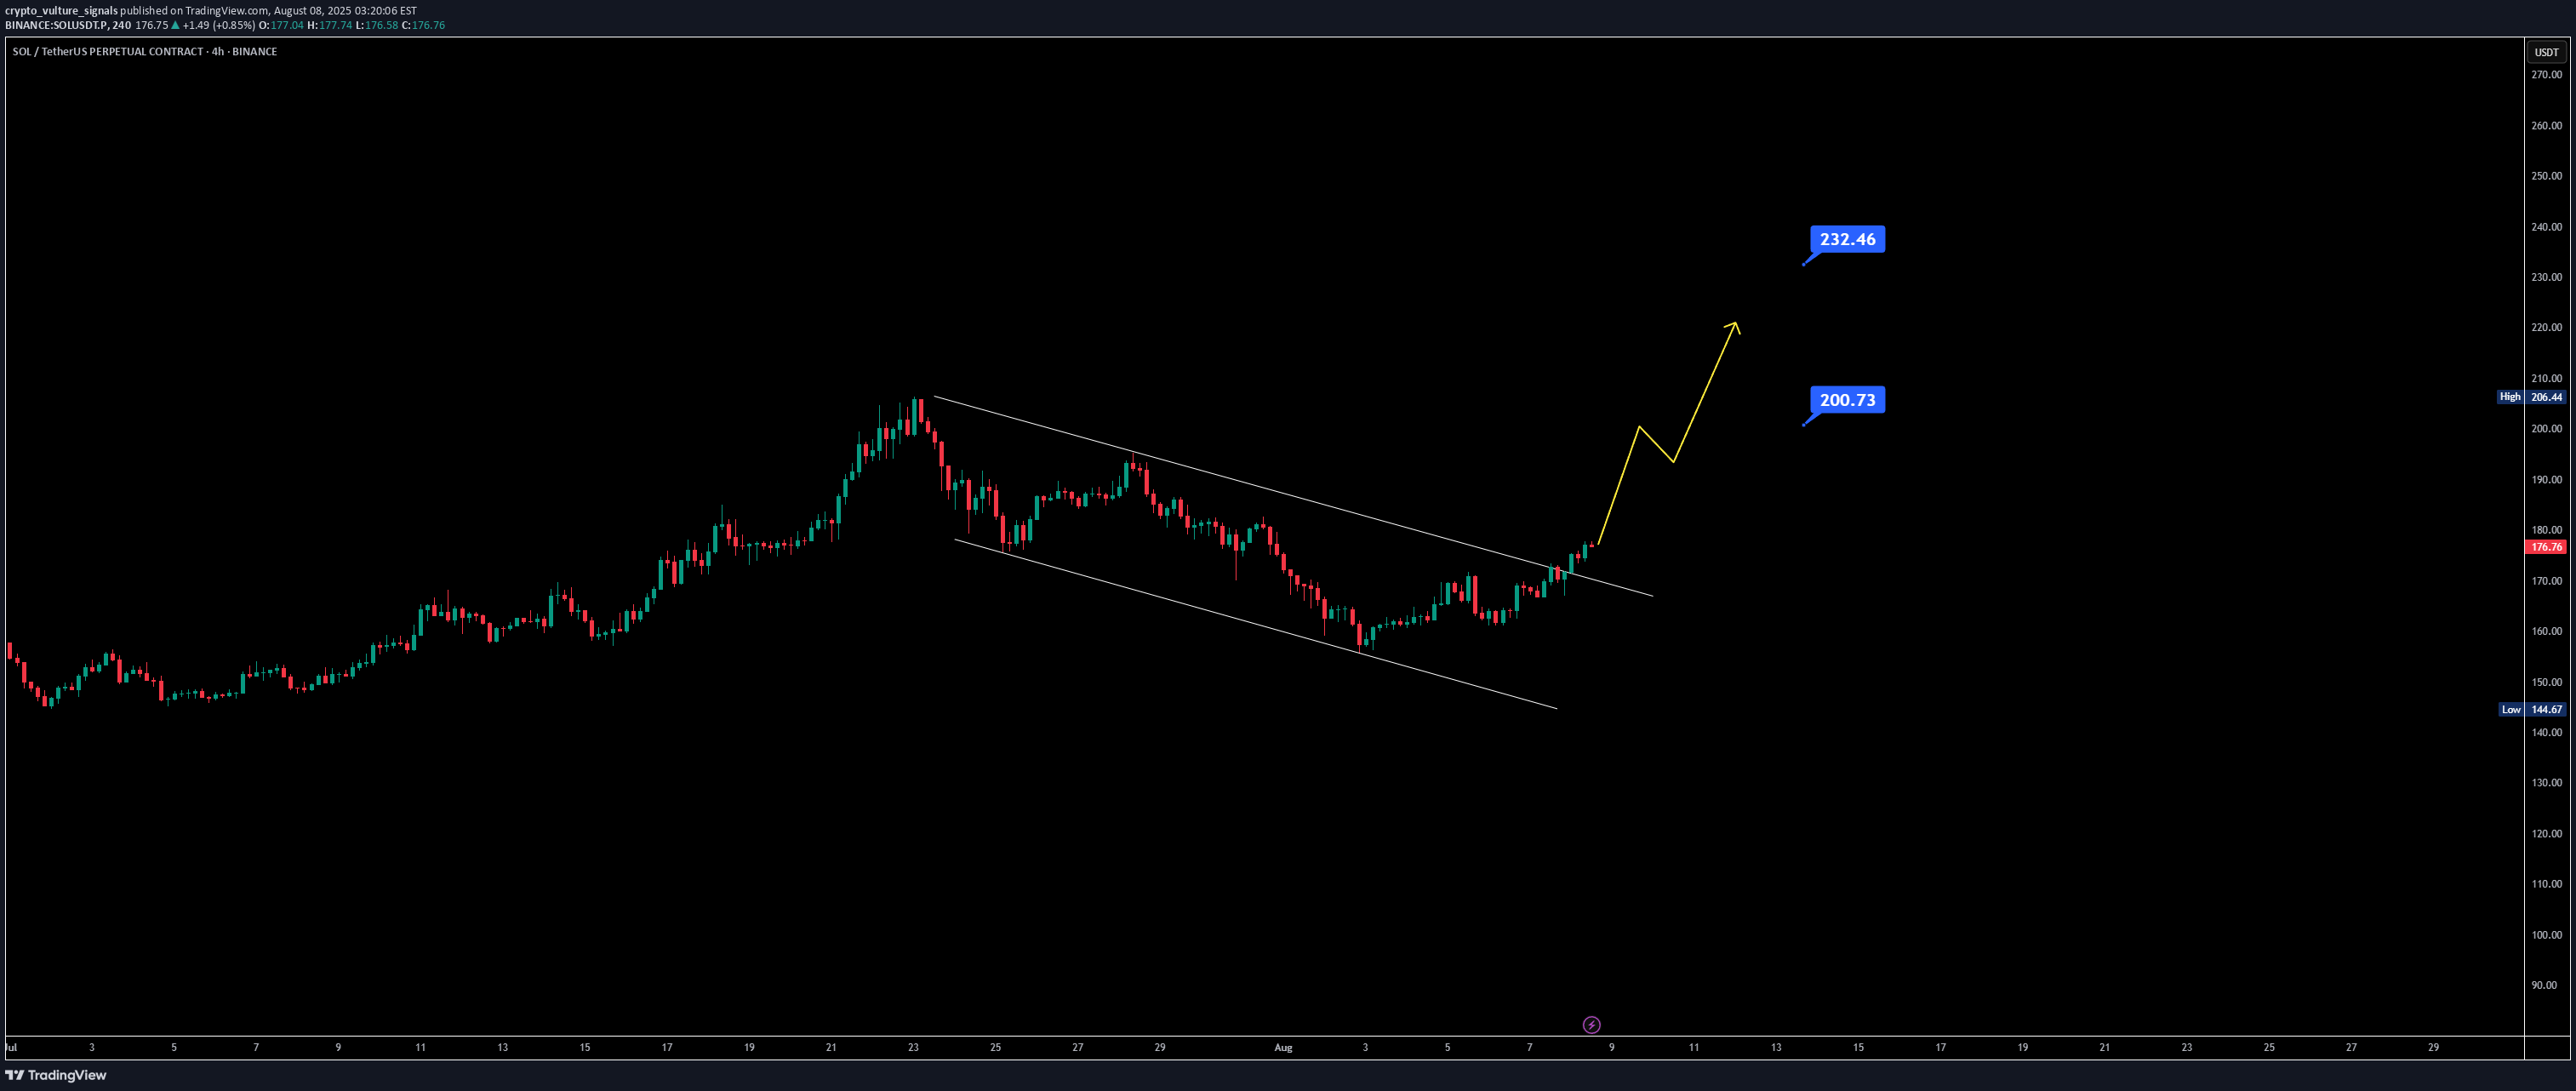
Solana has broken out of its recent downtrend on both the daily and 4-hour charts, showing clear signs of bullish strength. The price is pushing beyond its channel, and momentum suggests that the $200 liquidity zone is within reach. If SOL can close above the $206 resistance, it could open the door for a rally toward $230–$260, revisiting the prime all-time high area. EMA structure is also supportive — the 21 EMA has crossed above the 50 EMA, while the 100 EMA has crossed over the 200 EMA, both reinforcing the bullish outlook. With technical aligning and momentum building, Solana’s next move could be one of the most significant runs we’ve seen this year.

crypto_vulture_signals
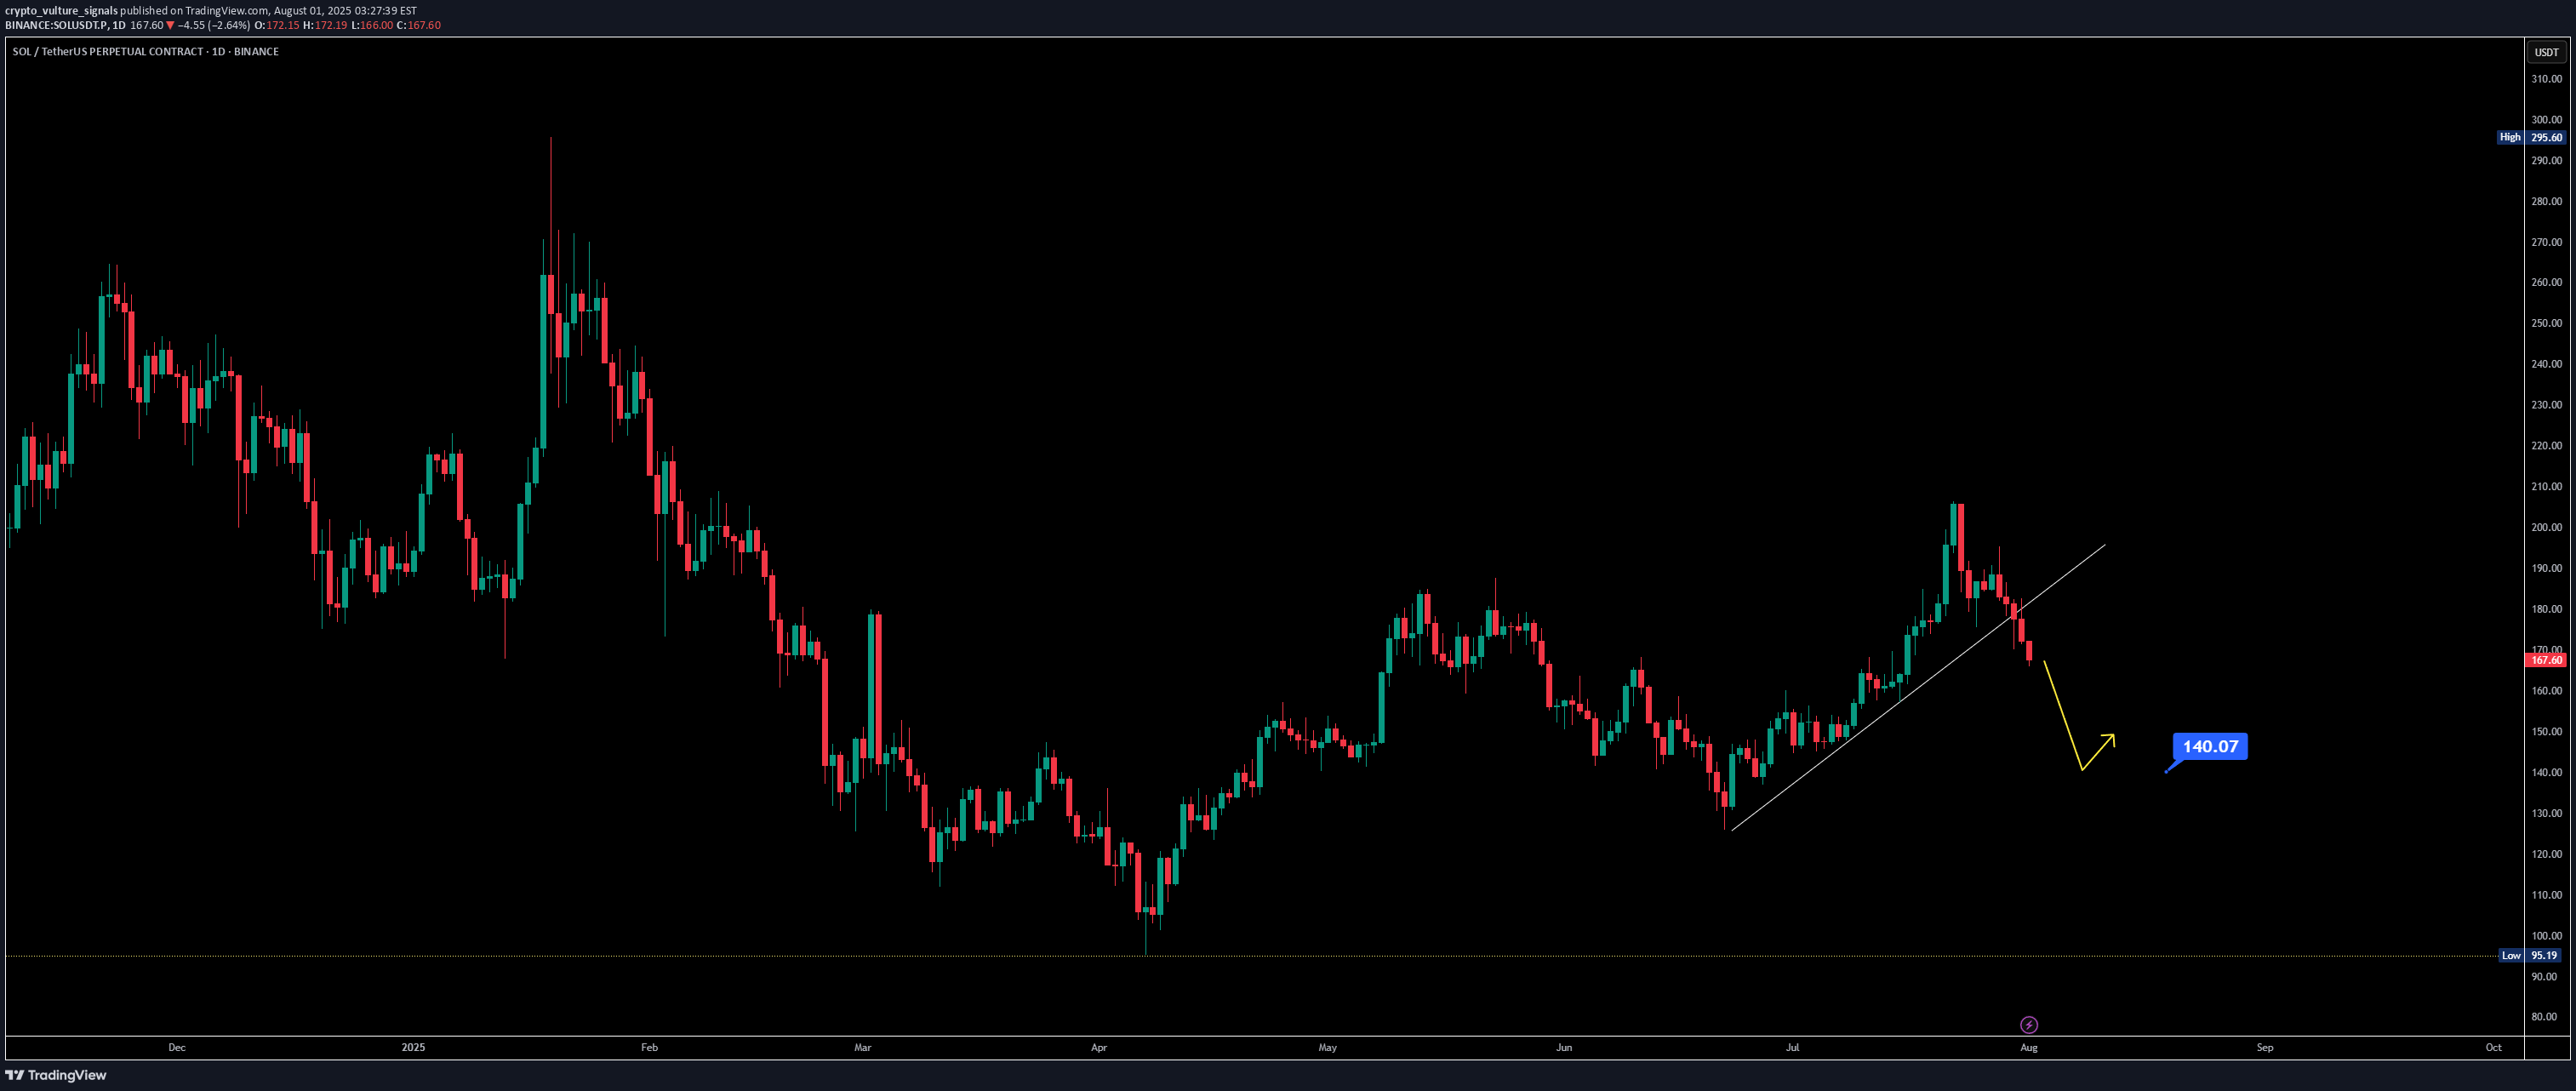
📉 SOL Loses Key Support | Eyes on $140 & $95 Zones 🕵️♂️ On the daily timeframe, #Solana has officially lost its key support near $140, which previously acted as a strong bounce zone. A failure to reclaim this level could open the gates for a deeper drop toward the $95–$100 support range. 📊 Indicators signal downside: RSI is trending downward MACD shows a bearish crossover Stochastic RSI confirms continued selling pressure ⚠️ Macro pressure adds fuel to the fire: August 1st tariff tensions, with expected news from Trump on charging Paris, are weighing down global risk assets. Historically, August tends to be a bearish month for crypto markets. 🎯 Key Levels to Watch: Immediate Resistance: $140 Major Support: $95–$100 🧠 Trade wisely and manage risk accordingly.

crypto_vulture_signals
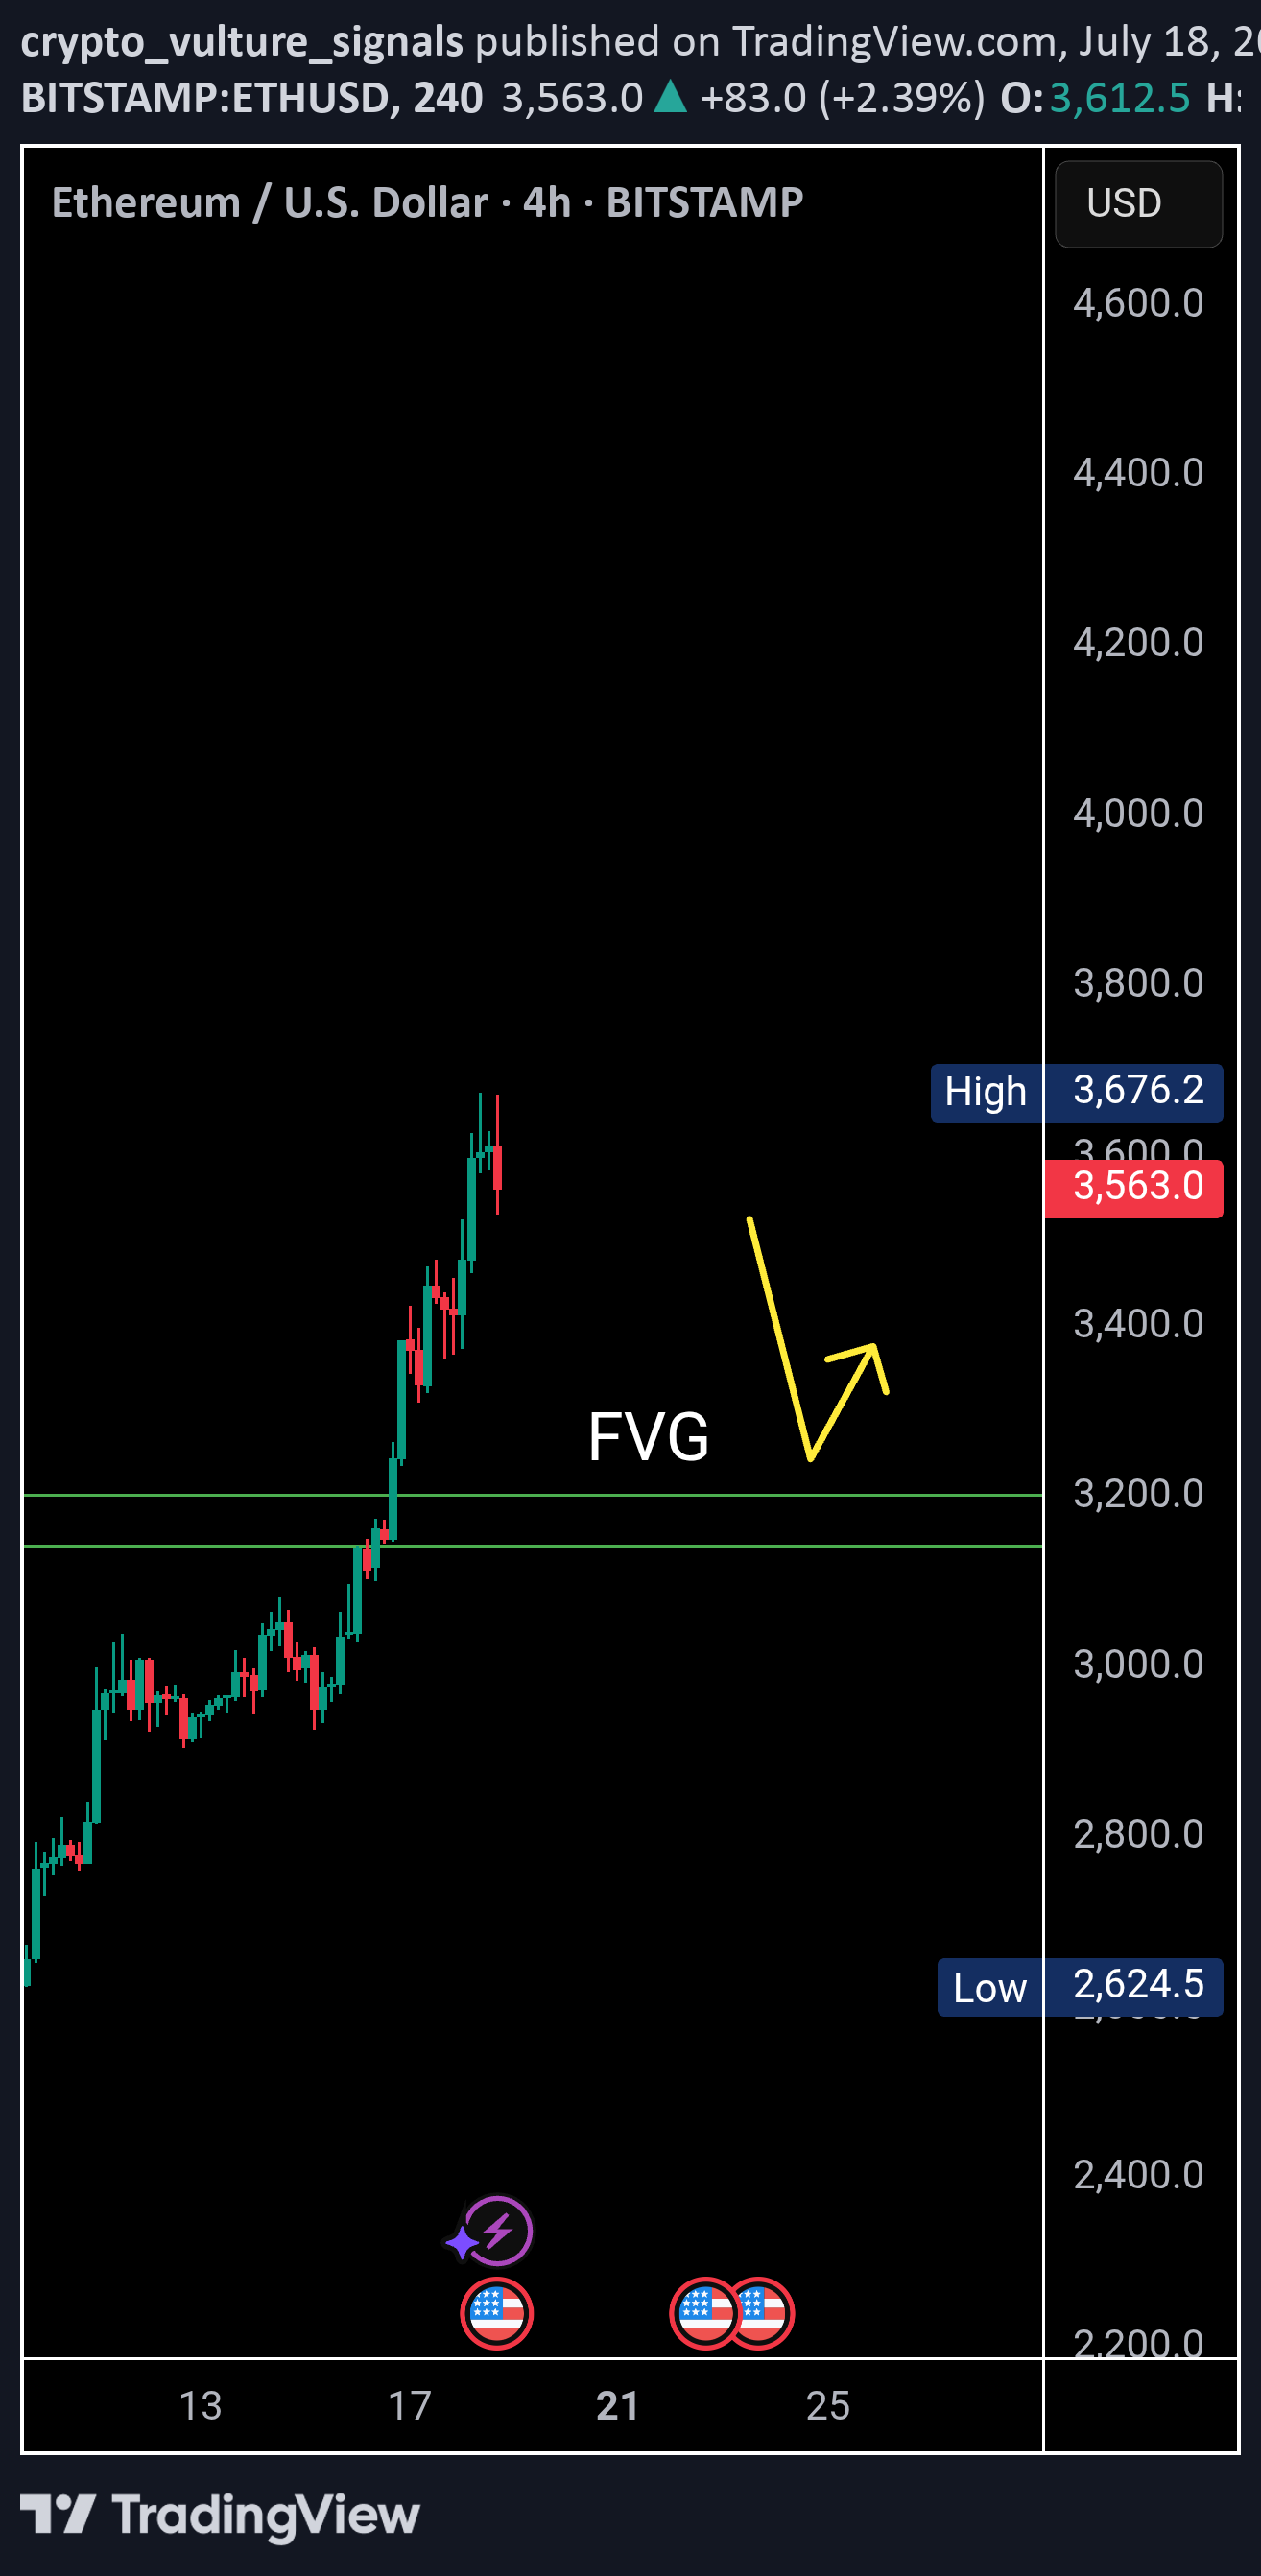
ETH/USDT | 4H Analysis Ethereum is currently showing signs of weakness on the 4H chart, forming a potential double top pattern around the $3,700-$3,680 range. Adding to this, the RSI is exhibiting bearish divergence, suggesting that bullish momentum is fading. There's a visible liquidity gap between $3,200–$3,180, which might act as a magnet in the short term. A retest of this zone is likely before ETH attempts to resume its upward move. Key Observations: 🟠 Double top structure on 4H chart 🔻 Bearish RSI divergence 🕳️ Favorable gap: $3,200 – $3,180 🔁 Watch for price reaction after retest ⚠️ If ETH holds the $3,180 support after filling the gap, a bullish bounce toward higher levels could follow. 📌 This idea is for educational purposes. Trade wisely with proper risk management.

crypto_vulture_signals
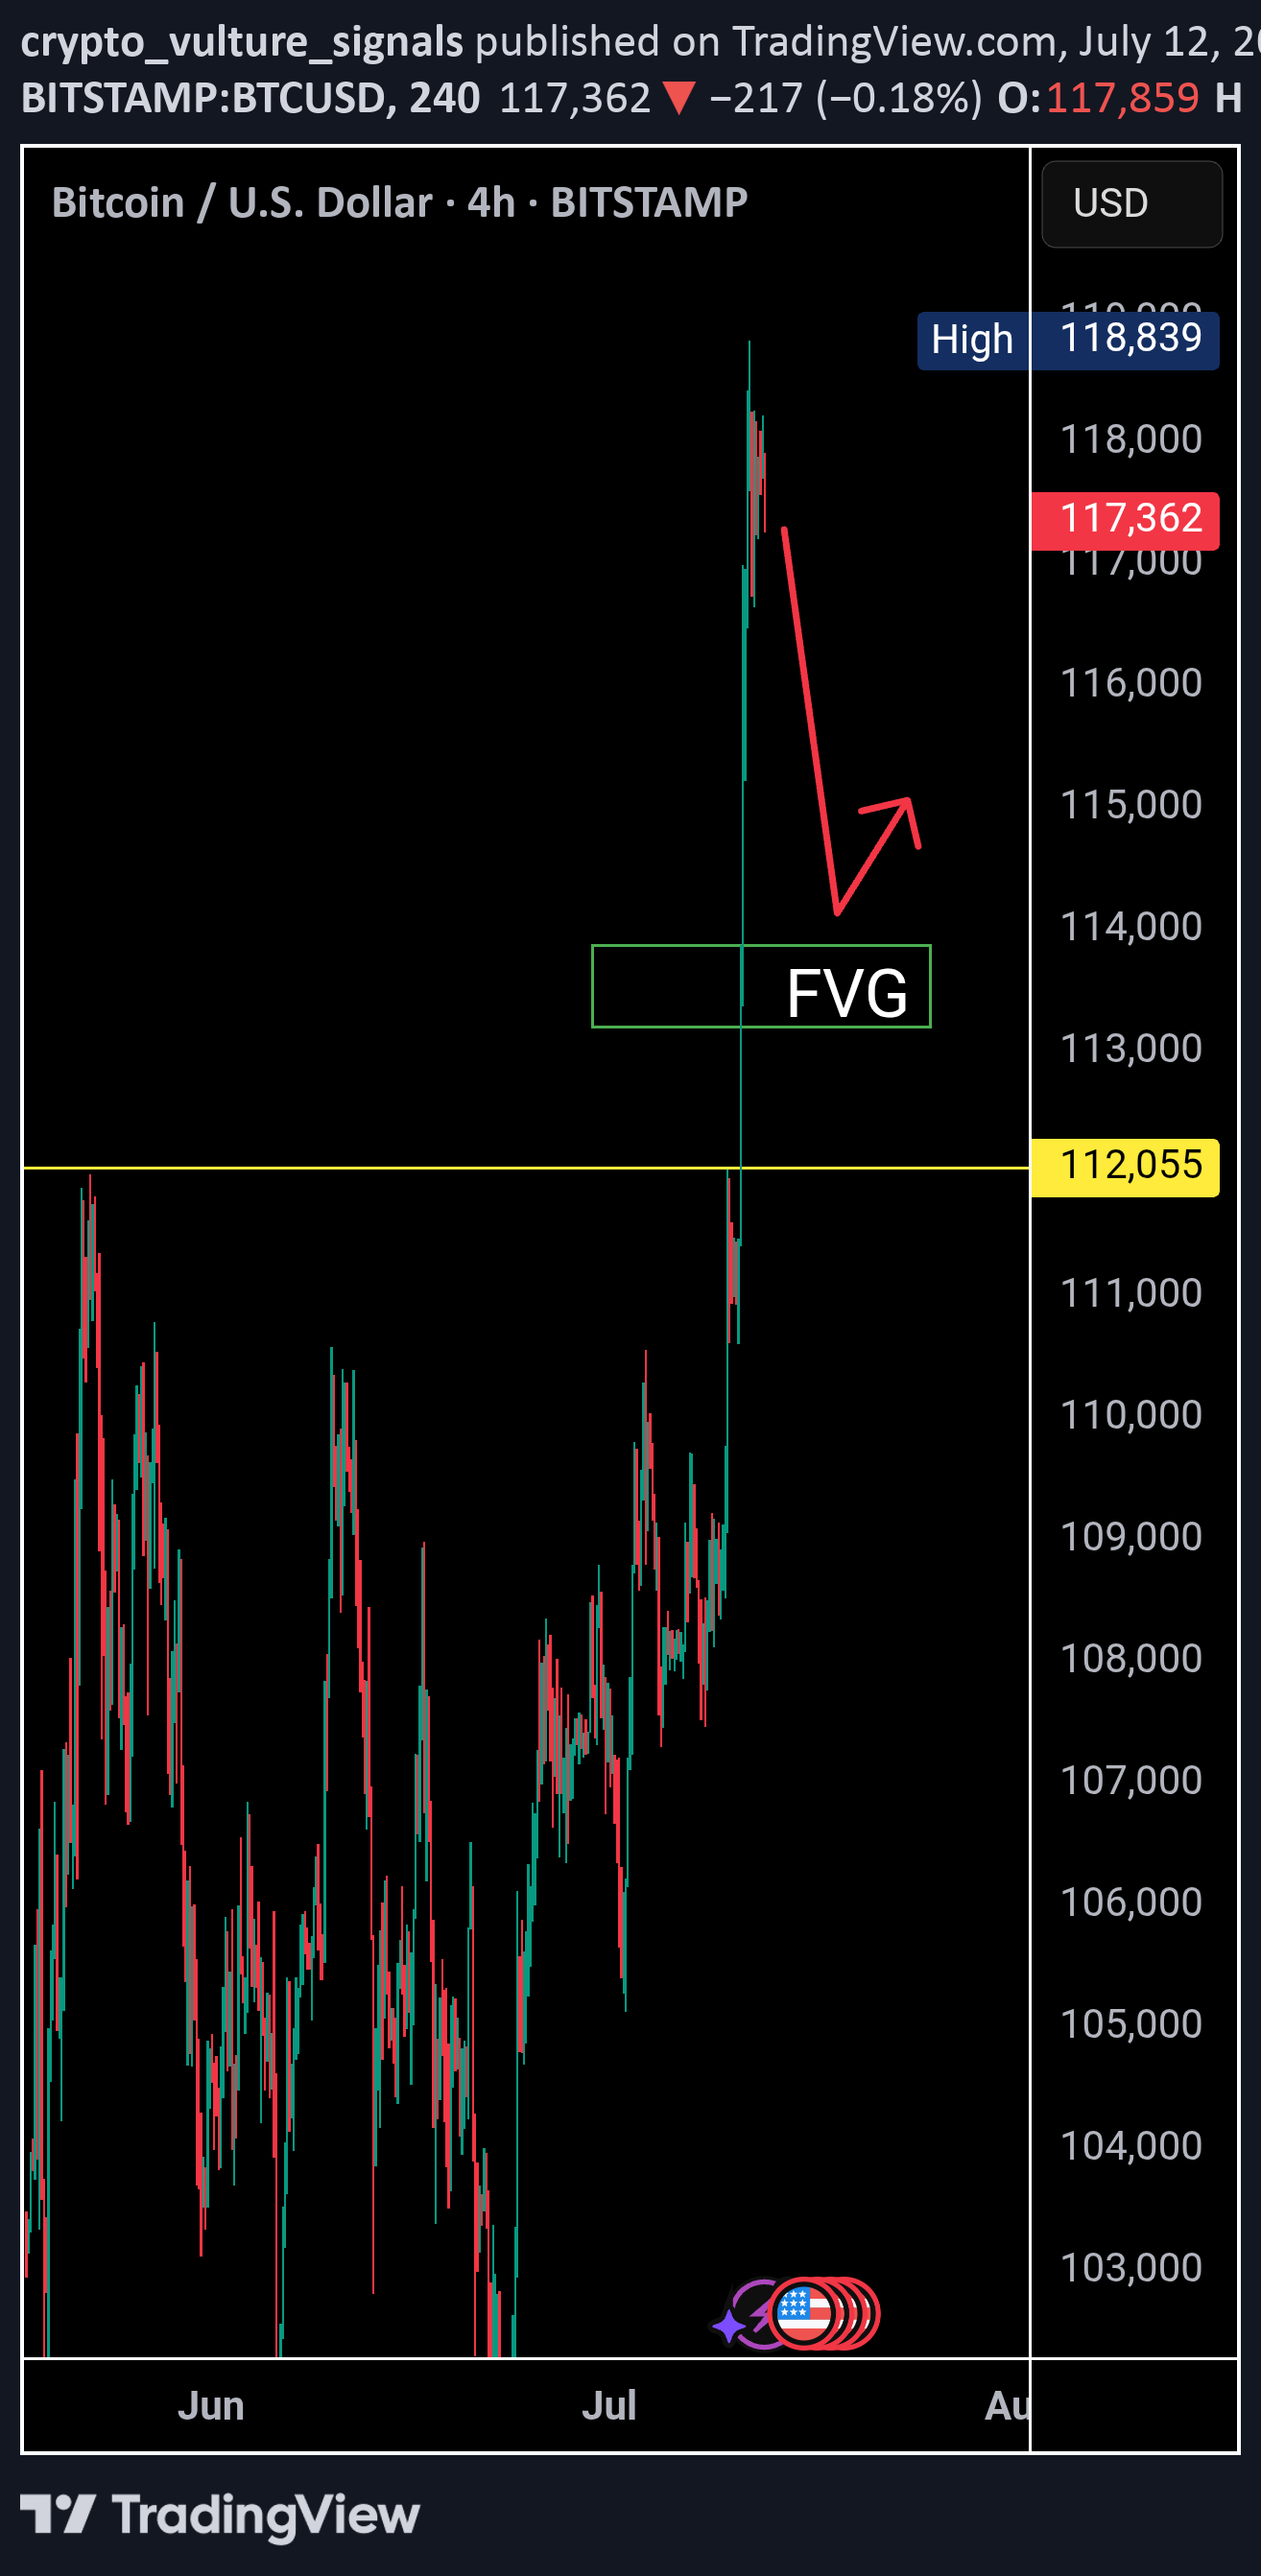
Bitcoin faces strong rejection near the $119K resistance zone, showing signs of a cooling market as the RSI exits the overbought territory. Historically, BTC tends to revisit key structural levels after such overheated moves. A favorable re-test zone lies between $114K and $112K, with $112K aligning closely with the previous all-time high — a psychologically significant support area. Support levels to watch: $112K (favorable retest) and $110K (strong base). As RSI continues to cool, keep an eye on bullish reactions around these levels for potential entries.
Disclaimer
Any content and materials included in Sahmeto's website and official communication channels are a compilation of personal opinions and analyses and are not binding. They do not constitute any recommendation for buying, selling, entering or exiting the stock market and cryptocurrency market. Also, all news and analyses included in the website and channels are merely republished information from official and unofficial domestic and foreign sources, and it is obvious that users of the said content are responsible for following up and ensuring the authenticity and accuracy of the materials. Therefore, while disclaiming responsibility, it is declared that the responsibility for any decision-making, action, and potential profit and loss in the capital market and cryptocurrency market lies with the trader.