Technical analysis by crypto_vulture_signals about Symbol ETH: Sell recommendation (7/18/2025)

crypto_vulture_signals
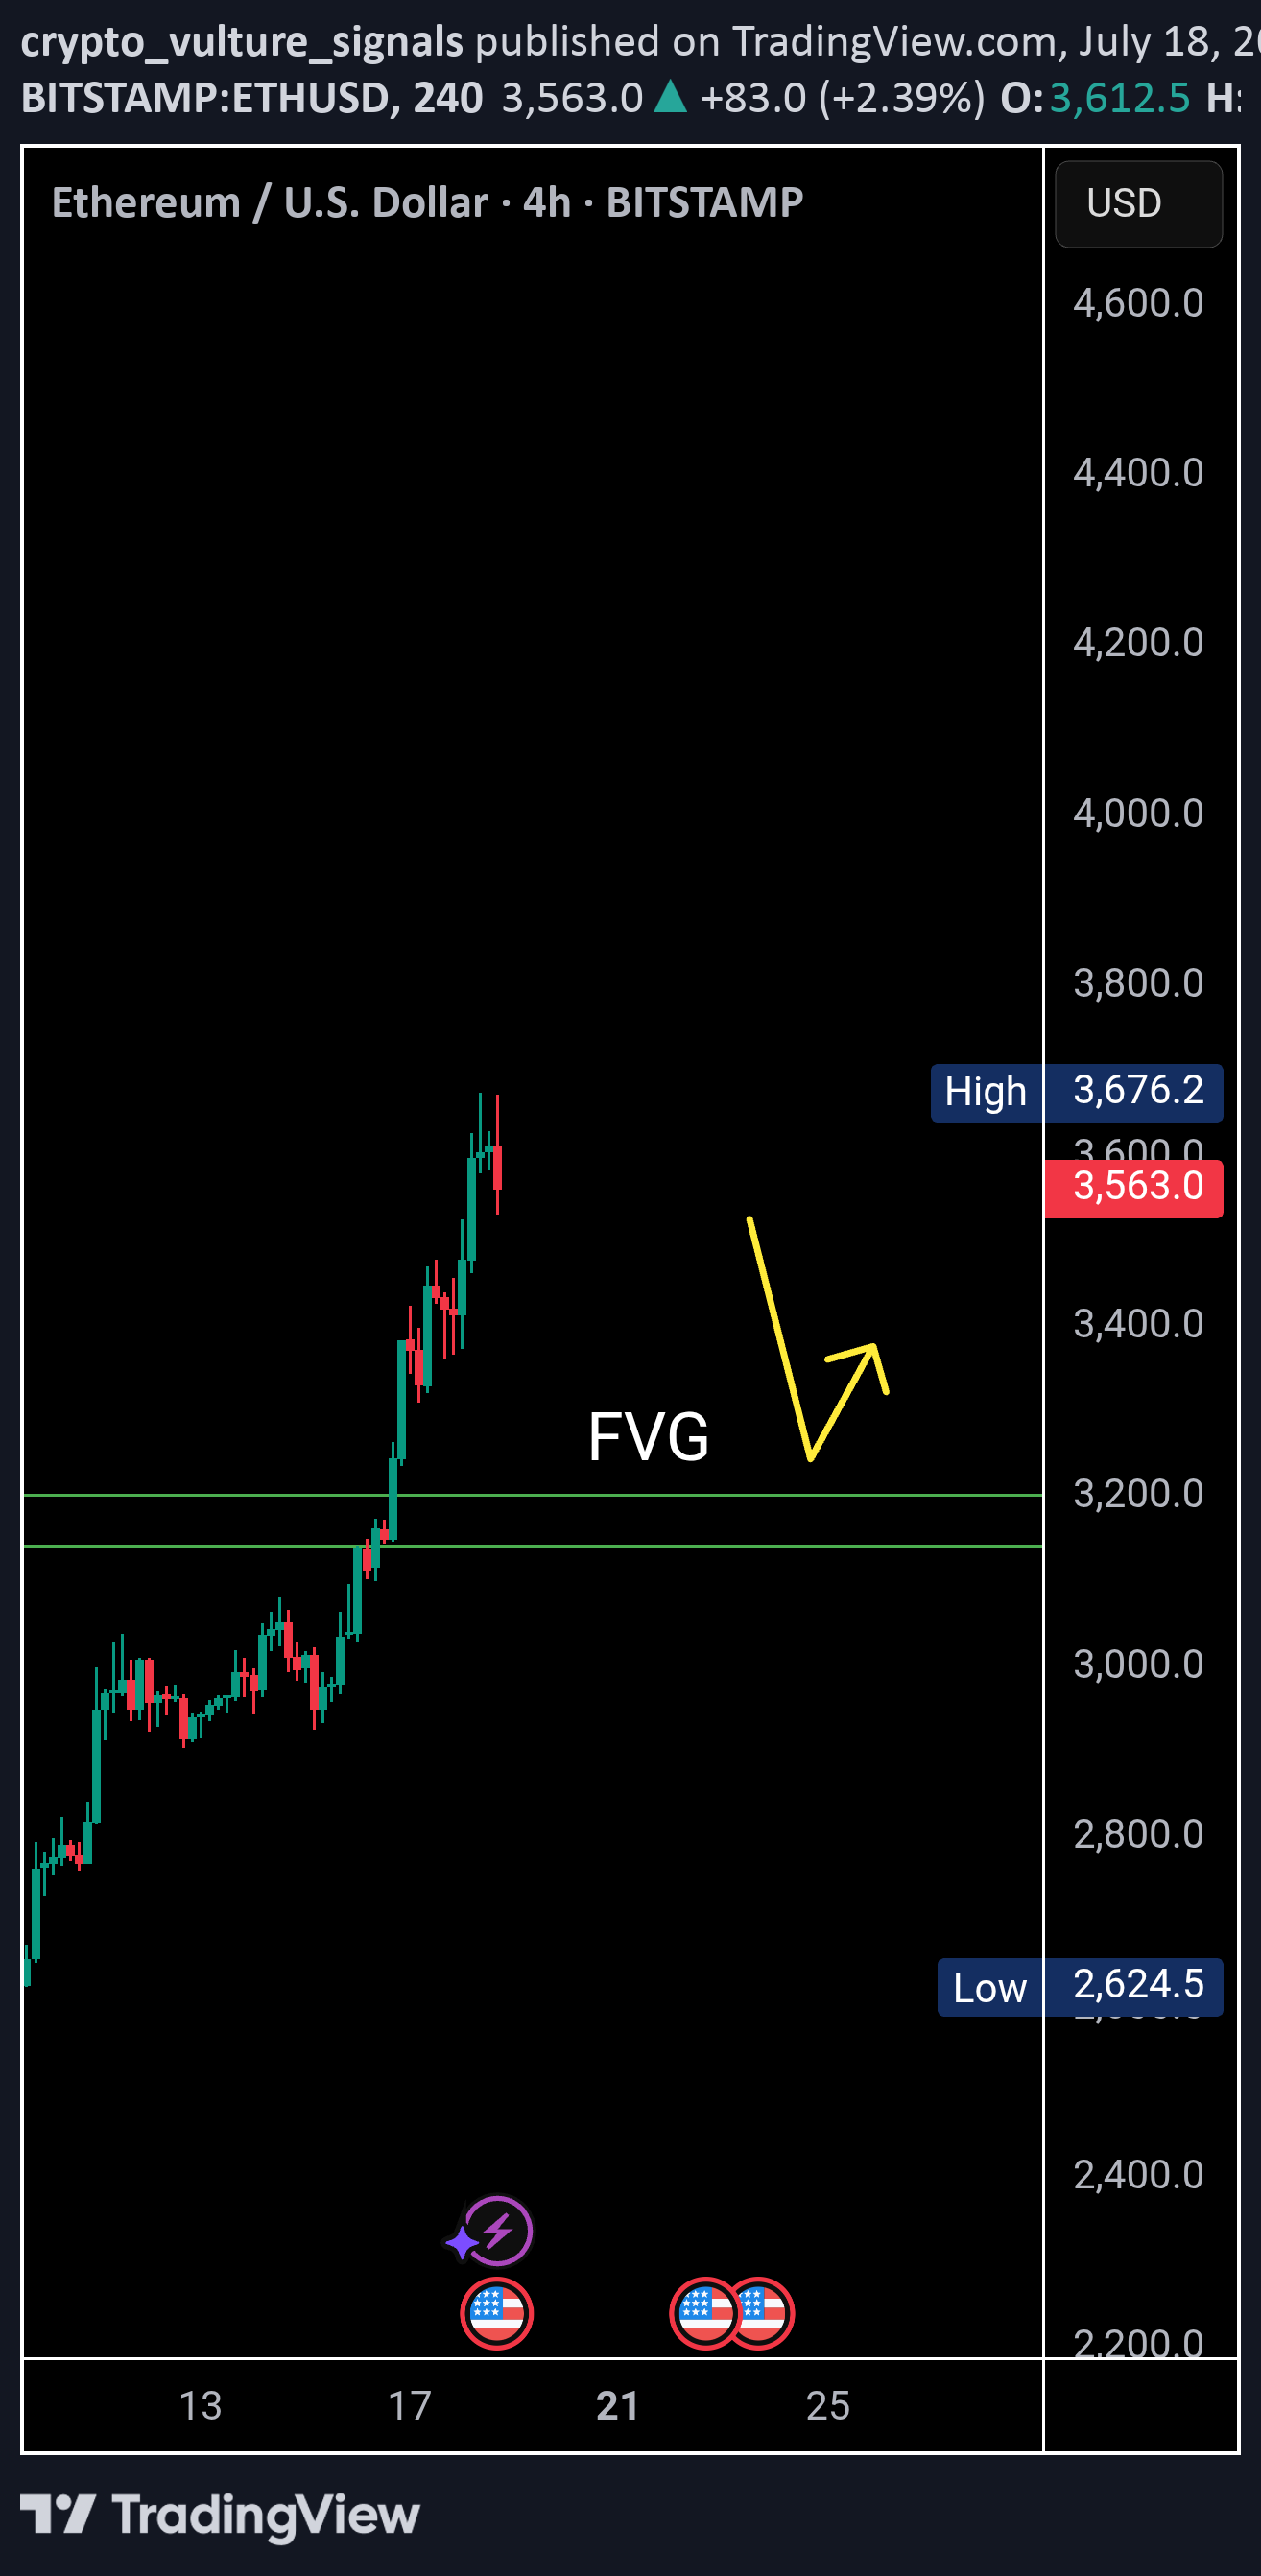
ETH/USDT | 4H Analysis Ethereum is currently showing signs of weakness on the 4H chart, forming a potential double top pattern around the $3,700-$3,680 range. Adding to this, the RSI is exhibiting bearish divergence, suggesting that bullish momentum is fading. There's a visible liquidity gap between $3,200–$3,180, which might act as a magnet in the short term. A retest of this zone is likely before ETH attempts to resume its upward move. Key Observations: 🟠 Double top structure on 4H chart 🔻 Bearish RSI divergence 🕳️ Favorable gap: $3,200 – $3,180 🔁 Watch for price reaction after retest ⚠️ If ETH holds the $3,180 support after filling the gap, a bullish bounce toward higher levels could follow. 📌 This idea is for educational purposes. Trade wisely with proper risk management.
