
crypto_pumpppp
@t_crypto_pumpppp

What symbols does the trader recommend buying?
Purchase History
پیام های تریدر
Filter
crypto_pumpppp
✨ ONEUSDT: Breakout from Descending Channel Signal
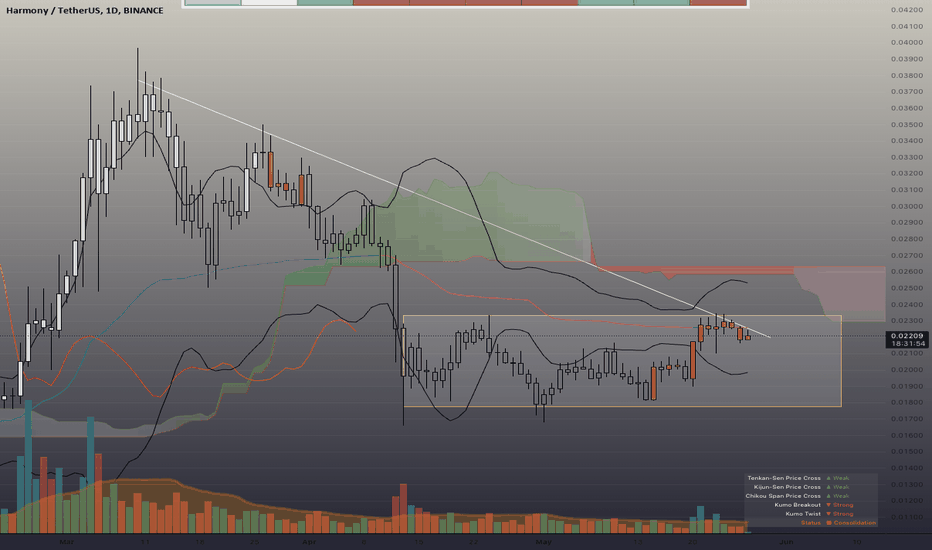
📊 Chart Analysis : The ONEUSDT daily chart shows a descending channel pattern, which is a bullish reversal signal when broken to the upside. The price has been contained within this downward-sloping channel since early April, and it is now approaching a breakout point. - Resistance Level: The upper boundary of the descending channel around $0.0220. - Potential Target: Upon a successful breakout, the measured move target is around $0.0320, indicating a potential upside of approximately 46%. - Volume: An increase in volume on the breakout would confirm the strength of the move. 🔍 Technical Indicator Analysis : Momentum: - RSI: Mostly neutral across timeframes, indicating balanced momentum with a slight bullish bias in the mid-term (12h at 56.8). Trend: - ADX: Neutral across most timeframes, with a slight bullish bias in the long term (1w at 29), suggesting emerging trend strength. - CCI: Bullish in the short term (1h at 100.4) but turns neutral or bearish in longer timeframes. - Ichimoku: Bullish in the mid-term (6h to 12h) but remains bearish in the longer term (1d to 1w), indicating potential short-term upward movement. - MACD: Bullish in the short term (1h) and mid-term (1d), with bearish signals in the longer term (3d to 1w). Volatility: - ATR: Low fluctuation in the short term, indicating stable price action, with high fluctuation expected in the longer term. - Bollinger Bands: Neutral in the short term, high fluctuation in the long term, suggesting potential increased volatility. Volume: - ADI, OBV: Generally bearish in the short term, but turns bullish in the mid to long term, indicating accumulation. - VWAP: Bullish in the short term, bearish in the longer term, highlighting mixed volume trends. 🔮 Prediction : Short-term (1h - 4h): Expect bullish movement with short-term indicators pointing upwards. Mid-term (6h - 12h): Continued bullish momentum likely as indicated by Ichimoku and MACD. Long-term (3d - 1w): Caution is advised due to mixed signals and potential high volatility. 📝 Conclusion : ONEUSDT is poised for a potential bullish breakout from its descending channel pattern. Short to mid-term indicators support an upward move, while longer-term indicators suggest caution due to potential volatility. 💡 Final Call : - Watch for a breakout above $0.0220 with increased volume for confirmation. - Monitor key support at $0.0170 and resistance at $0.0220. - Prepare for potential volatility and manage risk appropriately. - Remember, Patience is the key in trading. 🙏 Thank You : Thank you for reading this analysis. Always conduct your own research (DYOR) and make informed trading decisions. Happy trading! Tags: #TechnicalAnalysis #ONEUSDT #CryptoTrading #BullishBreakout #Cryptocurrency
crypto_pumpppp
✨ KAVAUSDT: Bullish Breakout Anticipated After Consolidation
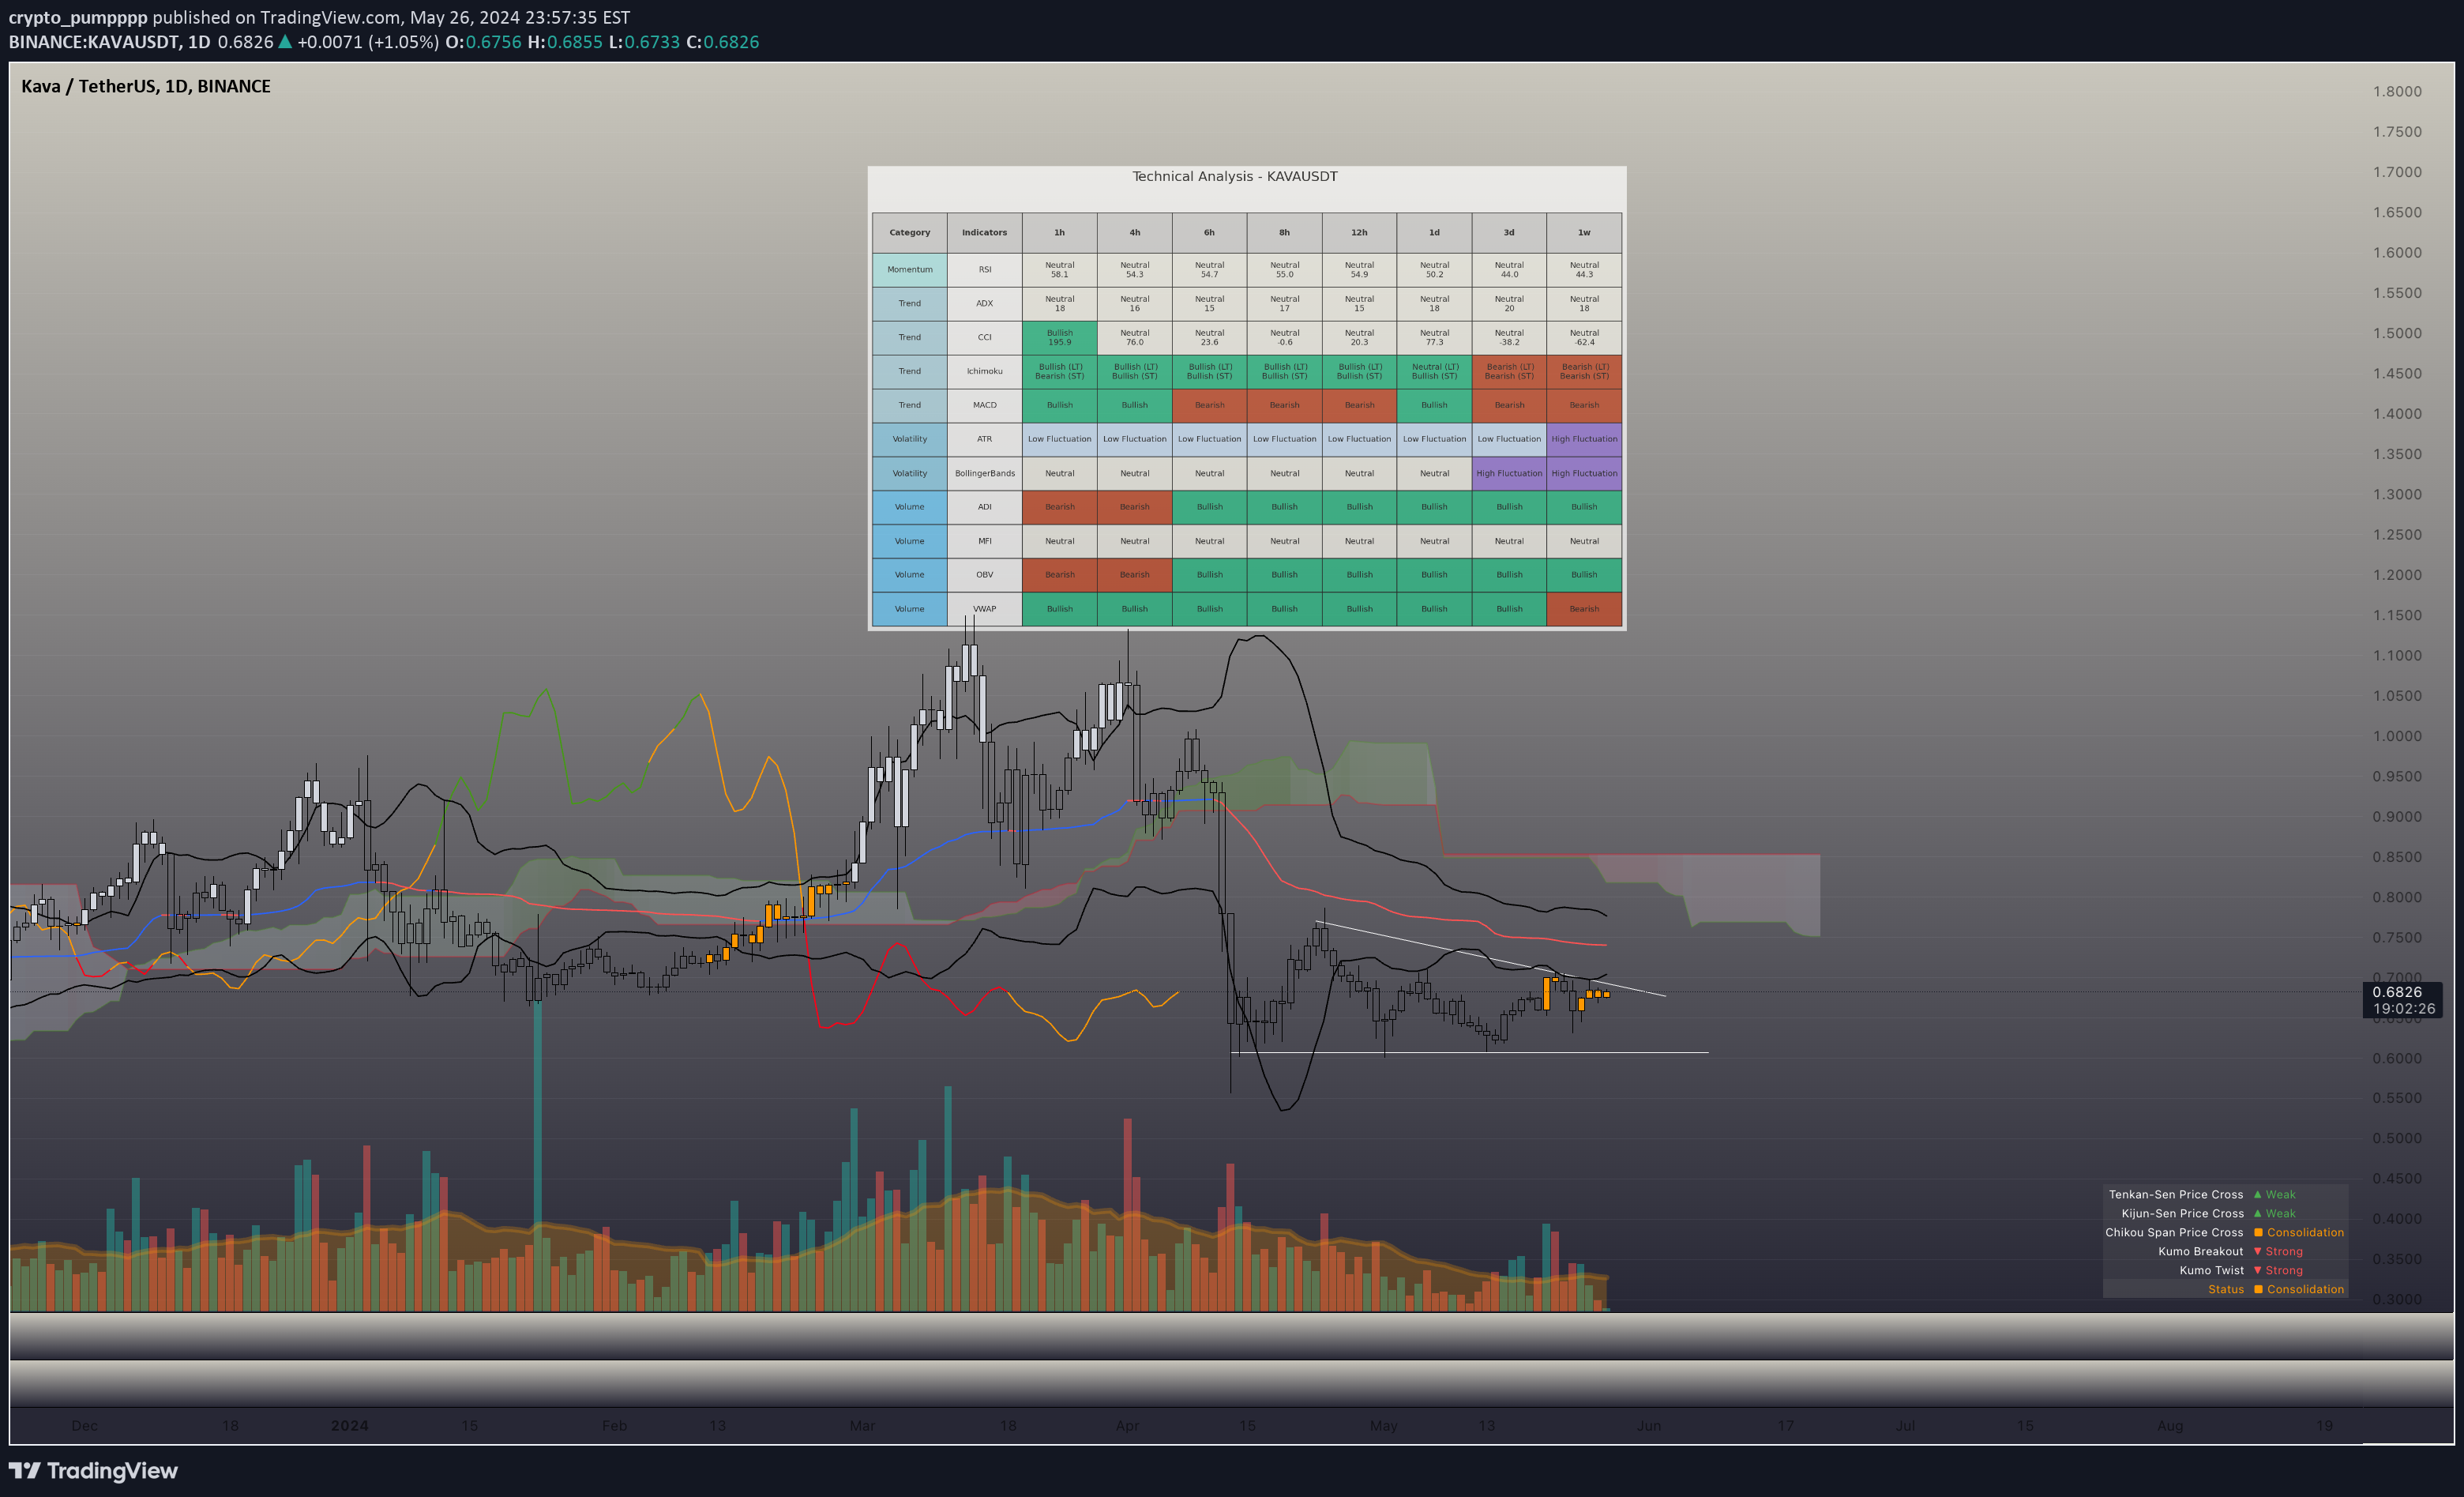
📊 Chart Analysis : The KAVAUSDT 1D chart indicates a potential bullish breakout following a period of consolidation. The downtrend line drawn from early April has been tested multiple times, with the price now approaching a breakout point. The key aspects of this chart include: - Resistance Level: The downward trendline around $0.68, acting as a significant resistance. - Potential Target: Based on the breakout projection, the target price is around $0.83, indicating a potential upside of approximately 25%. - Volume: A spike in volume upon breaking the trendline will confirm the breakout and strengthen the bullish case. 🔍 Technical Indicator Analysis : Analyzing the technical indicators across different timeframes reveals mixed signals but a generally bullish outlook in the short to mid-term. Momentum: - RSI: Neutral across all timeframes, indicating neither overbought nor oversold conditions, with a slight bullish bias in the short term (1h at 58.1). Trend: - ADX: Mostly neutral, indicating a lack of strong trend strength currently. - CCI: Bullish in the short term (1h at 195.9), but turns neutral or slightly bearish in longer timeframes. - Ichimoku: Bullish in the short to mid-term (up to 12h), indicating a positive trend development. However, it turns bearish in the longer term (3d, 1w). - MACD: Bullish in the short term but turns bearish in the mid to long term (6h to 1w). Volatility: - ATR: Low fluctuation across most timeframes, indicating low volatility and potential for a breakout. - Bollinger Bands: Neutral in the short term but high fluctuation in the longer term, suggesting increasing volatility. Volume: - ADI, OBV, VWAP: ADI and OBV show bearish signals in the short term but turn bullish in the longer term, indicating accumulation. VWAP remains bullish across most timeframes. 🔮 Prediction : Short-term (1h - 4h): Expect a bullish movement as indicated by the bullish MACD and CCI. Mid-term (6h - 12h): Continued bullish momentum is likely, supported by bullish Ichimoku and ADI indicators. Long-term (3d - 1w): Caution is advised as longer-term indicators suggest potential bearish trends and high fluctuation volatility. 📝 Conclusion : KAVAUSDT is positioned for a potential bullish breakout following a period of consolidation. Short to mid-term indicators favor upward movement, while longer-term signals urge caution due to potential bearish trends and increased volatility. 💡 Final Call : - Watch for a breakout above $0.68 ~ $0.69 with increased volume for confirmation. - Monitor key support at $0.58 and resistance at $0.65. - Prepare for potential volatility and manage risk appropriately. - Remember, Patience is the key in trading. 🙏 Thank You : Thank you for reading this analysis. Always conduct your own research (DYOR) and make informed trading decisions. Happy trading! #TechnicalAnalysis #KAVAUSDT #CryptoTrading #BullishBreakout #Cryptocurrency
crypto_pumpppp
📍 #SOL UPDATE
Analysis of Solana (SOL/USDT) 1. Chart Analysis and Technical Patterns The price chart of Solana (SOL/USDT) on the 12-hour timeframe shows significant price levels and potential movement scenarios with the following key points: - Support Level at $160: The price has consistently bounced back from the $160 support level, indicating strong buying interest at this level. - Current Price Action: Currently, the price is trading around $168.65 with minor movements, indicating a period of consolidation. - Potential Bullish Scenario: If the price can maintain above the $160 support level, a potential bullish move is expected towards $175. Breaking this level could lead to a further surge towards $215, as indicated by the arrows on the chart. - Potential Bearish Scenario: If the price fails to hold the $160 support level, a drop to lower support levels around $145 or even $130 could be seen. 2. Technical Indicator Analysis Some highlights from my screener: - Momentum Indicators: - **15m to 1h:** Mixed signals with indicators like KAMA and ROC showing bullish signals, while PPO and PVO are bearish. - **4h to 1d:** Mostly bearish signals with some neutral indicators, suggesting a cautious approach in the short to medium term. - **1w:** Bullish signals dominate, indicating a strong long-term momentum. - Trend Indicators: - **1h to 1d:** Mixed signals with EMA and MACD showing bullish, while DPO and Ichimoku Cloud present bearish signals. - **1w:** Predominantly bullish signals, suggesting a long-term upward trend. - Volatility Indicators: - **15m to 1d:** High volatility indicated by ATR and Bollinger Bands, suggesting potential for significant price swings. - **1w:** Reduced volatility, indicating potential stabilization of price in the long term. - Volume Indicators: - **Short-term:** Bearish signals across several volume indicators such as OBV and VWAP, indicating low buying pressure. - **Long-term:** Bullish signals in longer timeframes, suggesting accumulation and potential for future price increases. 3. Conclusion and Predictions - Positive Signals: - The $160 support level is crucial and has shown resilience. - Long-term trend and momentum indicators are bullish, supporting the potential for an upward movement. - If the price breaks above $175, it could rally towards $215. - Risks: - High short-term volatility might cause fluctuations, making short-term predictions uncertain. - Mixed short to medium-term indicators suggest the need for caution in the near future. Predictions: - Short-term (1 week): The price may hover around $160-$175, with potential minor corrections or consolidations. - Medium-term (1 month): A break above $175 could lead to a strong bullish movement towards $215. - Long-term (3-6 months): The long-term uptrend is likely to continue, supported by strong momentum and trend indicators. Overall, Solana shows strong potential for price appreciation in the long-term, though short-term volatility should be monitored. Please consider current support and resistance levels and make informed decisions based on the risk tolerance and investment horizon. Remember to DYOR 📊 before making investment decisions! 💸 #SOL #Solana #Crypto
crypto_pumpppp
$PENDLE, Breakout Alert! 🚨
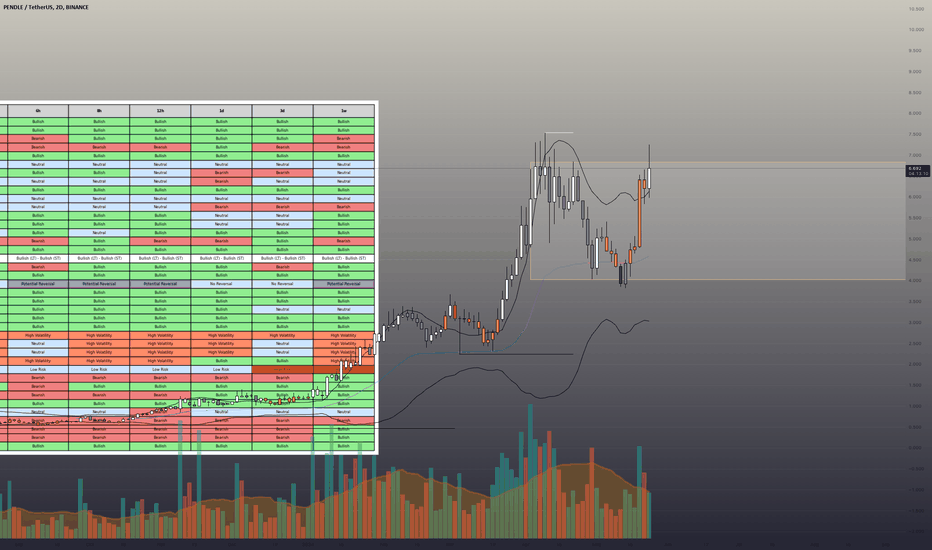
Chart Analysis Take a look at the 2D chart for PENDLEUSDT , and you'll notice that it's been forming a beautiful Bullish Flag pattern 🏔️. This is an incredibly bullish sign, as it indicates that the market has been consolidating its gains after a significant uptrend 💥. The flagpole is the upward trendline that formed during the initial surge, while the flag itself represents the recent consolidation phase 🔀. The significance of this chart pattern lies in the fact that breaks above the upper trendline (resistance) often lead to further price increases 🚀. As we approach the upper trendline, I believe it's highly likely that it will break out and continue its upward momentum 💥. Technical Indicator Analysis Some highlights from my screener: Momentum: - 15m to 6h: Indicators such as StochRSI, Stochastic, and Williams%R are showing bullish signals. - 12h to 1w: These momentum indicators continue to show bullish trends, except RSI and Williams%R which show slight bearishness over longer timeframes. Trend: - 1h to 1d: Most trend indicators like Aroon, EMA, MACD, and Ichimoku Cloud show bullish signals. However, DPO shows mixed signals in some shorter timeframes. - 1w: All trend indicators show bullish signals, affirming a positive long-term trend. Volatility: - 15m to 1d: High volatility is indicated by ATR and Bollinger Bands. - 1w: Volatility decreases, indicating potential price stabilization in the near future. Volume: - Short-term: Volume indicators like OBV and VWAP show bearish signals in the short term. - Long-term: These indicators turn bullish over longer timeframes, indicating volume accumulation in the long-term uptrend. Positive Signals - The Bullish Flag pattern suggests a potential strong price increase after breaking resistance. - Long-term trend and momentum indicators are bullish. Risks - High short-term volatility might cause slight corrections before the uptrend resumes. - Some short-term momentum indicators like RSI and Williams%R show neutral or bearish signals. Predictions - Short-term (1 week) : Price might experience slight corrections but the overall trend remains upward. - Medium-term (1 month) : If the price breaks out of the Bullish Flag, a strong upward movement is expected. - Long-term (3-6 months) : The long-term uptrend is likely to continue, supported by trend and volume indicators. Conclusion As always, it's essential to remember that trading involves risk 🚨. However, if my analysis is correct, I believe #pendle/usdt has tremendous upside potential 💥. Patience and careful risk management will be crucial in the coming days 👀. Disclaimer 🔜 DYOR (Do Your Own Research) before making investment decisions! 🔓 #PENDLE #BullishFlag #BreakoutAlert
crypto_pumpppp
BNB, wait wait wait

All we need to wait for the price accumulate more, it needs to break the yellow range, then the trendline. If the price break the yellow range, I will buy to catch the next wave...So far so good!Did you add it to your bag?
crypto_pumpppp
FLOKI
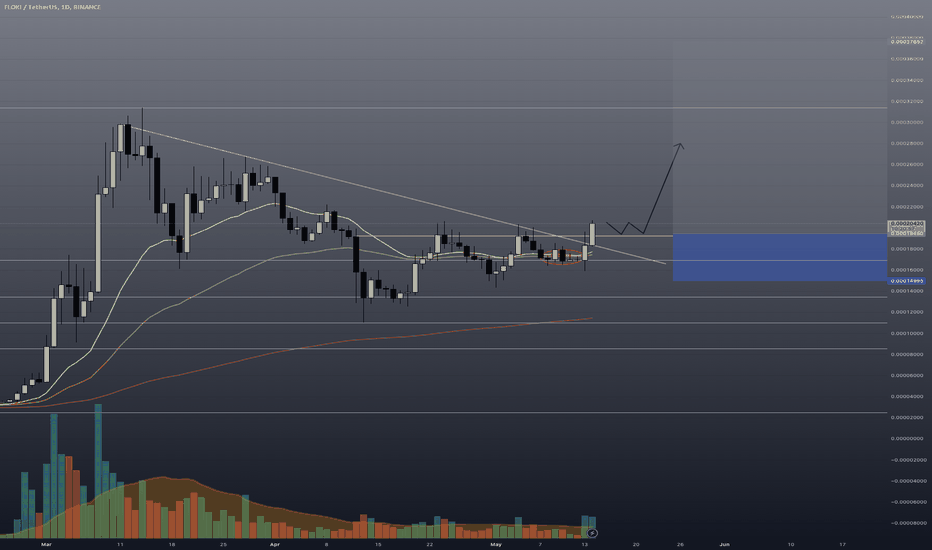
FLOKI, a bit late but I think it hasn't accumulated enough. It's better to wait for it back to the white line, accumulate more and fly. Or we can buy 50% position if you're afraid of missing this chance lol From my side, I'm just afraid of losing my money. Then I will waitStop loss below the bullish candle. No lossClose half!! Tp1 done, right?
crypto_pumpppp
HBAR, looking good!

HBARUSDT We have a trendline here, expecting a breakout I bought some! Big move soon.. DYOR
crypto_pumpppp
BTC, what's next!?
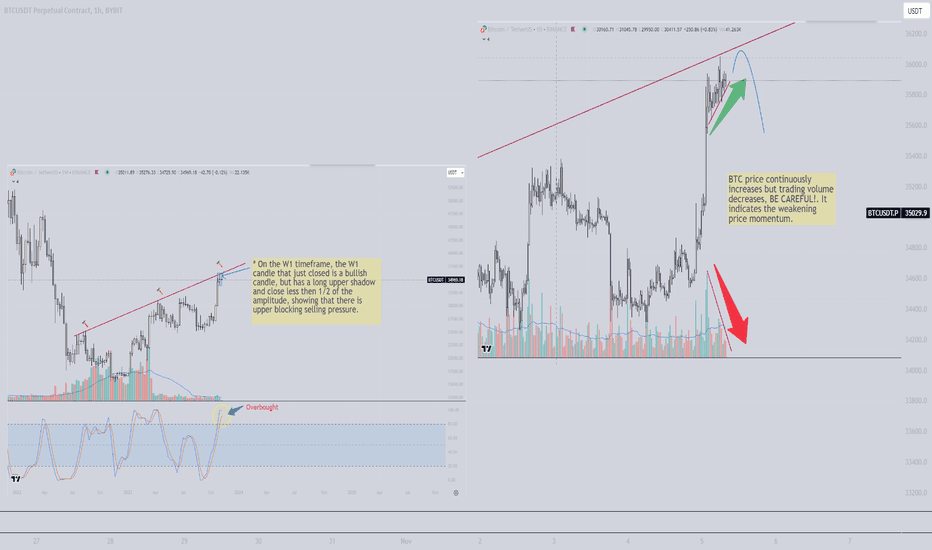
BTCUSDT --------- Folks, here is my possible plan for BTC. -- On the weekly timeframe, the candle that just closed is a BULLISH candle, but has a LONG UPPER SHADOW and closed less than 1/2 of the amplitude, showing that there is a string upper blocking selling pressure -- On the daily timeframe, BTC price continuously increases but trading volume decreases. BE CAREFUL! . It indicates the weakening price momentum. -- My trading idea is: 1. Wait patiently for the price to return to the 35600 - 35750, that has an order block. (See my short term plan on 4H timeframe attached below) 2. Find the confirmation entry. 3. SHORT it. --------- That's my plan! Thanks for reading this. DYOR
crypto_pumpppp
BTC, very short-term trading plan!!!

BTCUSDT ----------------- This is my very short-term trading plan that you can consult. Please do your own research before making your trading decision. Checkout my plan on weekly and daily that attached below. ---- I want to SHORT at the redzone. I will post the detailed setup later when the price touch the redzone. Remember, dont try to catch the top when you place an SHORT position, the bottom when LONG. All you need is the confirmation. Your money needed to be safe first. -- Thanks for reading. DYORPrice is reached to the SELL ZONE, let's find the CE guys!
crypto_pumpppp
LONG LDO?
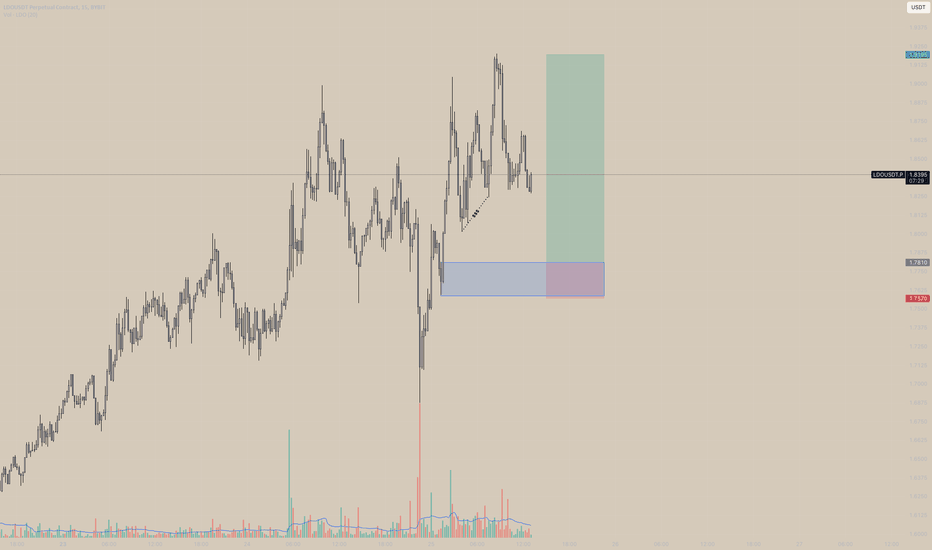
LDOUSDT.P looking good! --- I set a pos here. LONG LDO Entry: around 1.781 Stoploss: 1.757 TP1: 1.86; TP2: 1.9; --- Handle your risks, if you dont know, try to check my post below. DYORBTC's correction!! Safety first. Closed. I will reopen later if I found CE in the LTF. Follow me!
Disclaimer
Any content and materials included in Sahmeto's website and official communication channels are a compilation of personal opinions and analyses and are not binding. They do not constitute any recommendation for buying, selling, entering or exiting the stock market and cryptocurrency market. Also, all news and analyses included in the website and channels are merely republished information from official and unofficial domestic and foreign sources, and it is obvious that users of the said content are responsible for following up and ensuring the authenticity and accuracy of the materials. Therefore, while disclaiming responsibility, it is declared that the responsibility for any decision-making, action, and potential profit and loss in the capital market and cryptocurrency market lies with the trader.