Technical analysis by crypto_pumpppp about Symbol KAVA on 5/27/2024

crypto_pumpppp
✨ KAVAUSDT: Bullish Breakout Anticipated After Consolidation
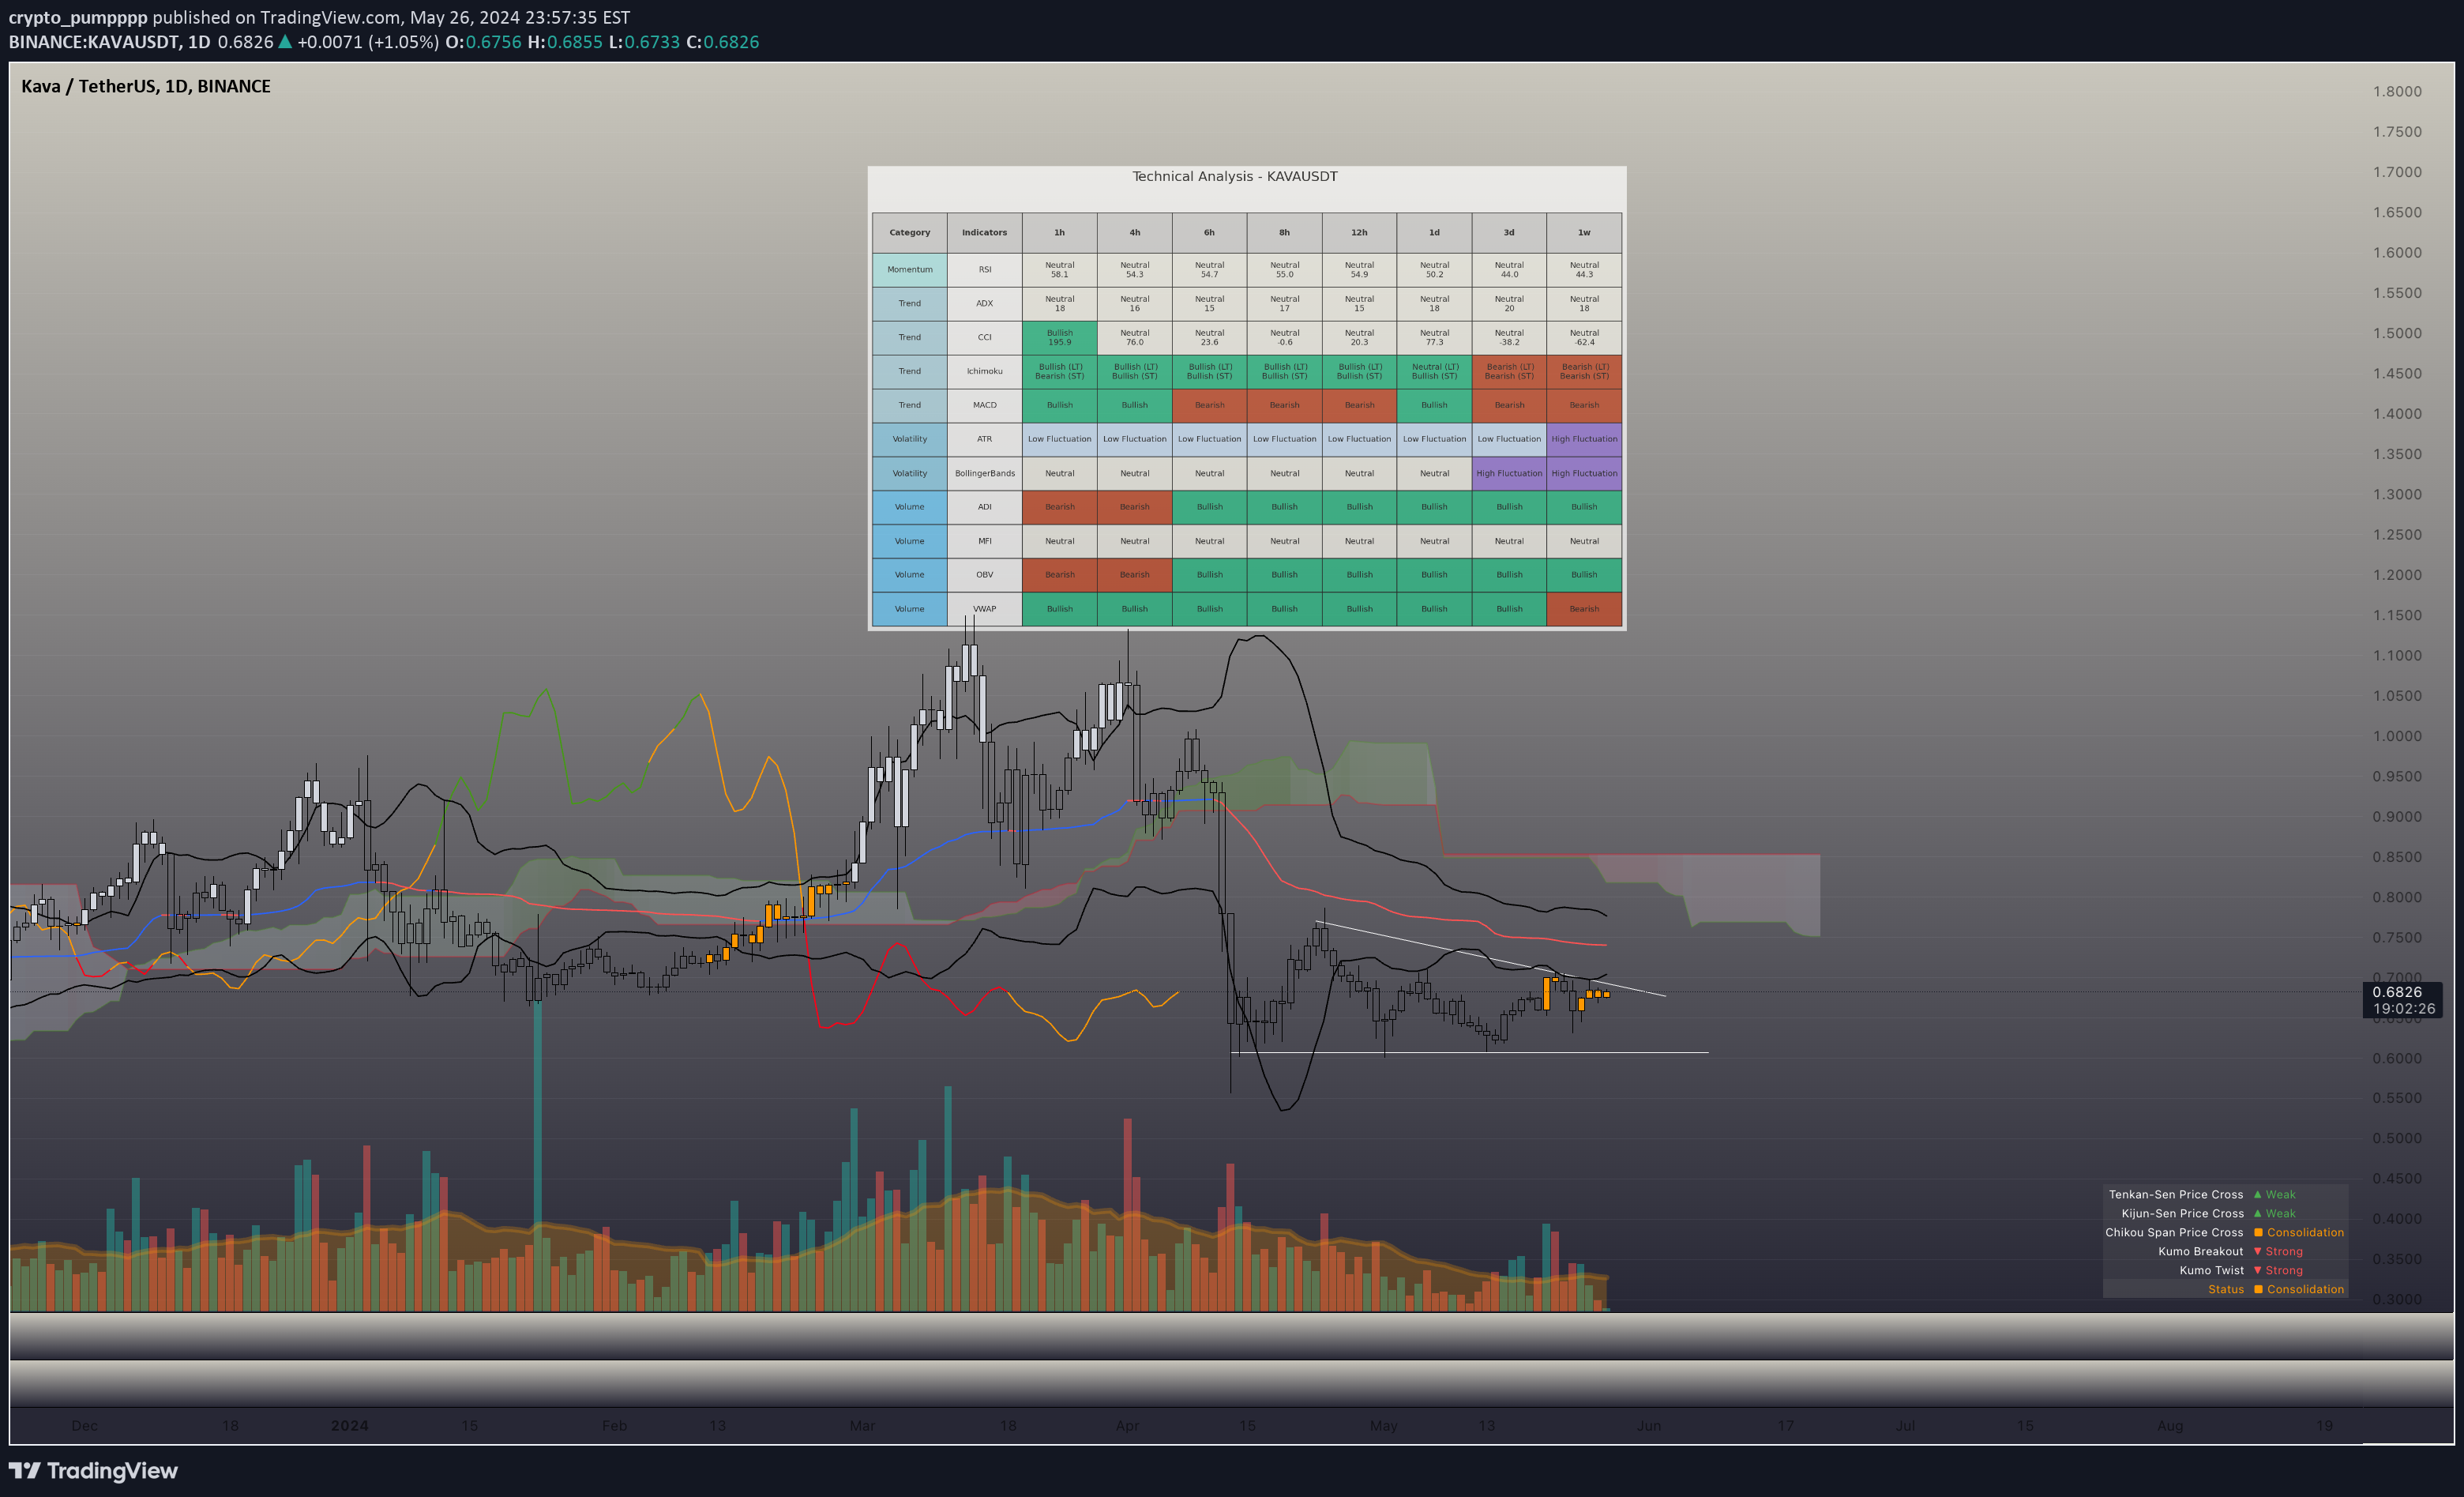
📊 Chart Analysis : The KAVAUSDT 1D chart indicates a potential bullish breakout following a period of consolidation. The downtrend line drawn from early April has been tested multiple times, with the price now approaching a breakout point. The key aspects of this chart include: - Resistance Level: The downward trendline around $0.68, acting as a significant resistance. - Potential Target: Based on the breakout projection, the target price is around $0.83, indicating a potential upside of approximately 25%. - Volume: A spike in volume upon breaking the trendline will confirm the breakout and strengthen the bullish case. 🔍 Technical Indicator Analysis : Analyzing the technical indicators across different timeframes reveals mixed signals but a generally bullish outlook in the short to mid-term. Momentum: - RSI: Neutral across all timeframes, indicating neither overbought nor oversold conditions, with a slight bullish bias in the short term (1h at 58.1). Trend: - ADX: Mostly neutral, indicating a lack of strong trend strength currently. - CCI: Bullish in the short term (1h at 195.9), but turns neutral or slightly bearish in longer timeframes. - Ichimoku: Bullish in the short to mid-term (up to 12h), indicating a positive trend development. However, it turns bearish in the longer term (3d, 1w). - MACD: Bullish in the short term but turns bearish in the mid to long term (6h to 1w). Volatility: - ATR: Low fluctuation across most timeframes, indicating low volatility and potential for a breakout. - Bollinger Bands: Neutral in the short term but high fluctuation in the longer term, suggesting increasing volatility. Volume: - ADI, OBV, VWAP: ADI and OBV show bearish signals in the short term but turn bullish in the longer term, indicating accumulation. VWAP remains bullish across most timeframes. 🔮 Prediction : Short-term (1h - 4h): Expect a bullish movement as indicated by the bullish MACD and CCI. Mid-term (6h - 12h): Continued bullish momentum is likely, supported by bullish Ichimoku and ADI indicators. Long-term (3d - 1w): Caution is advised as longer-term indicators suggest potential bearish trends and high fluctuation volatility. 📝 Conclusion : KAVAUSDT is positioned for a potential bullish breakout following a period of consolidation. Short to mid-term indicators favor upward movement, while longer-term signals urge caution due to potential bearish trends and increased volatility. 💡 Final Call : - Watch for a breakout above $0.68 ~ $0.69 with increased volume for confirmation. - Monitor key support at $0.58 and resistance at $0.65. - Prepare for potential volatility and manage risk appropriately. - Remember, Patience is the key in trading. 🙏 Thank You : Thank you for reading this analysis. Always conduct your own research (DYOR) and make informed trading decisions. Happy trading! #TechnicalAnalysis #KAVAUSDT #CryptoTrading #BullishBreakout #Cryptocurrency