Technical analysis by crypto_pumpppp about Symbol PENDLE: Buy recommendation (5/25/2024)

crypto_pumpppp
$PENDLE, Breakout Alert! 🚨
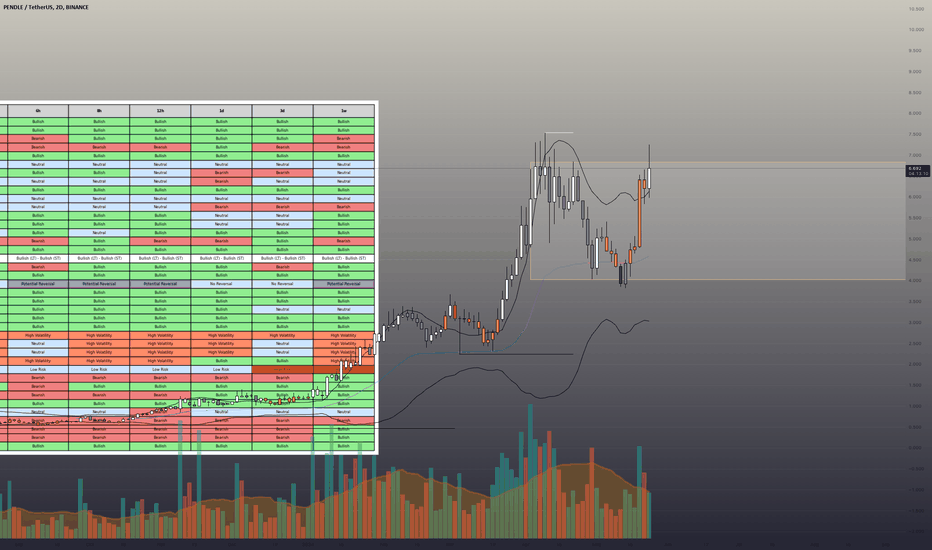
Chart Analysis Take a look at the 2D chart for PENDLEUSDT , and you'll notice that it's been forming a beautiful Bullish Flag pattern 🏔️. This is an incredibly bullish sign, as it indicates that the market has been consolidating its gains after a significant uptrend 💥. The flagpole is the upward trendline that formed during the initial surge, while the flag itself represents the recent consolidation phase 🔀. The significance of this chart pattern lies in the fact that breaks above the upper trendline (resistance) often lead to further price increases 🚀. As we approach the upper trendline, I believe it's highly likely that it will break out and continue its upward momentum 💥. Technical Indicator Analysis Some highlights from my screener: Momentum: - 15m to 6h: Indicators such as StochRSI, Stochastic, and Williams%R are showing bullish signals. - 12h to 1w: These momentum indicators continue to show bullish trends, except RSI and Williams%R which show slight bearishness over longer timeframes. Trend: - 1h to 1d: Most trend indicators like Aroon, EMA, MACD, and Ichimoku Cloud show bullish signals. However, DPO shows mixed signals in some shorter timeframes. - 1w: All trend indicators show bullish signals, affirming a positive long-term trend. Volatility: - 15m to 1d: High volatility is indicated by ATR and Bollinger Bands. - 1w: Volatility decreases, indicating potential price stabilization in the near future. Volume: - Short-term: Volume indicators like OBV and VWAP show bearish signals in the short term. - Long-term: These indicators turn bullish over longer timeframes, indicating volume accumulation in the long-term uptrend. Positive Signals - The Bullish Flag pattern suggests a potential strong price increase after breaking resistance. - Long-term trend and momentum indicators are bullish. Risks - High short-term volatility might cause slight corrections before the uptrend resumes. - Some short-term momentum indicators like RSI and Williams%R show neutral or bearish signals. Predictions - Short-term (1 week) : Price might experience slight corrections but the overall trend remains upward. - Medium-term (1 month) : If the price breaks out of the Bullish Flag, a strong upward movement is expected. - Long-term (3-6 months) : The long-term uptrend is likely to continue, supported by trend and volume indicators. Conclusion As always, it's essential to remember that trading involves risk 🚨. However, if my analysis is correct, I believe #pendle/usdt has tremendous upside potential 💥. Patience and careful risk management will be crucial in the coming days 👀. Disclaimer 🔜 DYOR (Do Your Own Research) before making investment decisions! 🔓 #PENDLE #BullishFlag #BreakoutAlert