
cnote56
@t_cnote56

What symbols does the trader recommend buying?
Purchase History
پیام های تریدر
Filter
cnote56
Sometimes I'm wrong - XRP breaking hearts and banks

We clearly see a breakdown from the prior Elliot Wavew counts. I must admit I was wrong with my optimism. Regardless, the breakdown does conform with many of the more prolonged timeline pressures for XRP (See ISO20022 SWIFT CBRP+ Timeline ). Regardless, this is a good thing. The opportunities to fill bags at these prices may never be seen once cross-border payments no longer rely on correspondent banking. While the onboarding of the unbanked is my real catalyst for growth in the long term, I am very confident that once the transition period closes, we will see a lot of utility pour into the XRPL, and the native token will be highly desirable for liquidity pools, and greasing the wheels of smart contracts. Takeaway: Ethereum is going to have a lot of competition very soon. So, we clear this chart off and start counting again to find where in the wave theory we are floating. Stay frosty and fill a bag if you have the means. NFA; DYOR.
cnote56
Has TON topped?

TON has SOARED in this bill run, but have we seen the top? I think so and the added distribution of tokens as ad revenue from Telegram is going to put a lot of selling pressure on the token. Maybe we see 2.5 as the bottom. It we gotta a ways to drop until then.
cnote56
FLARE pressing the MAX PAIN button before LIFFOFF? Or SELLOFF?
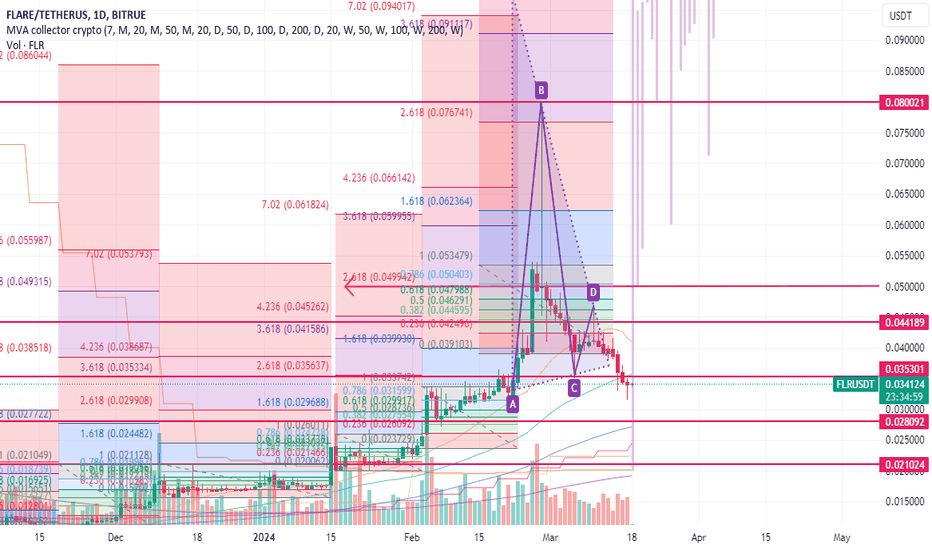
There is a concept in cryptocurrency trading... "Max Pain." But first, we have to understand a Bull Flag Pattern . In the context of a highly volatile cryptocurrency marketplace, a **bull flag pattern** is a significant indicator in technical analysis ⁶⁷⁸. This pattern is typically formed during an uptrend and is considered a continuation pattern, suggesting that the price is likely to continue rising ⁶⁷⁸. The bull flag pattern consists of two main components: the **pole** and the **flag**⁶⁷⁸. The pole represents a robust upward price movement, while the flag represents a period of consolidation or sideways price movement ⁶⁷⁸. When a bull flag pattern is identified, and the sellers' pressure is exhausted, it often indicates a potential upward breakout⁶⁷⁸. This is because the consolidation period (the flag) allows for the accumulation of buyers, and once this period ends, the buying pressure can push the price upwards⁶⁷⁸. The expected outcome, based on the history of candlestick chart patterns, is that the price will continue upwards roughly the length of the pole⁶. This is known as the measured height method ⁶. However, if the support of the bull flag is breached, it indicates that the pattern is invalid and a continuation is unlikely⁶. (1) Crypto Trading 101: Bull and Bear Flags (And What They Mean ... - CoinDesk. coindesk.com/learn/crypto-trading-101-bull-and-bear-flags-and-what-they-mean-for-price/. (2) A Comprehensive Guide to the Flag Patterns and How to Trade Bull and .... kucoin.com/learn/trading/guide-to-flag-patterns-and-how-to-trade-bull-and-bear-flags. (3) Bull Flag Pattern: Explaining the Bullish Crypto Indicator. dydx.exchange/crypto-learning/bull-flag. (4) How to Read the Most Popular Crypto Candlestick Patterns. academy.binance.com/en/articles/how-to-read-the-most-popular-crypto-candlestick-patterns. (5) How To Read Crypto Candlestick Charts | Ledger. ledger.com/academy/crypto-candlestick-charts-explained. (6) Bitcoin Real-Time Candlestick Patterns (BRTI) - Investing.com. investing.com/indices/bitcoin-real-time-candlestick. (7) How To Read Crypto Candlestick Charts - Easy Tricks To Understanding .... cryptowhat.com/blog/how-to-read-crypto-candlestick-charts/. (8) 16 Types of Candlestick Patterns in Crypto. site.zenledger.io/blog/candlestick-patterns/. (9) Bull Flag Pattern in Crypto: Meaning and How to Identify - CoinGape. coingape.com/education/bull-flag-pattern-in-crypto-meaning-and-how-to-identify/. (10) Bull Flag Pattern - What Is It? How To Use It?. site.zenledger.io/blog/bull-flag-pattern/. When a bull flag pennant is broken to the downside, it typically indicates a ** failed pattern ** ². This means that the expected upward breakout did not occur; instead, the price has broken through the lower boundary of the pennant². This can signal that the previous upward trend is weakening, and a downward trend may be beginning ². Traders might interpret this as a sell signal, as it suggests that the buying pressure has been overcome by selling pressure². However, it's important to note that technical analysis is not foolproof, and other factors can influence the price movement. Therefore, traders usually use these patterns with other indicators and tools to make more informed trading decisions ². (1) Bull Flag Trading Pattern Explained | TradingSim. tradingsim.com/blog/bull-flag-trading-pattern-explained-tradingsim. (2) Bull Pennant Pattern: What It Is, Indicates, and Examples - Bullish Bears. bullishbears.com/bull-pennants/. (3) Bullish Pennant Pattern - New Trader U. newtraderu.com/2020/07/25/bullish-pennant-pattern/. (4) How To Trade The Bull Pennant Pattern - HowToTrade.com. howtotrade.com/chart-patterns/bull-pennant-pattern/. (5) Learn about Bull Flag Candlestick Pattern | ThinkMarkets | UK. thinkmarkets.com/uk/learn-to-trade/indicators-and-patterns/bullish-patterns/bull-flag-pattern/. MAX PAIN. "Max Pain" is a term used in options trading to describe a situation where the market price of particular securities close to expiration tends to expire worthless². This is based on the Maximum Pain Theory, which states that there will be a maximum loss to investors who buy and hold option contracts until the expiration date². The concept of Max Pain is derived from the observation that the price of an underlying stock tends to gravitate towards its "maximum pain strike price"—the price where the most significant number of options (in dollar value) will expire worthless¹. This is the strike price with the most open options contracts (i.e., puts and calls), and it is the price at which the stock would cause financial losses for the largest number of option holders at expiration¹. The Maximum Pain theory works under the assumption that near the expiration date, buying and selling stock options leads to price movements towards the point of maximum pain, or market makers manipulate price indices to gain more from the closing stock price². The calculation of the Max Pain point involves the summation of the dollar values of outstanding put and call options for each in-the-money strike price¹. For each in-the-money strike price for both puts and calls, you find the difference between the stock price and strike price, multiply the result by open interest at that strike, and add the dollar value for the put and call at that strike¹. However, it's important to note that the Maximum Pain Theory is somewhat controversial. Critics are divided on whether the maximum pain behavior of the close stock prices occurs by chance or is a matter of market manipulation². (1) Max Pain (Options) - Overview, How It Works, Calculation. corporatefinanceinstitute.com/resources/derivatives/max-pain-options/. (2) Max Pain Explained: How It's Calculated, With Examples - Investopedia. investopedia.com/terms/m/maxpain.asp. (3) What Is Max Pain in Options Trading? | SoFi. sofi.com/learn/content/max-pain-options/.
cnote56
Elliot Waves and Fibs... crash or rocket launch for XRP?

I've counted off a possible 5th impulse wave for XRP. I'm also studying Elliot Waves and have gathered a few high-level points to keep in mind while we watch this bull market germinate. The Elliott Wave Principle, is a technical analysis theory that describes the movement of financial market prices based on investor psychology and natural patterns. 1. The Elliott Wave Principle states that market movements are patterned and governed by the psychology of crowds, following a specific structure of impulsive (motive) and corrective waves. 2. Impulsive waves occur in a 5-wave pattern with waves 1, 3, and 5 being in the direction of the main trend and waves 2 and 4 being counter-trend corrections. 3. Corrective waves occur in 3 waves and can take the form of zigzags, flats, or triangles. They often alternate in pattern between sharp (zigzag) and sideways (flat or triangle). 4. The patterns are fractal, meaning they occur on all degrees of trend from smallest to largest time frames. 5. Wave personalities, Fibonacci relationships, volume, channeling guidelines, and other technical rules help identify the specific waves and forecast future movements. The Elliott Wave Theory, developed by Ralph Nelson Elliott in the 1930s, is a fascinating approach to understanding price movements in financial markets. Impulse Waves: Impulse waves consist of five sub-waves that move in the same direction as the trend of the next-largest degree. These waves represent the strongest part of a trend. Impulse waves are often labeled as 1, 2, 3, 4, and 5. They are nested within a self-similar fractal, creating larger patterns. Corrective Waves: Corrective waves oppose the larger trend and aim to correct the preceding impulse waves. They come in various forms, including zigzags, flats, triangles, etc. Here are more specific corrective wave patterns: Zigzag: Wave B in a zigzag typically retraces 38% to 79% of wave A. If wave B is a running triangle, it usually retraces 10% to 40% of wave A. If wave B is a zigzag, it typically retraces 50% to 79% of wave A. When wave B is a triangle, it usually retraces 38% to 50% of wave A. Flat: In a flat correction: Wave B must retrace at least 90% of wave A (a strict rule). Wave B usually retraces between 100% and 138% of wave A. Wave C is usually 100% to 165% as long as wave A. An expanded flat occurs when wave B is more than 105% as long as wave A, and wave C extends beyond the end of wave A. Expanding Triangle: Subwaves B, C, and D in an expanding triangle: Each retraces at least 100% but no more than 150% of the previous subwave. Usually, they retrace 105% to 125% of the preceding subwave
cnote56
FLARE Posting up on a nice Bull-Flag Pattern
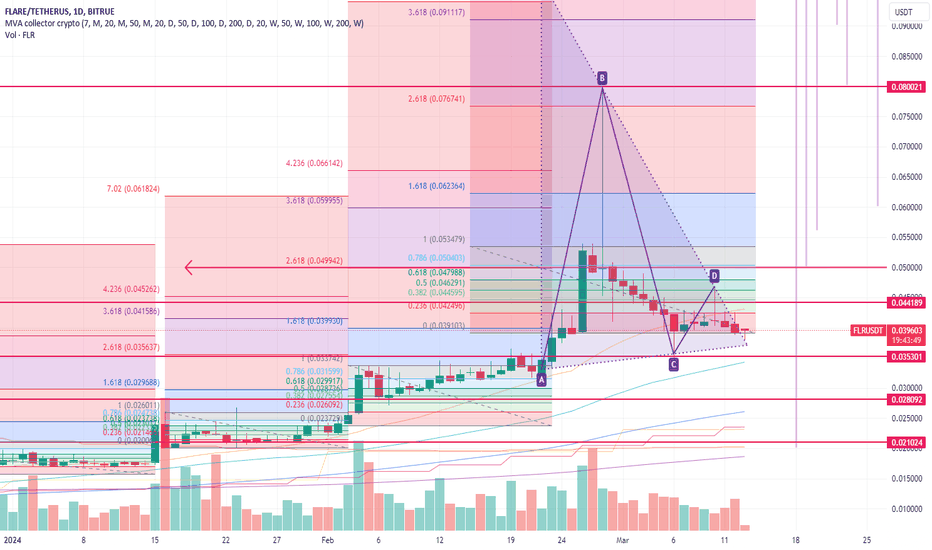
Let's explore the fascinating world of **bull flag patterns** in the context of highly volatile assets like cryptocurrencies. **What Is a Bull Flag Pattern?** - A **bull flag pattern** is a technical chart pattern that appears during an **uptrend** . - It consists of two main components: - **Flagpole** : A steep rise in price (represented by long green candlesticks). - **Flag**: A consolidation phase with shorter red and green candlesticks forming a flag shape. - The flag section is either **horizontal or slightly downtrending** . - **Volume** : Traditionally, a bull flag has **higher volume** during the flagpole stage and **decreasing volume** during consolidation. - **Breakout**: If the pattern plays out as expected, the flag eventually breaks the top resistance level and continues its upward movement. **Expected Outcomes of a Bull Flag Pattern**: - **Continuation Pattern** : Bull flags are considered **continuation patterns** because they indicate a brief pause (consolidation) within an overall bullish trend. - **Bullish Bias**: Traders typically enter **long positions** during the flag phase, expecting further upward price movement. - **Profit Opportunity**: The goal is to profit from buying during consolidation and leveraging the next price spike. - **Measured Move**: The distance from the start of the flagpole to the top of the flag can be used to estimate the potential price target after the breakout. **Trading Considerations**: - **Entry Signal**: Traders use bull flag patterns as an **entry signal** to buy assets they believe will continue the uptrend. - **Momentum Traders**: Bull flags are popular among **momentum traders** who seek assets with upside potential. - **Timing**: Entering during the flag phase or as a new breakout begins with higher volume can be effective. **Example**: - Suppose Bitcoin forms a bull flag on the daily chart. - If the breakout occurs as expected, the measured move could see Bitcoin shoot up significantly from the lowest area of the flag pattern. Remember that while bull flags provide valuable insights, they are only sometimes accurate. Traders should combine technical patterns with other indicators and risk management strategies for informed decision-making. 🚀📈 For more detailed analysis, consult real-time charts and consider other factors influencing the crypto market! 🌐 (1) Bull Flag Pattern in Crypto: Meaning and How to Identify - CoinGape. coingape.com/education/bull-flag-pattern-in-crypto-meaning-and-how-to-identify/. (2) . bing.com/search?q=expected+outcome+of+bull+flag+pattern+in+cryptocurrency. (3) Bull Flag Pattern: Explaining the Bullish Crypto Indicator. dydx.exchange/crypto-learning/bull-flag. (4) Bitcoin Bangs Out A Bull Flag Pattern: A Technical Look At The .... benzinga.com/markets/cryptocurrency/21/08/22282642/bitcoin-bangs-out-a-bull-flag-pattern-a-technical-look-at-the-cryptocurrency. (5) A Comprehensive Guide to the Flag Patterns and How to Trade Bull and .... kucoin.com/learn/trading/guide-to-flag-patterns-and-how-to-trade-bull-and-bear-flags. (6) Spotting a Bull Flag Pattern | SimpleSwap. simpleswap.io/blog/spotting-a-bull-flag-pattern. (7) undefined. cointelegraph.com/news/what-is-a-bull-flag-chart-pattern-and-how-to-spot-it. (8) undefined. beincrypto.com/learn/bull-flag/.
cnote56
XRP dancing on the FIBONACCI ceiling?

Is this Fibonacci sequence level a ceiling or a floor for XRp? Are we dancing, or will this become a wake for higher prices? **Fibonacci retracement levels** are essential tools traders use to analyze stock prices. **What Are Fibonacci Retracement Levels?** - **Fibonacci retracement levels** stem from the **Fibonacci sequence**, a set of numbers discovered by mathematician Leonardo Pisano (nicknamed Fibonacci) in the 13th century. - These horizontal lines indicate where **support** (floor) and **resistance** (ceiling) are likely to occur in stock prices. - The key Fibonacci ratios used for retracement levels are: - **23.6%** - **38.2%** - **50%** - **61.8%** - **78.6%** **How Are Fibonacci Retracement Levels Calculated?** - Start by identifying two extreme points on a stock chart (usually a peak and a trough). - Divide the **vertical distance** between these points by the key Fibonacci ratios. - Once these levels are identified, horizontal lines are drawn across the chart. - These levels serve as potential areas where price may **bounce** (support) or **reverse** (resistance). **Why Do Fibonacci Ratios Work?** - The Fibonacci sequence (0, 1, 1, 2, 3, 5, 8, 13, 21, 34, 55, 89, 144, etc.) has a unique property: each number is approximately **1.618 times greater** than the preceding number. - This relationship forms the foundation of the ratios used by traders. - Examples: - **61.8%**: Divide one number in the series by the next (e.g., 21 divided by 34). - **38.2%**: Divide a number by the one located two spots to the right (e.g., 55 divided by 144). - **23.6%**: Divide a number by the one three places to the right (e.g., 8 divided by 34). **Application in Stock Trading**: - **Predicting Reversals**: Fibonacci retracement levels help determine critical points where price momentum may reverse. - **Support and Resistance** : These levels act as potential support (floor) or resistance (ceiling) zones. - **Profit Targets and Stop-Loss Orders** : Traders use these levels to set profit targets or place stop-loss orders. **Limitations**: - While Fibonacci retracements are widely used, they should be **combined with other indicators* * for more accurate analysis. - Remember that market behavior is influenced by various factors, not just Fibonacci ratios. In summary, Fibonacci retracement levels provide valuable insights into stock price movements, acting as ceilings and floors. Traders use them strategically to make informed decisions. (1) . bing.com/search?q=Fibonacci+levels+in+stock+prices. (2) What Are Fibonacci Retracements and Fibonacci Ratios? - Investopedia. investopedia.com/ask/answers/05/fibonacciretracement.asp. (3) Fibonacci Retracement in Stocks - HowToTrade.com. howtotrade.com/courses/trading-with-popular-stock-indicators/fibonacci-in-stocks/. (4) What Are Fibonacci Retracement Levels, and What Do They Tell You?. investopedia.com/terms/f/fibonacciretracement.asp. (5) undefined. stockstotrade.com/fibonacci-sequence-stocks/. (6) undefined. investopedia.com/articles/active-trading/091615/how-set-fibonacci-retracement-levels.asp.
cnote56
BTC Not done yet?

Is BTC finding its top at the end of the ride, and now the market rollercoaster starts? Are we about to see a sell-off and a retracement period? Let's delve into the fascinating world of market cycles, especially in highly volatile asset classes where all-time highs (ATHs) have recently been reached. 1. **Volatility Cycles and Behavior** : - **Volatility** refers to the variations in market prices. The more an asset's price moves, the higher the volatility; conversely, less movement results in lower volatility. - **Volatility spikes** often occur across major financial markets. These spikes share common characteristics despite arising from different reasons and markets. - A typical **volatility event cycle** unfolds as follows: - **Build-up Period**: Before a volatility spike, volatility gradually rises. This hints at potential market dislocation. - **Sudden Spike** : Volatility then experiences a vertical surge, reaching a climax. - **Normalization Phase** : After the spike, volatility reverses and gradually normalizes, albeit with bumps. 2. **Cryptocurrencies (e.g., Bitcoin)** : After ATHs, cryptocurrencies often follow a pattern: - Rapid surge beyond the ATH. - Correction and value shedding. - Oscillation with diminishing volatility. - Gradual upside continuation before the next significant event (e.g., halving)³. 3. **Retracement Levels and Fibonacci** : - **Fibonacci retracement levels** help identify potential reversal points on price charts. - Key retracement levels include: - **38.2%**: Often rounded to 38%. - **50%**: Not directly from Fibonacci but widely used. - **61.8%**: Rounded from the Fibonacci sequence. - These levels are applied after an advance (to forecast corrections) or after a decline (to predict counter-trend bounces). - The Fibonacci sequence and the Golden Ratio (1.618) play a crucial role in these retracement levels⁵. - For example, the 38.2% retracement is based on dividing a number by another two places higher, approximating 0.3820. Similarly, the 61.8% retracement is based on dividing by the next highest number, approximating 0.6180⁵. Understanding volatility cycles, asset-specific behavior, and retracement levels can guide investment decisions during highly volatile periods. While each market cycle is unique, historical precedent provides valuable insights. (1) Historical Volatility: A Timeline of the Biggest Volatility Cycles. dailyfx.com/education/volatility/historical-volatility.html. (2) Bitcoin Market Cycles Explained - CoinShares. coinshares.com/research/bitcoin-market-cycles-explained. (3) Fibonacci Retracements [ChartSchool] - StockCharts.com. school.stockcharts.com/doku.php?id=chart_analysis:fibonacci_retracemen. (4) Market Cycles: Understanding Phases, Strategies, and Real-world .... supermoney.com/encyclopedia/market-cycles. (5) Market Cycles: The Key to Maximum Returns - Investopedia. investopedia.com/trading/market-cycles-key-maximum-returns/. (6) Retracement vs. Reversal: What's the Difference? - Investopedia. investopedia.com/articles/trading/06/retracements.asp. (7) What Are Fibonacci Retracement Levels, and What Do They Tell You?. investopedia.com/terms/f/fibonacciretracement.asp.
cnote56
Expect a few profit-takers along the ride! LTC Risk Investment!

LTC looks like it is returning to yesterday's gains, but I see this is just profit-taking, which is just fine. Each investor has their own profit and loss expectations, and I'm glad to see this kinda red getting painted today. So, let's look at what it means to be an investor in a highly volatile asset class such as crypto. Investors need effective strategies to manage risk and potentially profit in highly volatile markets and with assets that experience rapid price swings. Here are some key concepts and strategies: 1. **Diversification** : **Spread your investments** across different assets (stocks, bonds, real estate, etc.) to reduce risk. Highly concentrated portfolios can be risky, so diversification helps mitigate losses during market turbulence¹. 2. **Risk Profile Assessment** : Be honest about your **risk tolerance**. Understand how much risk you're willing to take with your money. Some investors thrive on volatility, while others prefer stability. Knowing your risk appetite is crucial¹. 3. **Long-Term View** : **Avoid knee-jerk reactions** to short-term volatility. Taking a long-term perspective allows you to ride out market fluctuations and benefit from overall growth¹. 4. **Protective Strategies** : - **Put Options**: Consider buying **protective put options**. These allow you to hedge against downside losses. For example, you can buy put options on individual stocks or broader indices like the S&P 500³. - **Stop-Loss Orders** : Set **stop-loss orders** to automatically sell assets when prices fall by a certain amount. However, be aware of taxable events and the impact on your portfolio³. 5. **Volatility Trading**: - **Volatility Index Options**: Derivative contracts can be used to build strategies to profit from volatility. Explore options like **straddle** and **strangle** positions, as well as futures⁴. Volatility-Based Strategies: Some traders focus on assets with consistent volatility or large daily movements. Volatility can be an opportunity if managed effectively¹⁷. Remember that volatility and risk are related but distinct concepts. Volatility measures price swings, while risk refers to the possibility of losing your investment. By understanding both, you can tailor your strategies to navigate volatile markets effectively. (1) 4 Proven Investing Principles for Volatile Markets | Kiplinger. kiplinger.com/article/investing/t047-c032-s014-4-proven-investing-principles-for-volatile-markets.html. (2) Investment Strategies for Extremely Volatile Markets - Investopedia. investopedia.com/articles/trading/08/strategies-for-volatile-market.asp. (3) How to Profit from Volatility - Investopedia. investopedia.com/articles/active-trading/040515/how-profit-volatility.asp. (4) undefined. cmcmarkets.com/en-gb/trading-guides/volatility-trading. (5) . bing.com/search?q=profit-taking+strategies+for+investors+in+highly+volatile+markets+and+assets. (6) 5 Strategies for Trading Volatility With Options - Investopedia. investopedia.com/articles/investing/021716/strategies-trading-volatility-options-nflx.asp. (7) Four Ways to Navigate the Bumps of Today’s Volatile Market. kiplinger.com/investing/ways-to-navigate-a-volatile-market. (8) undefined. quantifiedstrategies.com/volatility-trading-strategies/. (9) undefined. schwab.com/learn/story/how-traders-can-take-advantage-volatile-markets.
cnote56
What a lovely day for a breakout!

Somebody call the Law! WE GOT A BREAKOUT!!!! We'll need to see a confirmation candle print on this tomorrow and stay afloat above $0.70, but perhaps we're seeing the first stage of the rocket spark and rumble. I'm hopeful we can hold on to this territory, and then we'll see a lot of the XRPLverse gain traction as well.
cnote56
ALGO hitting an IMPULSE WAVE?

Could the Altcoin season just be getting interesintg with ALGORAND running into an impulse wave? Let's talk about Elliot Waves. Certainly! **Elliott Wave Theory** is a fascinating approach to technical analysis that identifies recurrent long-term price patterns based on changes in investor sentiment and psychology. Let's delve into the key concepts: 1. **What is Elliott Wave Theory?** - Named after **Ralph Nelson Elliott**, this theory aims to predict market movements by observing repetitive wave patterns. - Elliott discovered that stock market movements follow specific wave patterns, which he outlined in his book titled *The Wave Principle* in 1938. - The theory combines elements from the **Dow Theory** with the fractal nature of market action. 2. **Basic Principles:** - **Motive Waves (Impulses)**: These waves move in the direction of the trend and consist of five sub-waves labeled 1, 2, 3, 4, and 5. - **Impulse Wave**: A straightforward five-wave move. - **Impulse with Extension**: Similar to an impulse but with an extended fifth wave. - **Leading Diagonal**: A diagonal pattern within an impulse. - **Corrective Waves**: These waves oppose the larger trend and consist of three sub-waves labeled A, B, and C. - **Zigzag**: A common corrective pattern. - **Flat**: A sideways correction. - **Regular Flats**: Standard flat correction. - **Expanded Flats**: A more complex flat correction. - **Running Flats**: A variation of flat correction. - **Triangles**: A consolidation pattern. - **Double Three**: Two corrective patterns combined. - **Triple Three**: Three corrective patterns combined. 3. **Wave Degree and Fractals**: - Elliott Waves exhibit a fractal nature, meaning smaller patterns fit into larger ones. - The Fibonacci relationships between waves enhance anticipation and prediction. - Think of it like broccoli: Smaller pieces resemble the larger piece. 4. **Application**: - Traders use Elliott Wave Theory to identify potential trading opportunities with favorable reward-to-risk ratios. - By understanding these wave patterns, traders can anticipate market moves. Source: Conversation with Bing, 3/1/2024 (1) Impulsive 5 wave structure - Ground Rules | Learn Elliott Wave | Elliott Wave Theory. youtube.com/watch?v=KRmuvKyLH8I. (2) ELLIOTT WAVE THEORY (Part 3): Impulses and Diagonals [Technical Analysis]. youtube.com/watch?v=_y8cHG5P7GI. (3) Elliott Wave Theory for Beginners | ULTIMATE In-Depth Guide!. youtube.com/watch?v=a5tI8CWiRow. (4) Elliott Wave Theory: Rules, Guidelines and Basic Structures. elliottwave-forecast.com/elliott-wave-theory/. (5) Introduction to Elliott Wave Theory - Investopedia. investopedia.com/articles/technical/111401.asp. (6) Elliott Wave Theory - Overview, Types, Market Applications. corporatefinanceinstitute.com/resources/career-map/sell-side/capital-markets/elliott-wave-theory/. (7) Elliott Wave Theory: What It Is and How to Use It - Investopedia. investopedia.com/terms/e/elliottwavetheory.asp.
Disclaimer
Any content and materials included in Sahmeto's website and official communication channels are a compilation of personal opinions and analyses and are not binding. They do not constitute any recommendation for buying, selling, entering or exiting the stock market and cryptocurrency market. Also, all news and analyses included in the website and channels are merely republished information from official and unofficial domestic and foreign sources, and it is obvious that users of the said content are responsible for following up and ensuring the authenticity and accuracy of the materials. Therefore, while disclaiming responsibility, it is declared that the responsibility for any decision-making, action, and potential profit and loss in the capital market and cryptocurrency market lies with the trader.