
cecilion1998
@t_cecilion1998

What symbols does the trader recommend buying?
Purchase History
پیام های تریدر
Filter
Signal Type
cecilion1998
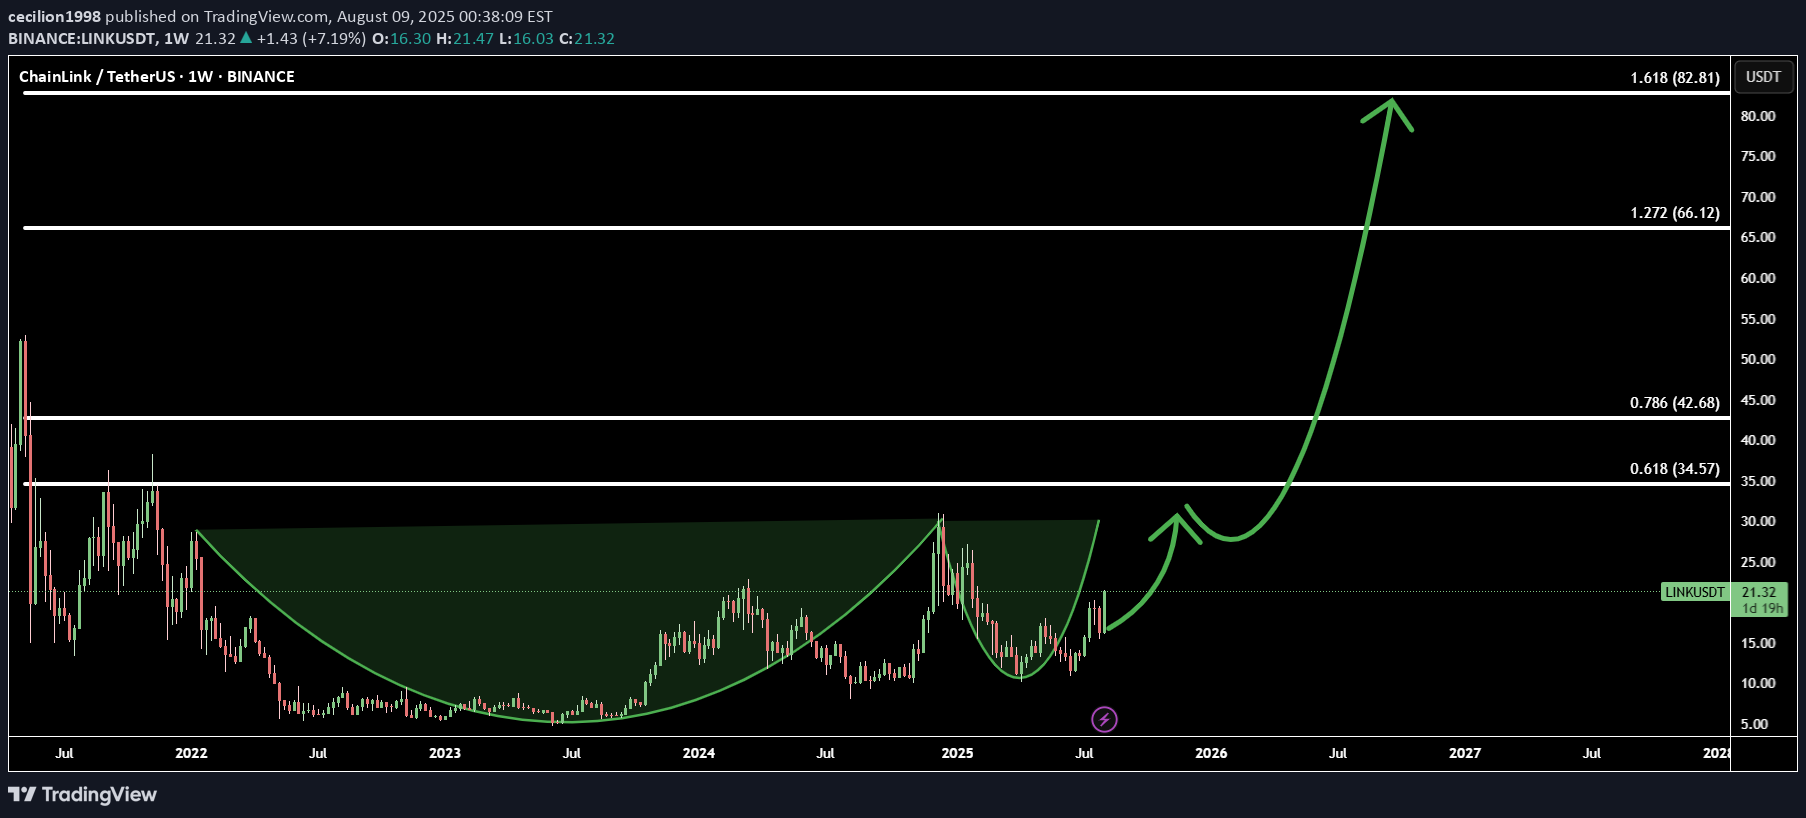
Good luck to everyone who bought the dip — now Chainlink (LINK/USDT) is offering another buy opportunity before the big move. On the chart, LINK has formed a cup & handle pattern — a strong bullish continuation setup that often marks the start of a major rally. This is the beginning of the movement, and price action is aligning perfectly with technical targets. Using Fibonacci extensions, here are the 4 upside targets: Target 1: 0.618 Fib – 34.57 - initial breakout confirmation Target 2: 0.786 Fib – 42.68 - momentum acceleration zone Target 3: 1.272 Fib – 66.12 - extended bullish target Target 4: 1.618 Fib – 82.81 - full potential of the pattern With momentum building and a clean breakout structure, LINK is ready to fly toward these targets.
cecilion1998
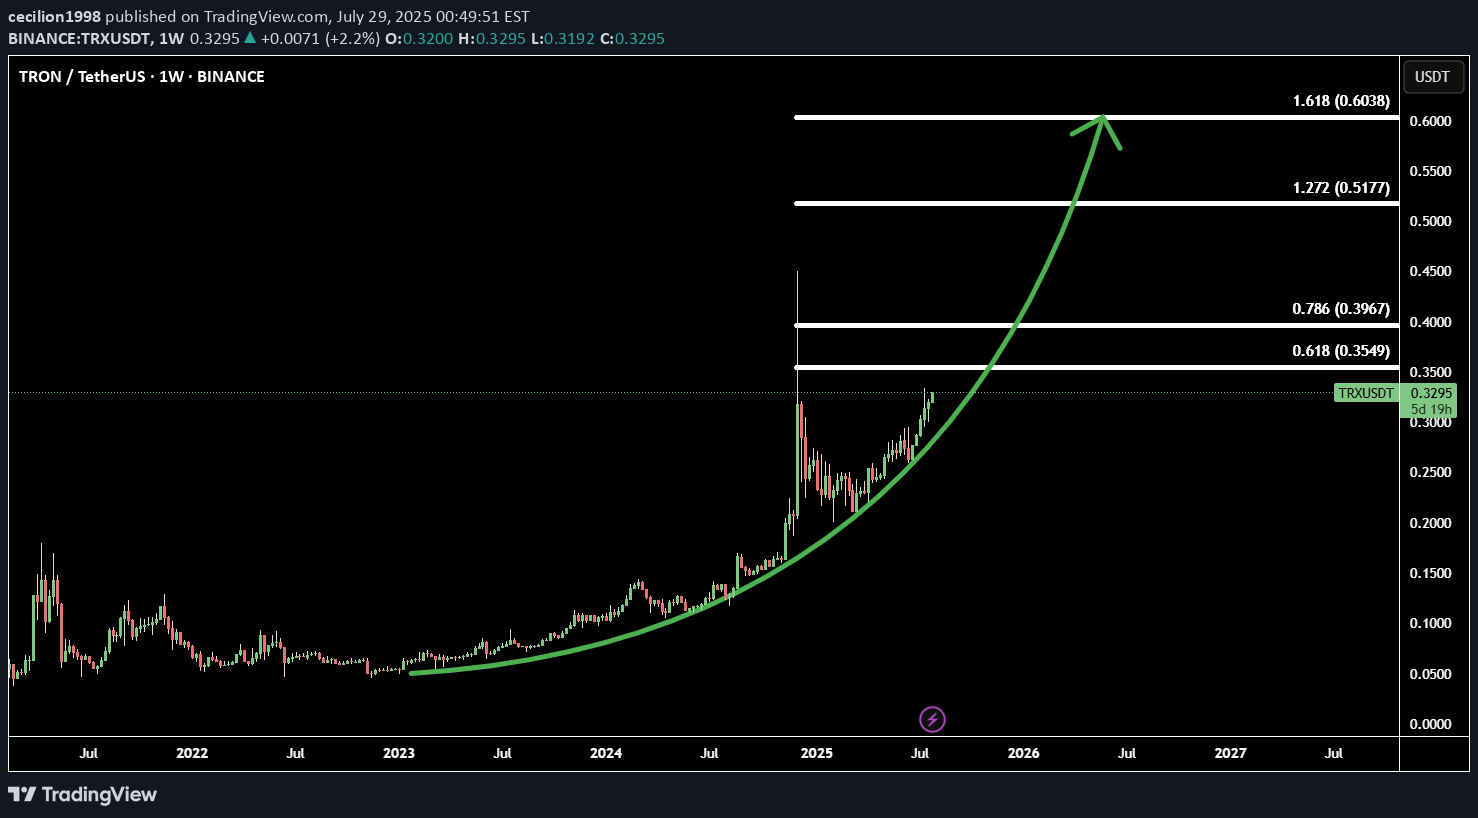
TRX (Tron) is showing early signs of a parabolic breakout, supported by strong momentum and a solid technical structure. After a long accumulation phase, TRX has gained bullish traction and is now accelerating. The price action suggests the beginning of a steep upward curve, often associated with parabolic rallies. Using Fibonacci extensions, we identify 4 bullish targets: Target 1: 0.618 Fib - 0.35 – initial breakout confirmation zone Target 2: 0.786 Fib – 0.39 - key mid-level resistance Target 3: 1.272 Fib – 0.51 - extended bullish target Target 4: 1.618 Fib – 0.60 - full parabolic potential This setup provides a great opportunity for trend traders aiming to ride the wave early.
cecilion1998
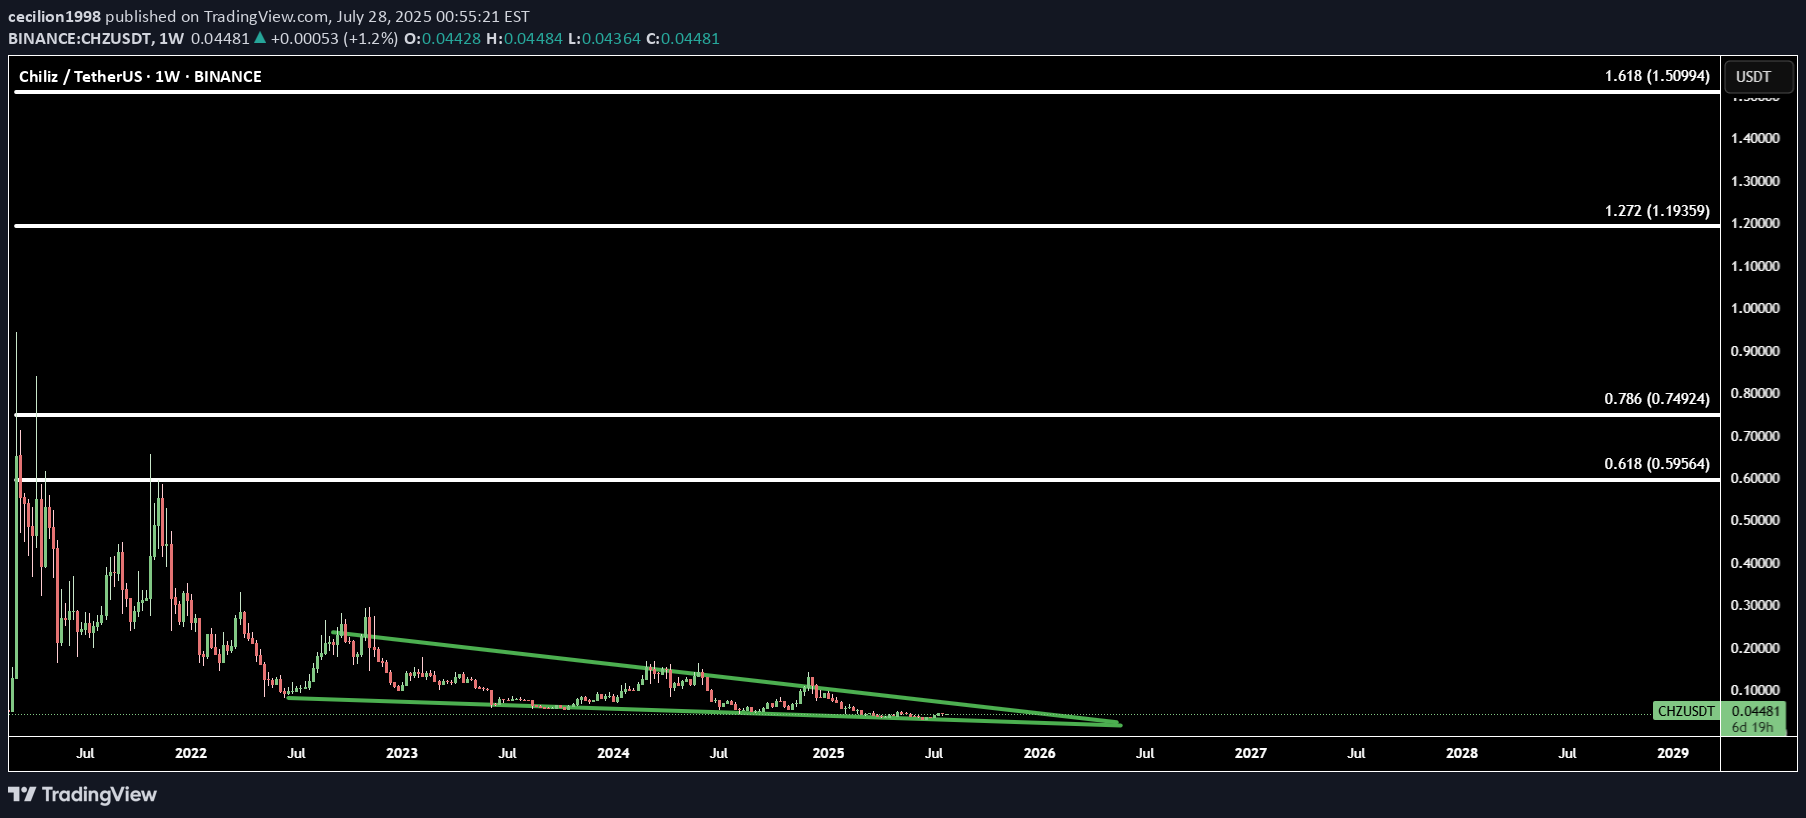
Many traders feel they’ve missed the start of the altseason, but CHZ/USDT is offering a second chance. On the weekly timeframe, CHZ is breaking out of a long-term falling wedge pattern — a classic bullish reversal structure that often precedes explosive moves. Combining this with Fibonacci extensions, we identify 4 major upside targets: Target 1: 0.618 Fib - 0.59 – initial breakout confirmation Target 2: 0.786 Fib - 0.74 – mid-term resistance level Target 3: 1.272 Fib – 1.19 - extended bullish leg Target 4: 1.618 Fib – 1.50 - full potential of the wedge breakout CHZ is currently undervalued and positioned near its bottom, making it one of the best risk/reward plays in the current market for those who still want exposure to the altseason wave.
cecilion1998

(CRO/USDT) is showing a strong bullish reversal on the chart, forming the classic Three White Soldiers pattern — a powerful signal of trend reversal and sustained momentum. This move comes after a prolonged consolidation phase, making CRO an ideal low-capital investment with the potential for a high reward. Using Fibonacci extensions, I’ve identified 4 bullish targets: Target 1: 0.618 Fib – 0.82 - confirmation of trend shift Target 2: 0.786 Fib – 1.03 - key resistance zone Target 3: 1.272 Fib – 1.64 - major breakout level Target 4: 1.618 Fib – 2.08 - full bullish potential zone With technicals and sentiment aligning, CRO may be gearing up for a big move, and current prices offer one of the best risk-reward opportunities in the market.
cecilion1998
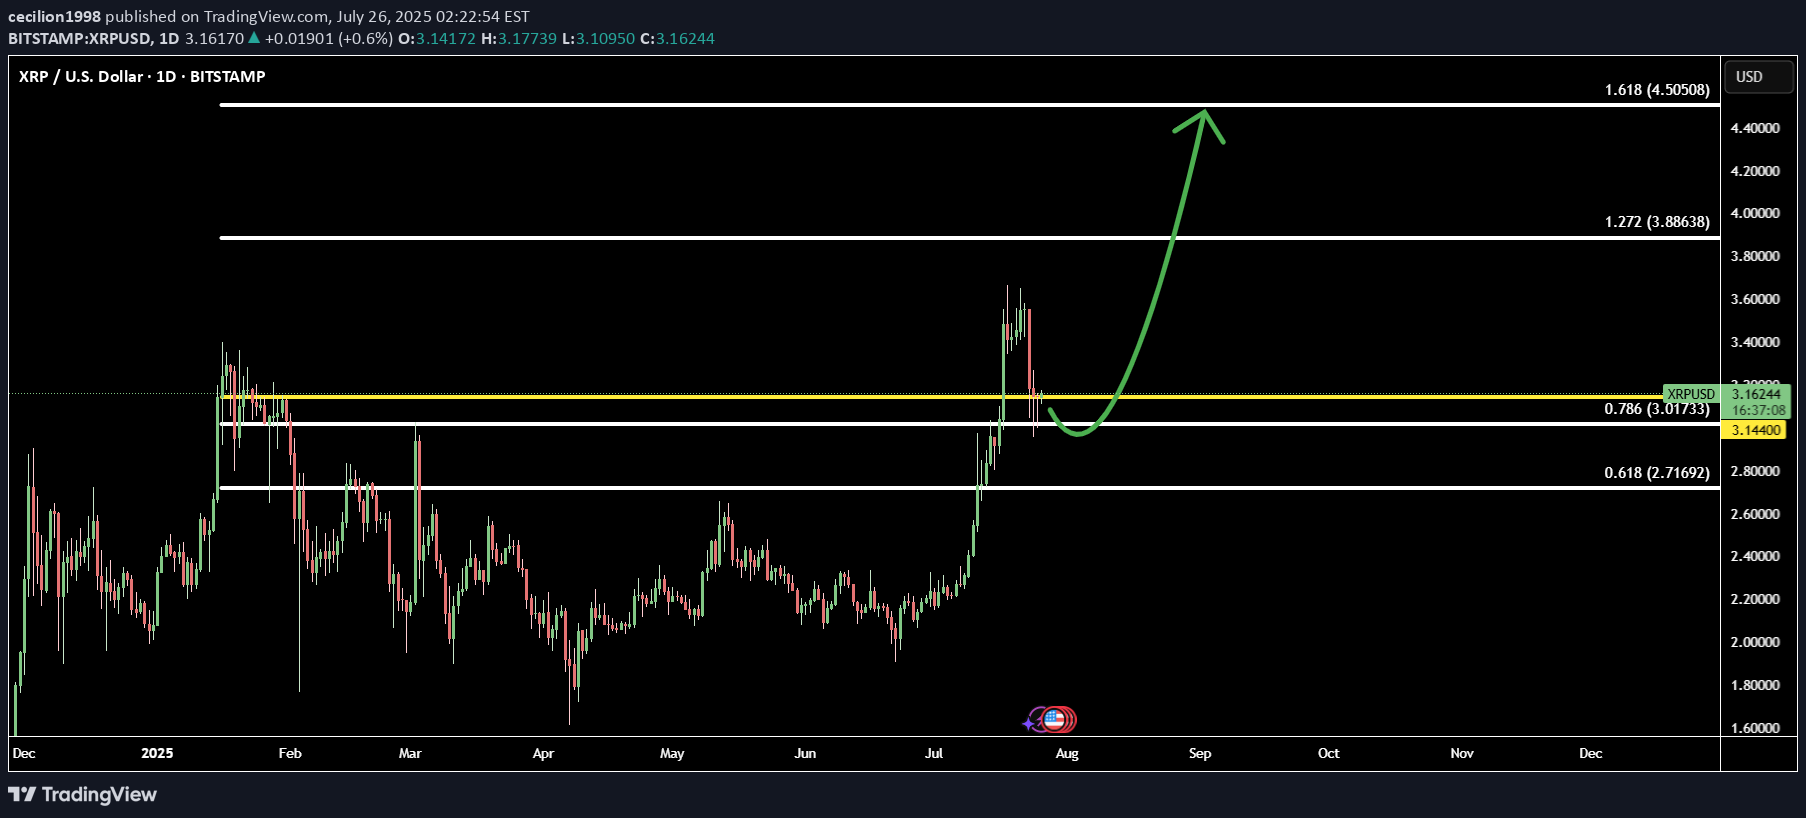
After a healthy pullback, XRP (XRPUSD) is showing signs of renewed strength as new buyers re-enter the market. This correction phase appears to have attracted smart money, setting the stage for the next bullish leg. The chart structure suggests XRP is now in a re-accumulation phase, with price aiming for mid-term Fibonacci targets: Target 1: 1.272 Fib – 3.88 - continuation zone after breakout Target 2: 1.618 Fib – 4.50 - strong extension level aligned with prior highs If momentum holds and volume builds, XRP may resume its upward trajectory toward these targets in the coming weeks.
cecilion1998
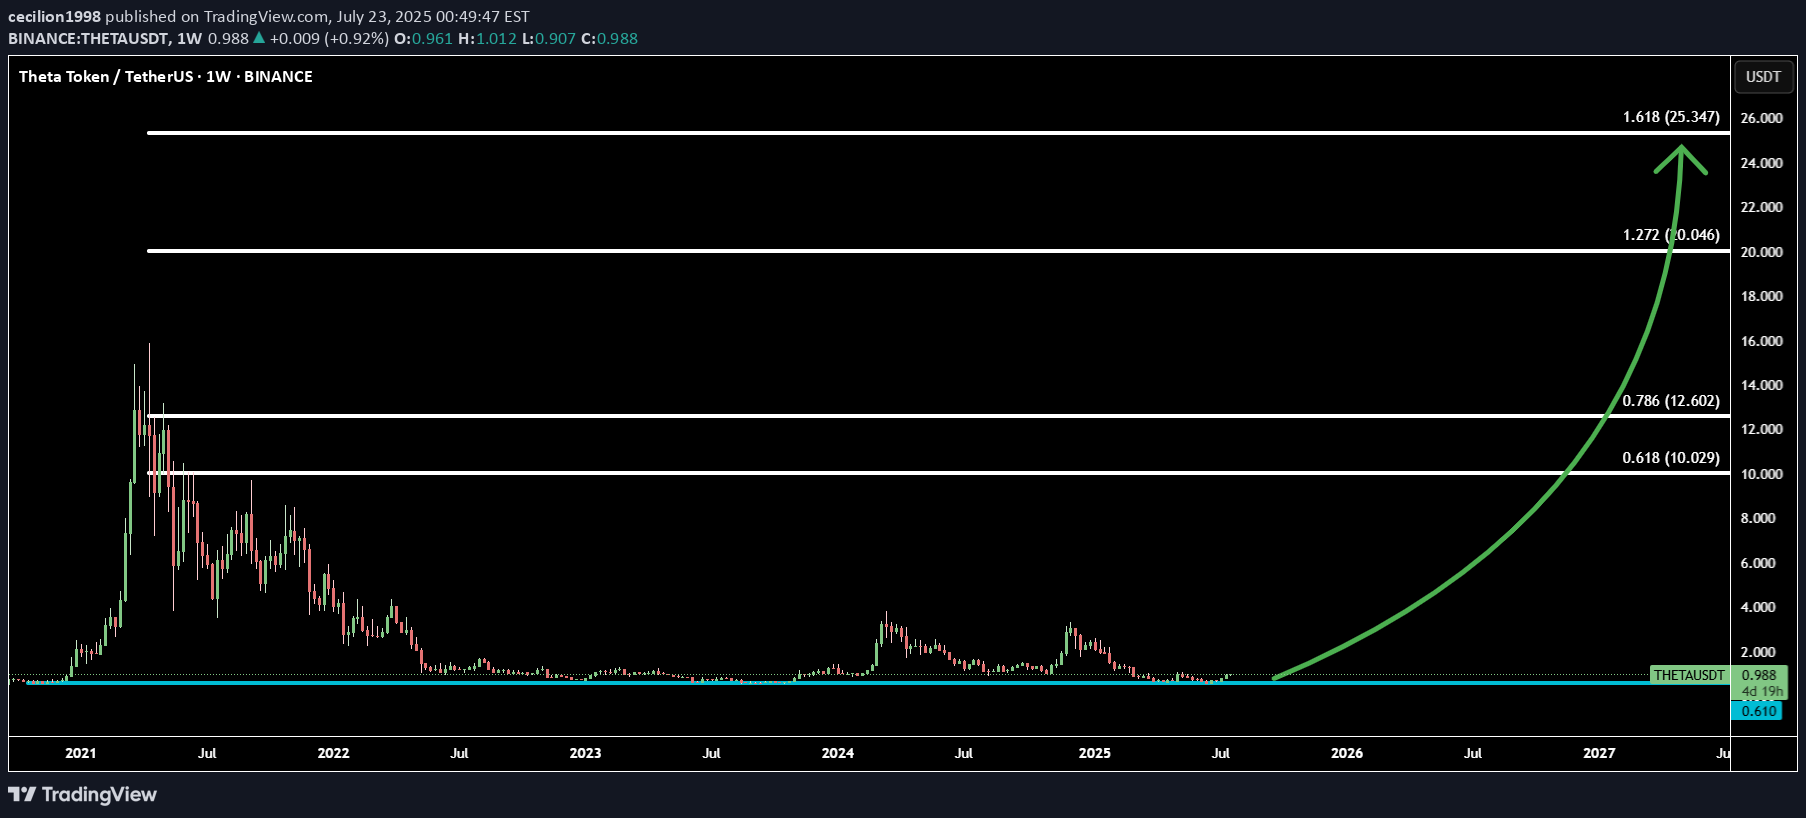
Even without a full altseason, THETA (THETAUSD) appears to be transitioning into a markup phase from its deepest correction zone. Price action suggests that THETA has likely bottomed out, making this one of the most reliable buying opportunities among altcoins right now. Technically, THETA is breaking out from long-term accumulation with strong support beneath, and the risk-reward is highly favorable at these levels. Using Fibonacci extensions, we identify 4 major upside targets: Target 1: 0.618 Fib — 10.029 - initial momentum and breakout confirmation Target 2: 0.786 Fib — 12.609 - mid-cycle resistance zone Target 3: 1.272 Fib — 20.046 - extended move aligned with historical levels Target 4: 1.618 Fib — 25.347 - full markup potential and trend peak target This structure suggests that THETA may not wait for altseason—it's building strength independently. The chart is aligned for a macro trend reversal.
cecilion1998
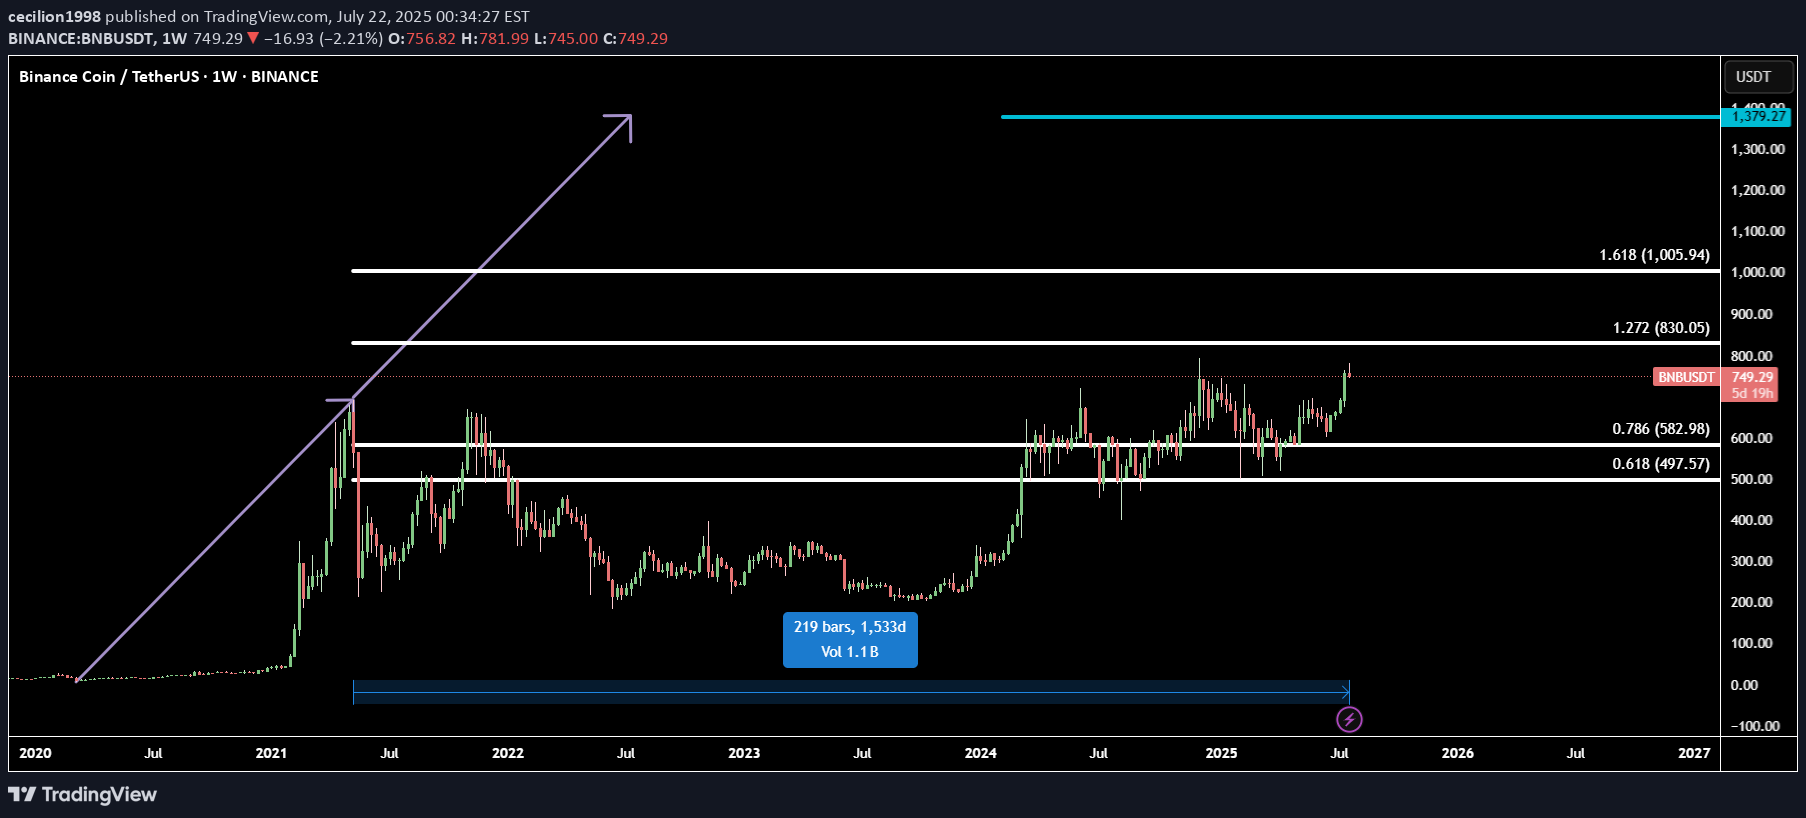
Binance Coin (BNBUSD) is setting up for a major breakout, approaching its all-time high with strong momentum. Technically, BNB has completed a 1533-day flag accumulation — a rare, long-term fractal consolidation that often precedes explosive moves. This massive base acts as a launchpad for the next bullish leg. Using Fibonacci extensions, we identify two major upside targets: Target 1: 1.272 Fib – 830.05 - the first resistance and profit zone Target 2: 1.618 Fib – 1005.94 - key bullish extension from breakout range Final Target: 1379.27 The final target is projected using fractal symmetry from previous bullish expansions, aligning with the broader market cycle and BNB’s historical price action. This setup suggests a high-probability move toward new all-time highs and beyond, supported by strong technical structure and breakout energy.
cecilion1998
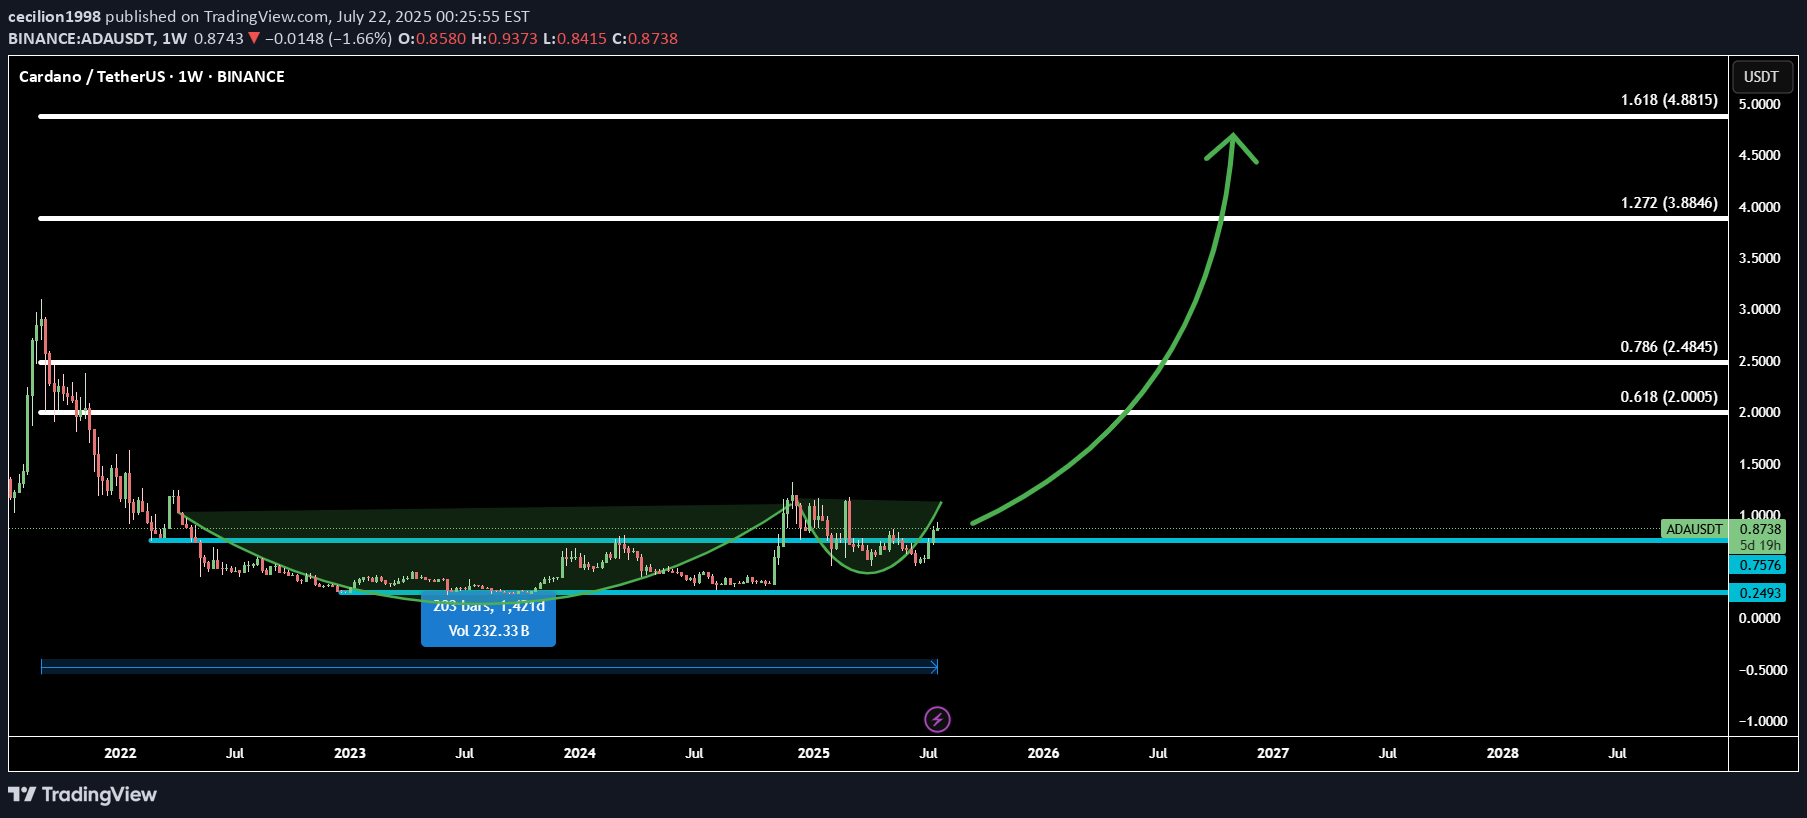
Cardano (ADAUSD) is forming a classic cup and handle pattern on the higher timeframe, signaling a bullish continuation setup that often precedes strong upward moves. Combined with Fibonacci extensions, the breakout potential is high, with multiple target levels mapped out: Target 1: 0.618 Fib – 2.0005 - confirms breakout strength Target 2: 0.786 Fib – 2.4845 - momentum continuation zone Target 3: 1.272 Fib – 3.8846 - full extension based on pattern measurement Target 4: 1.618 Fib – 4.8815 - aggressive bull target for long-term holders If ADA breaks the handle with strong volume, it could initiate a powerful rally. This setup is ideal for swing traders looking for a high-probability entry. Let’s catch the next big move together! 🚀
cecilion1998
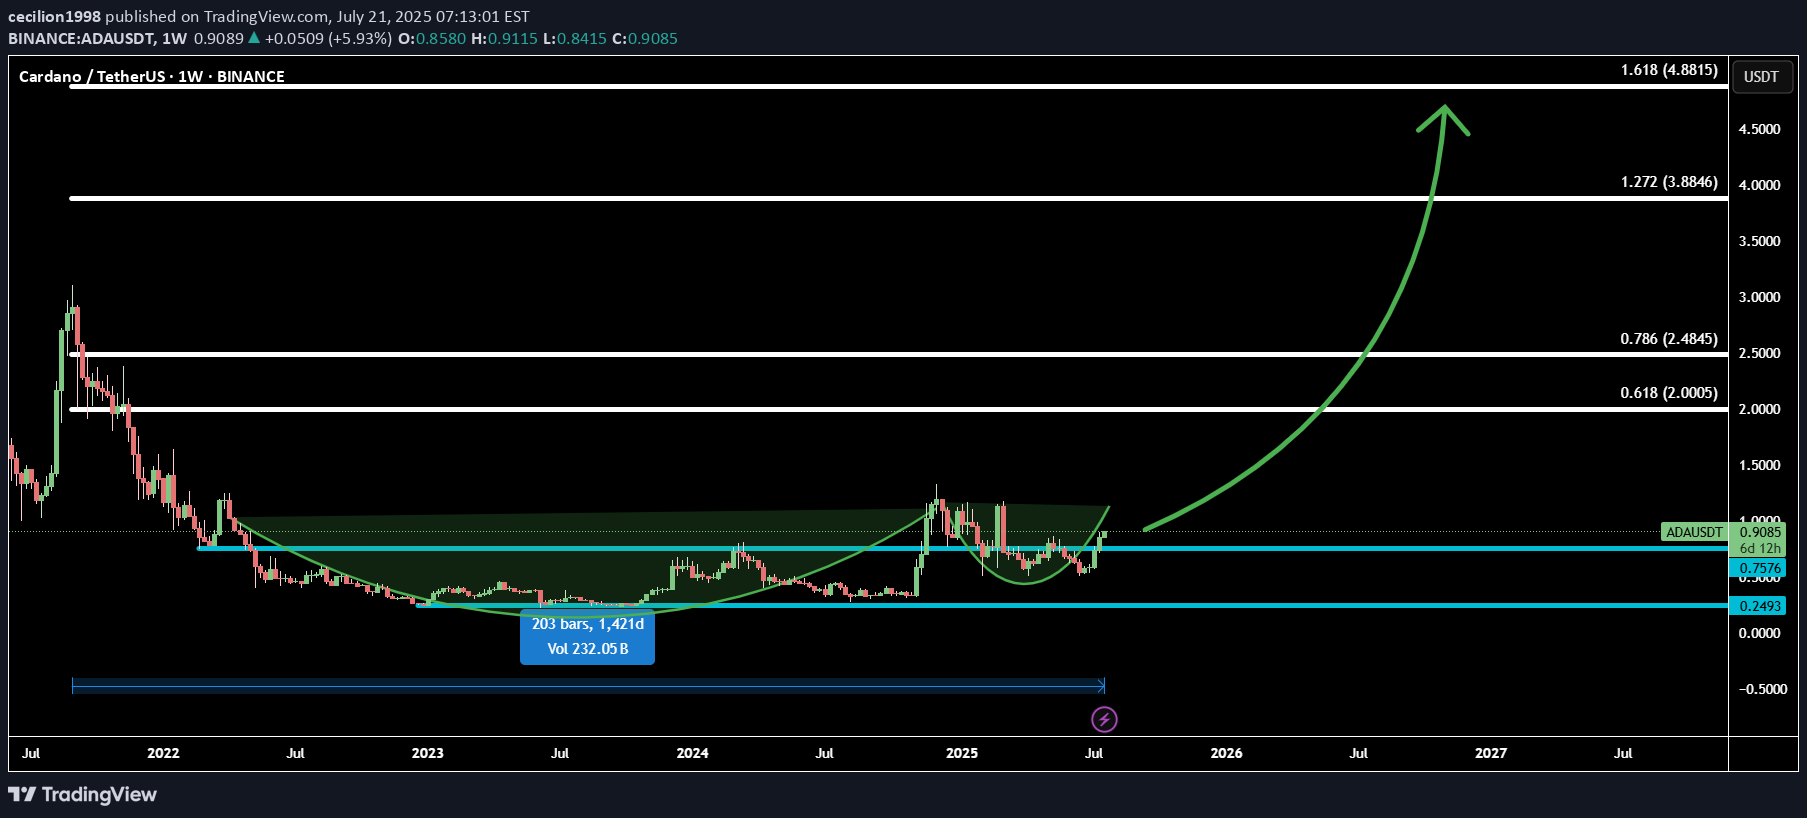
Cardano (ADAUSD) is forming a classic cup and handle pattern on the higher timeframe, signaling a bullish continuation setup that often precedes strong upward moves. Combined with Fibonacci extensions, the breakout potential is high, with multiple target levels mapped out: Target 1: 0.618 Fib – 2.0005 - confirms breakout strength Target 2: 0.786 Fib – 2.4845 - momentum continuation zone Target 3: 1.272 Fib – 3.8846 - full extension based on pattern measurement Target 4: 1.618 Fib – 4.8815 - aggressive bull target for long-term holders If ADA breaks the handle with strong volume, it could initiate a powerful rally. This setup is ideal for swing traders looking for a high-probability entry. 📢 Join my Telegram channel for more charts, real-time updates, and trading insights: 👉 t.me/cecilion1998 Let’s catch the next big move together! 🚀
cecilion1998
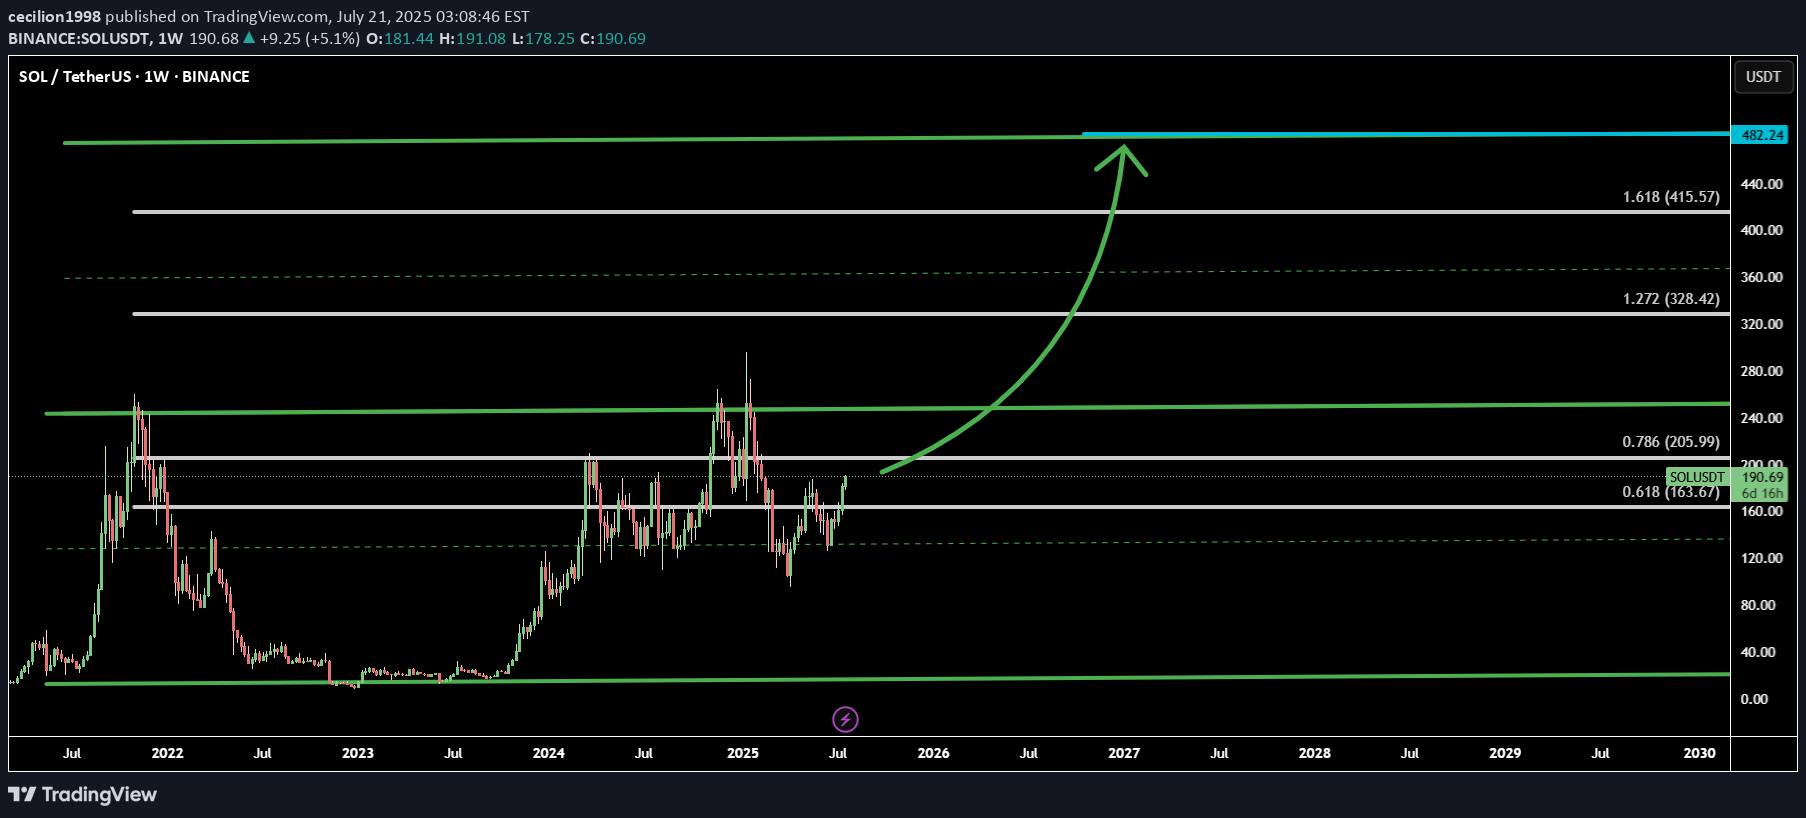
Solana (SOLUSD) is currently trading around $190, and technical analysis suggests it may be on the path to doubling in price toward $380. This projection is supported by both a bullish ascending channel and Fibonacci extension levels, providing confluence for an extended rally. Using this combined strategy, I’ve identified 4 key targets: Target 1: 0.786 Fib – 205.99 - mid-range target within the upper half of the channel Target 2: 1.272 Fib – 328.42 - aligns with historical breakout levels Target 3: 1.618 Fib – 415.57 - Last Fibonacci Targets Target 4: projected top of the current channel near 482.24 Beyond the technicals, Solana’s ecosystem continues to outperform many other Layer 1 chains, offering faster transaction speeds, lower fees, and robust DeFi and NFT activity. This fundamental strength supports the technical bullish thesis. As always, breakout confirmation and volume are key. Manage risk accordingly.
Disclaimer
Any content and materials included in Sahmeto's website and official communication channels are a compilation of personal opinions and analyses and are not binding. They do not constitute any recommendation for buying, selling, entering or exiting the stock market and cryptocurrency market. Also, all news and analyses included in the website and channels are merely republished information from official and unofficial domestic and foreign sources, and it is obvious that users of the said content are responsible for following up and ensuring the authenticity and accuracy of the materials. Therefore, while disclaiming responsibility, it is declared that the responsibility for any decision-making, action, and potential profit and loss in the capital market and cryptocurrency market lies with the trader.