
bitcosar
@t_bitcosar

What symbols does the trader recommend buying?
Purchase History
پیام های تریدر
Filter
bitcosar
SP500'de (SPX) 'Omuz Baş Omuz (OBO)' Formasyonu Oluştu!
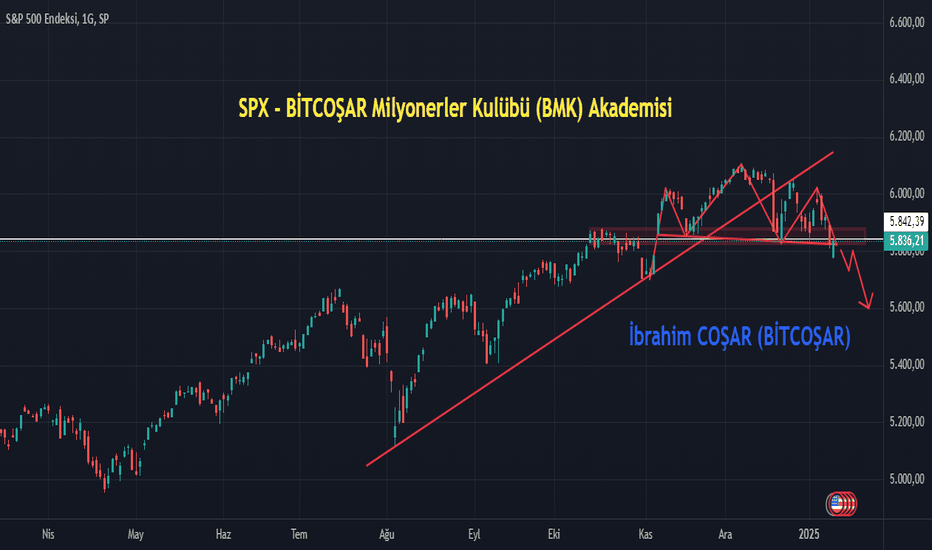
SP500 (SPX) 'Shoulder Head and Shoulders (OBO)' Formation has formed and broken. The shoulder head and shoulders formation, which is one of the formations that is frequently encountered in technical analysis and has a high reliability rate, is considered an important indicator in trend reversals. This formation is a strong technical structure that indicates that the uptrend is ending and the downtrend may begin. This formation, which has a high level of reliability, offers an effective tool for investors in predicting the direction change of the trend. On January 10, 2025, the 5830-5880 support was broken. Yesterday, even though the opening of the week was positive, it closed at the 5836 level and could not rise above the horizontal resistance. The 5830-5880 region can now work as resistance; in other words, this could be a retest movement. Since the support zone was broken, the price target of the OBO formation became active. Naturally, as long as the price does not rise above the old support zone, which is the new resistance zone, I think the OBO formation will collapse to its price target of 5600. My current price target is 5600. If the 5600 horizontal support is also broken, good luck; the 15-month-long upward trend will be broken. The US Producer Price Index (PPI) will be announced tomorrow at 16:30. US stock markets will be announced at 17:30. PPI is expected to be announced at 3.4%; the previous one was 3.00%. If PPI comes in above expectations, I think the declines in SPX and Bitcoin will continue. I, on the other hand, think that PPI may come in above expectations since the employment and JOLTS data are good. If it is announced below expectations, the markets will price this positively. In this context, I think tomorrow's PPI data is very important. Volatility and liquidity cleanups will continue; For this reason, do not use leverage, and even if you do, be very careful about your liquidity levels both in the upward and downward directions.🔥 I teach investment strategies with my Cryptocurrency Academy, BİTCOŞAR Millionaires Club (BMK)!✅ Click on this link to join BMK Academy with a 50% DISCOUNT: https://bit.ly/BMKAkademi
bitcosar
Bitcoin'de Düşüş Kırılımı Geldi: Fiyat Hedefi 76K l BMK Akademi

🚨 Bitcoin's Bearish Breakout Has Arrived: Price Target 76KBitcoin (BTC) Analysis (BTCUSDT)Bitcoin just closed its daily close at $97,805 and failed to break the $98,000 resistance. As if we didn't have a CME analysis and price target, now a rising wedge formation has formed on Bitcoin's daily chart. The price target of this formation is at $76,000. A breakout has occurred in this formation. In other words, the price target and scenario of this formation have become active. The CME gap is in the $78,000 - $81,000 region. CME gaps are usually filled with a high probability of 80% - 90%. Sometimes it fills early, sometimes late, but it fills somehow. In other words, it can fall to this level from here or Bitcoin it can retreat to this level after completing the bull run. However, it is quite difficult to predict exactly when this gap will be filled. Here, I would like to give a warning to my brothers who are especially engaged in leveraged transactions: They should act by taking this area into consideration and should not forget to keep their liquidation (liq) levels below this area. This is very important in terms of minimizing possible losses. I hope that this gap will be filled as soon as possible and the price target of the rising wedge formation will come; at least we will be free from these possibilities. In this way, we will continue on our way more comfortably. However, one more warning: Opening a short position based on this analysis may cause great trouble. Because the trend is upward in the medium and long term. It would be risky to act against this trend. I am doing my part; I am sharing with you what I see and know. In summary: - Do not act short. - If you are going to act long, adjust your leverage and liquidation level carefully. - Declines and corrections are opportunities in bull seasons. Try to reduce costs gradually. ✅ Mega Bull Season Free Altcoin Basket: bit.ly/ibrahimcosar58 - Check out my basket to evaluate the opportunities. ✅ BMK Crypto Education Academy: bit.ly/BMKAkademi (50% Discount) - Don't miss the training opportunity to specialize in the crypto world. (BMK price may change and the discount may end soon.) NOTE: Those who have technical problems accessing my altcoin basket and BMK can send an e-mail to our official e-mail address info@bitcosar.com.
bitcosar
Bitcoin’de RSI Uyumsuzluğu: Yükselişin Manipülasyon Olabilir mi?

There is a view that has caught my attention on the Bitcoin price chart for a while now. I waited for other analysts to notice and share it, I didn't want to mention it in order not to influence anyone. However, no analyst seems to have noticed it so far. I have been following the market closely for a long time, I thought this view might be broken, but it still hasn't. Now I want to share this situation. Bitcoin In the price chart, we have been seeing rising highs for the last month. These rising highs show that the price is gaining momentum upwards. However, the RSI indicator creates falling highs despite the price rising. This situation is defined as 'divergence' in technical analysis and is known as negative (bearish) RSI divergence. If the RSI value decreases while the price is rising, this usually indicates that the market is losing strength and increases the possibility of a correction or pullback in the short/medium term. When negative RSI divergence occurs, the possibility of manipulation in price movements should not be ignored. In other words, there may be manipulation in price movements. Even if the price continues to rise, the fact that the RSI indicator does not support this rise suggests that the rise may not be permanent and carries a serious risk of decline. In the last month, Bitcoin price rose from 92K to 102K. However, during this process, the RSI value decreased from 85 to 64. In addition, Bitcoin has been trying to break the 102K resistance for the last 10 days; but it cannot achieve a permanent break above the 102K or even $ 102,500 level. I wanted to share this determination, but remember: You cannot act with a single data. All data should be evaluated holistically. This analysis does not mean "open a short position"; taking a risk with a single move can put you in a difficult situation. Be careful not to use leverage during this process and definitely have a cash balance in your portfolio. Being careful always pays. ✅ Mega Bull Season Free Altcoin My Basket: bit.ly/ibrahimcosar58 - Check out my basket to evaluate opportunities. ✅ BMK Crypto Education Academy: bit.ly/BMKAkademi (50% Discount) - Don't miss the training opportunity to specialize in the crypto world. NOTE: Those who have technical problems accessing my altcoin basket and BMK can send an e-mail to our official e-mail address info@bitcosar.com.
bitcosar
XRP'de 4 Yıldır Beklenen Önemli Kırılım Geldi!

The Important Breakout Expected for 4 Years in XRP Has Arrived! Price Target: $1.80 XRPUSDT Analysis (Price Target $1.80) I shouted out loud for XRP in my live broadcasts every day at 23:00 and announced this breakout to you days ago when the price of XRP was below $0.80 and now I have drawn it in detail on the chart. There has been a downtrend in XRP for years and this downtrend lasted over 1300 days. In other words, the price of XRP has been in a downtrend for about 4 years. Now the uptrend has finally started in XRP. An important breakout will come with the weekly closing candle that will occur today in the almost 4-year symmetrical triangle formation formed on XRP's weekly chart. I showed it with a green arrow on the chart. The price target of this formation is $1.80. From $0.80 to $1.80. I would like to emphasize that this chart is a weekly chart and not a short-term chart. I shared the current support and resistance levels of XRP for the short term in my last 3 live broadcasts. Those who want to take advantage of this opportunity can watch these live broadcasts. We expect a mega cryptocurrency bull season ahead, so I am giving away my own altcoin basket for free. Join my academy where I share the individual purchase levels of all the projects in this altcoin basket urgently with a 50% discount! Not everyone will win in the bull season, only the educated ones! You can reach my altcoin basket and training from my social media accounts in the signature below. General Disclaimer: This is not investment advice, it is for informational purposes. Since it contains a brand name, it is necessarily free advertising. We expect a mega cryptocurrency bull season ahead, so I am giving away my own altcoin basket for free. Join my academy where I share the individual purchase levels of all the projects in this altcoin basket urgently with a 50% discount! Not everyone will win in the bull season, only the educated ones! You can reach my altcoin basket and training from my social media accounts in the signature below.
bitcosar
Bitcoin'de Aylardır Beklediğim Kırılım Geldi! Fiyat Hedefi: 120K

🚨 The Important Breakout I've Been Waiting For Months in Bitcoin Has Arrived! Price Target: 120KBTC USDT Analysis (Price Target 120K) Bitcoin made a bombshell weekly close. Months ago Bitcoin when the price was in the 50K range, I often said that I had a 100K price target for BTC for November. I insisted on this in my live broadcasts and the target is very close. There was a formation that I have been following for months on BTC's weekly chart and this formation breakout finally came with this week's weekly candle close. Bitcoin It closed the week at $ 80,370. Technically, there was a cup-handle formation on Bitcoin's weekly chart and a strong and large-bodied breakout came with a very solid volume candle close. The price target of the cup-handle formation is at 120K levels. This price target will of course not come all at once, of course there will be fluctuations in the price. We are expecting a mega cryptocurrency bull season ahead of us, that's why I am giving away my own altcoin basket for free. Join my academy where I share the individual purchase levels of all the projects in this altcoin basket with a 50% discount immediately! Not everyone will win in the bull season, only the educated ones! You can reach my altcoin basket and education from my social media accounts in the signature below. Legal Warning: This is not investment advice, it is for informational purposes. Since it contains a brand name, it is necessarily Free Advertising.
bitcosar
Bitcoin Fiyat Hedefi 63K-64K Bölgesi - İbrahim COŞAR

Bitcoin It fell below 58K support for a while but did not make a strong break. It only made 1 break below 58K at $57,881 on the 4-hour chart. Since it is a level very close to 58K, there is no need to take it into consideration. BTC The price made a successful re-test of 58K support and this support is working for now and BTC The price is starting to recover. TOBO formation and price target 63K-64K are still valid. We can probably see a nice attack in BTC this week. As long as we do not close below 58K on the daily chart, I will not change my plans for now. Target: 63K-64K I spent a lot of time and effort to write this article and make it really useful for you. Please like it and follow me! Thanks 🙏
bitcosar
Bitcoin Teknik Analiz: Yükseliş ve Düşüş Senaryoları - İbrahim C

Bitcoin is currently recovering from a support trendline of a descending channel. This line suggests that prices may hold at this level or begin to rise. Furthermore, BTC is trading within a key sideways demand zone. This zone acts as an area where demand is high and prices can find support. The 200MA is a long-term trend indicator, and a breakout above this level is generally considered an indication of a bullish trend (uptrend). Currently, this moving average is acting as support, and if the price stays above this level, there is a possibility that the uptrend will continue. Possible Scenarios: 1. Bullish Scenario: If Bitcoin successfully bounces off the support trendline and the sideways demand zone, this can be considered a bullish signal. In this case, the price could potentially move upwards and break past the current resistance levels. In particular, the price is likely to surge with the support of the 200-period moving average (200MA). 2. Bearish Scenario: If Bitcoin breaks both the horizontal demand zone and the support trend line, then a bearish move may be seen. Such a breakout indicates that the price may move further downwards and seek new support levels. After the breakout, longer-term support levels such as the 200-period moving average may also be tested. I spent a lot of time and effort writing this article and trying to make it really useful for you, please like it and follow me! Thanks 🙏
bitcosar
Bitcoin'de 70K Patlaması Bekliyorum! - İbrahim COŞAR (BİTCOŞAR)

The breakout I've been waiting for in Bitcoin has arrived. With today's daily close, we made the weekly close above $64,000, thus breaking the downtrend that has been going on for about the last month. We also made a solid, full-bodied, and voluminous candle close. BTC is currently trading at 64K levels and I expect a 10%-20% explosion in BTC in the near future. My short-term price target is 70K and above. In addition, we broke the 100-day EMA resistance on the daily chart. The $62,000 EMA resistance has now become a support level. Our supports are $63,000-$62,000-$60,000. During this process, they can hurt shorts, namely the bears, very badly. Be careful, please proceed with a stop, do not use leverage. If a daily close below $62,0000 occurs, my bullish scenario will be spoiled, but I don't think it will. I will enter a long trade, if this share gets good likes, maybe I will share the trade I will enter with you as a signal. Make sure you follow me so you don't miss any important developments. I spent a lot of time and effort writing this article and trying to make it really useful for you, so please like, comment, bookmark and share. Thanks 🙏 Disclaimer: My articles are not investment advice, they are for informational purposes only. They contain my own thoughts and comments.
bitcosar
Bu analiz Bitcoin'de 1 gün olmadan dolar bazında %8 kazandırdı!

#Bitcoin yesterday closed the daily closing at $ 60.375. So we closed over 60k for 2 consecutive days. I told you again in advance. I emphasized that the 2 -day closing over 60K will confirm in the direction of Long for me. As you can see in the graph above, 60k is a strong resistance, but now it has become a strong support. Those who followed my analysis articles and those who entered the Long -oriented process in all cryptos they followed when the daily closing arrived yesterday, but without just 1 day, they caught good increases on dollars. I will give the ratio over #BTC here. Calculate other increases yourself. Yesterday, after the daily closing Bitcoin won approximately 8 %before it was up to 1 day. In other words, those who just read the analysis did not read only in 1 day and only 8 %of Bitcoin. That's why I was in the process. In Altcoins, up to 45 %rise. In fact, 2 of the most rise in my bull season Altcoin basket in the subcoins. Make sure you follow me to avoid missing important developments. I have spent a lot of time and effort to write this article and try to make it really useful for you, so please like it, comment, add to your places and share. Thanks 🙏
bitcosar
Bitcoin'de Önemli Kırılım Geldi! - İbrahim COŞAR

Bitcoin Daily closing made $ 61.156 at $. It was a strong candle closure. With this candle, there was a significant break in the triangular formation. If the closing today is upstairs, this will be confirmed in the direction of long. The closing of the BTC closing we will do today is very important. Let's see if $ 60,000, with a strong and psychological resistance level, will make a solid support level? As I mentioned in my previous analysis, it was a powerful wall for 60K BTC and broken. Be cautious against traps and fake breaks. Do not use leverage and you must have stop-loss orders. Make sure you follow me to avoid missing important developments. I have spent a lot of time and effort to write this article and try to make it really useful for you, so please like it, comment, add to your places and share. Thanks 🙏
Disclaimer
Any content and materials included in Sahmeto's website and official communication channels are a compilation of personal opinions and analyses and are not binding. They do not constitute any recommendation for buying, selling, entering or exiting the stock market and cryptocurrency market. Also, all news and analyses included in the website and channels are merely republished information from official and unofficial domestic and foreign sources, and it is obvious that users of the said content are responsible for following up and ensuring the authenticity and accuracy of the materials. Therefore, while disclaiming responsibility, it is declared that the responsibility for any decision-making, action, and potential profit and loss in the capital market and cryptocurrency market lies with the trader.