
bL1TZZ
@t_bL1TZZ

What symbols does the trader recommend buying?
Purchase History
پیام های تریدر
Filter
bL1TZZ
A Spring Or Final Test Of Supply Before Markup? Bulls Load Up.

$BINANCE:MDXUSDT has corrected a whopping 98% from its highs. It has not followed BTC's bullish rally and currently lingers near a strong demand zone. If we are to follow Wykoff's Accumulation Schematics, we could be entering Phase C. Phase A began with Prelim Support / Selling Climax before a 320% Auto Reaction. This strong rally pushed our resistance zone higher than I would've liked. Multiple STs then occurred after the SC that ended Phase A. Phase B also had multiple STs, however price never reached the AR resistance levels. A "Spring" typically makes a brief dip below the TR support zone, however, this wasn't to be as the bulls stepped in at 5.5 cents, the same low made during the Phase B ST (Secondary test). We can expect a Test after a Spring (final shakeout/Bear Trap) or a Last Point of Support without the breakdown. You could even argue that the Spring has already occurred and this is a Test of remaining supply. Anything is possible. Test—Large operators always test the market for supply throughout a TR (e.g., STs and springs) and at key points during a price advance. If considerable supply emerges on a test, the market is often not ready to be marked up. Several reasons exist to be bullish which include- 8 Oscillators recently printed divergence with a bullish hammer to kick off proceedings. RSI continues to make Higher Lows and Higher Highs. Huge Volume Profile appears near the Trading Range lows which quickly diminishes going up. 10D/Weekly Stochastic bullish cross up near oversold levels. Price currently rests above weekly 10/21 day SMA's while nearing a first-ever cross. On the 2day, the 50 + 200 SMA's inch closer to a first-ever Golden Cross. The Bulls have shown great determination to hold the 5.5-cent - 6-cent support zone. Could the price plummet further? Sure. Having a strategy is key. The bears need a strong volume-supported break with a prolonged period below support to invalidate this idea. A strong sell-off in the market could also put pressure on the bulls. What is Phase C? It is in Phase C that the stock price goes through a decisive test of the remaining supply, allowing the “smart money” operators to ascertain whether the stock is ready to be marked up. A Spring is a price move below the support level of the TR (established in Phases A and B) that quickly reverses and moves back into the TR. It is an example of a bear trap because the drop below support appears to signal the resumption of the downtrend. In reality, though, this marks the beginning of a new uptrend, trapping the late sellers (bears). In Wyckoff's method, a successful test of supply represented by a spring (or a shakeout) provides a high-probability trading opportunity. A low-volume spring (or a low-volume test of a shakeout) indicates that the stock is likely to be ready to move up, so this is a good time to initiate at least a partial long position. What Is Mdex(MDX)? Mdex is an automatic market-making decentralized exchange based on the concept of fund pools. Mdex proposes and implements a dual-chain DEX model based on the Heco Chain and Ethereum. Mdex combines the advantages of the low transaction fees of the Heco chain and the prosperity of the Ethereum ecosystem. With MDEX, users can also participate in dual mining mechanism of liquidity mining and trade mining. Mdex is committed to building the largest DeFi platform integrating DEX, IMO, and DAO on the Heco and Ethereum. Current Market Cap - 70m. Circulation Supply - 950.25M Speculative Setup, DYOR + DD. Good Luck!1 week Oscillators
bL1TZZ
Chainlink - Did We Just Witness Wykoff Accumulation?

To all my fellow traders, speculators and gamblers, its been some time since my last post. I hope you've all been well, and most importantly, bathing in huge profits :) It seems like Chainlink followed textbook Wykoff Accumulation Schematics. Not the most perfect schematics, notably PS ( Prelim Support) falling a little short of the soon to be Resistance Lines. In addition, BU only touched the resistance turned support once before rocketing up. However the first PS does line up with the BU and subsequent SOS (Show Of Strength) Phase A includes a number of additional ST ( Secondary Test) which is common after the SC (Selling Climax) stage. The selling Climax should've marked the lowest point, but price action made a lower low after the AR (Auto Rally) But it was merely a 19c difference. Price still stayed within the TR(Trading Range) and bounced from the support lines. The AR also marked the highest point within the trading range. These are all minor discrepancies as price action continued to follow Wykoff theory. We had multiple touches of the Support / Resistance lines, along with a perfect Spring (Final Shakeout/Bear Trap), Test and LPS, followed by a BU + SOS. It took approximately 533 days from the SC (Selling Climax) to the TR (Trading Range) breakout, The longer the accumulation period, the stronger the "Spring". Does this mean price will continue north? Not necessarily, we've all seen these schematics fail. After all, Chainlink is up over 305% since the $4.65 Spring/Shakeout/Bear Trap lows. That would've made an awesome long entry. However, price is still way below its $53 ATH, so anything is possible. Having a quick look we could see that price is currently at resistance levels. A break from the 19$ range could initiate further upside. Like the majority of the market, the crypto king (BTC) will probably dictate Chainlinks next move. If we are to follow Wykoff theory, we could expect further upside. I made a post back in May 22' private post titled "Link... Whales have been accumulating" I remember reading many articles at the time that stated big players were buying up Chainlink. Price action also found support at various Fibonacci levels, in addition to strong buy signals. RSI Levels were at record lows, in addition to a whopping 90% correction at the time. Unfortunately, I never got around to publishing that idea, it would've made a fantastic post. I am no expert on Wykoff theory, so I've included information taken from various online sources. Hopefully it helps, Much love and lots of profits to you all. What is Wyckoff Accumulation? Each cycle in the market begins with accumulation. This phase is marked by a range trend, where the market is relatively stable and rangebound. During this phase, institutional investors buy the stock at lower prices. Also, the volume tends to decline in this phase because the buying interest gradually absorbs the selling pressure. Another way to confirm accumulation is to look at the support level. You may notice higher lows, indicating that the buyers are gaining power. Slowly, the trading volume begins to rise. This is a key indicator of the shift in sentiment and suggests a breakout trend. As the accumulation progresses, you may see signs of strength in the price action, where the asset breaks above the trading range’s upper boundary. This breakout often indicates that the market is ready for an upward move. During the Wyckoff Accumulation process, smart money builds substantial positions at favourable prices before the broader market realizes the potential for an upward move. The accumulation may resemble a “compressed spring” on the chart. The longer it is, the better the indication of a breakout. Markup: The second phase of accumulation is the markup, which follows a breakout. According to Wyckoff, traders should find entry points through the pullback zones in this phase. Wyckoff Events PS— Preliminary Support , where substantial buying begins to provide pronounced support after a prolonged down-move. Volume increases and price spread widens, signalling that the down-move may be approaching its end. SC— Selling Climax, the point at which widening spread and selling pressure usually climaxes and heavy or panicky selling by the public is being absorbed by larger professional interests at or near a bottom. Often price will close well off the low in a SC, reflecting the buying by these large interests. AR— Automatic Rally , which occurs because intense selling pressure has greatly diminished. A wave of buying easily pushes prices up; this is further fueled by short covering. The high of this rally will help define the upper boundary of an accumulation TR. ST— Secondary Test , in which price revisits the area of the SC to test the supply/demand balance at these levels. If a bottom is to be confirmed, volume and price spread should be significantly diminished as the market approaches support in the area of the SC. It is common to have multiple STs after a SC. Springs or shakeouts usually occur late within a TR and allow the stock’s dominant players to make a definitive test of available supply before a markup campaign unfolds. A “spring” takes price below the low of the TR and then reverses to close within the TR; this action allows large interests to mislead the public about the future trend direction and to acquire additional shares at bargain prices. A terminal shakeout at the end of an accumulation TR is like a spring on steroids. Shakeouts may also occur once a price advance has started, with rapid downward movement intended to induce retail traders and investors in long positions to sell their shares to large operators. Test — Large operators always test the market for supply throughout a TR (e.g., STs and springs) and at key points during a price advance. If considerable supply emerges on a test, the market is often not ready to be marked up. A spring is often followed by one or more tests; a successful test (indicating that further price increases will follow) typically makes a higher low on lesser volume. SOS — Sign Of Strength , a price advance on increasing spread and relatively higher volume. Often a SOS takes place after a spring, validating the analyst’s interpretation of that prior action. LPS—Last Point of Support , the low point of a reaction or pullback after a SOS. Backing up to an LPS means a pullback to support that was formerly resistance, on diminished spread and volume. On some charts, there may be more than one LPS, despite the ostensibly singular precision of this term. BU—“Back-Up” . This term is short-hand for a colourful metaphor coined by Robert Evans, one of the leading teachers of the Wyckoff method from the 1930s to the 1960s. Evans analogized the SOS to a “jump across the creek” of price resistance, and the “back up to the creek” represented both short-term profit-taking and a test for additional supply around the area of resistance. A back-up is a common structural element preceding a more substantial price mark-up, and can take on a variety of forms, including a simple pullback or a new TR at a higher level. Each Phase Explained. Phase A: Phase A marks the stopping of the prior downtrend. Up to this point, supply has been dominant. The approaching diminution of supply is evidenced in preliminary support (PS) and a selling climax (SC). These events are often very obvious on bar charts, where widening spread and heavy volume depict the transfer of huge numbers of shares from the public to large professional interests. Once these intense selling pressures have been relieved, an automatic rally (AR), consisting of both institutional demand for shares as well as short-covering, typically ensues. A successful secondary test (ST) in the area of the SC will show less selling than previously and a narrowing of spread and decreased volume, generally stopping at or above the same price level as the SC. If the ST goes lower than that of the SC, one can anticipate either new lows or prolonged consolidation. The lows of the SC and the ST and the high of the AR set the boundaries of the TR. Horizontal lines may be drawn to help focus attention on market behaviour. Sometimes the downtrend may end less dramatically, without climactic price and volume action. In general, however, it is preferable to see the PS, SC, AR and ST, as these provide not only a more distinct charting landscape but a clear indication that large operators have definitively initiated accumulation. In a re-accumulation TR (which occurs during a longer-term uptrend), the points representing PS, SC and ST are not evident in Phase A. Rather, in such cases, Phase A resembles that more typically seen in distribution (see below). Phases B-E generally have a shorter duration and smaller amplitude than, but are ultimately similar to, those in the primary accumulation base. Phase B: In Wyckoffian analysis, Phase B serves the function of “building a cause” for a new uptrend (see Wyckoff Law #2 – “Cause and Effect”). In Phase B, institutions and large professional interests are accumulating relatively low-priced inventory in anticipation of the next markup. The process of institutional accumulation may take a long time (sometimes a year or more) and involves purchasing shares at lower prices and checking advances in price with short sales. There are usually multiple STs during Phase B, as well as upthrust-type actions at the upper end of the TR. Overall, the large interests are net buyers of shares as the TR evolves, with the goal of acquiring as much of the remaining floating supply as possible. Institutional buying and selling imparts the characteristic up-and-down price action of the trading range. Early on in Phase B, the price swings tend to be wide and accompanied by high volume. As the professionals absorb the supply, however, the volume on downswings within the TR tends to diminish. When it appears that supply is likely to have been exhausted, the stock is ready for Phase C. Phase C: It is in Phase C that the stock price goes through a decisive test of the remaining supply, allowing the “smart money” operators to ascertain whether the stock is ready to be marked up. As noted above, a spring is a price move below the support level of the TR (established in Phases A and B) that quickly reverses and moves back into the TR. It is an example of a bear trap because the drop below support appears to signal resumption of the downtrend. In reality, though, this marks the beginning of a new uptrend, trapping the late sellers (bears). In Wyckoff's method, a successful test of supply represented by a spring (or a shakeout) provides a high-probability trading opportunity. A low-volume spring (or a low-volume test of a shakeout) indicates that the stock is likely to be ready to move up, so this is a good time to initiate at least a partial long position. The appearance of a SOS shortly after a spring or shakeout validates the analysis. As noted in Accumulation Schematic #2, however, the testing of supply can occur higher up in the TR without a spring or shakeout; when this occurs, the identification of Phase C can be challenging. Phase D: If we are correct in our analysis, what should follow is the consistent dominance of demand over supply. This is evidenced by a pattern of advances (SOSs) on widening price spreads and increasing volume, as well as reactions (LPSs) on smaller spreads and diminished volumes. During Phase D, the price will move at least to the top of the TR. LPSs in this phase are generally excellent places to initiate or add to profitable long positions. Phase E: In Phase E, the stock leaves the TR, demand is in full control and the markup is obvious to everyone. Setbacks, such as shakeouts and more typical reactions, are usually short-lived. New, higher-level TRs comprising both profit-taking and acquisition of additional shares (“re-accumulation”) by large operators can occur at any point in Phase E. These TRs are sometimes called “stepping stones” on the way to even higher price targets. Who Was Richard Wykoff? Richard Demille Wyckoff (1873–1934) was an early 20th-century pioneer in the technical approach to studying the stock market. He is considered one of the five “titans” of technical analysis, along with Dow, Gann, Elliott, and Merrill. At age 15, he worked as a stock runner for a New York brokerage. Afterward, while still in his 20s, he became the head of his firm. He also founded and, for nearly two decades, wrote and edited The Magazine of Wall Street, which, at one point, had more than 200,000 subscribers. Wyckoff was an avid student of the markets, as well as an active tape reader and trader. He observed the market activities and campaigns of the legendary stock operators of his time, including JP Morgan and Jesse Livermore. From his observations and interviews with those big-time traders, Wyckoff codified the best practices of Livermore and others into laws, principles, and techniques of trading methodology, money management, and mental discipline. Mr. Wyckoff observed numerous retail investors being repeatedly fleeced. Consequently, he dedicated himself to instructing the public about “the real rules of the game” as played by the large interests, or “smart money.” In the 1930s, he founded a school that would later become the Stock Market Institute. The school's central offering was a course that integrated the concepts that Wyckoff had learned about identifying large operators' accumulation and distribution of stock with how to take positions in harmony with these big players. His time-tested insights are as valid today as they were when first articulated. Speculative Setup, DYOR.
bL1TZZ
The Crypto Commander-In-Chief & The Fibonacci Golden Pocket.

No, this is not a "short idea", but rather a look @ previous market tops & the subsequent corrections. 2013 - In November BTC tops out around the $1,163 mark. An awesome %50,000 return if you were lucky enough to buy bitty @ $2 only a few years prior. Price then corrects a whopping %86.7 & bottoms @ the Fibonacci 0.618 level, a 2-year accumulation period begins. It took a total of 406 days for BTC to find the bottom, & exactly 1064 days (35 months) from that low till the 2017 high. 2017 - Thanks to Bitfinex and co, the crypto king tops out in December 2017 @ the 20k mark, a 85% correction follows and price bottoms @ the 0.615 Fibonacci level. An awesome %12,850 jump from the 2015 lows of $155. It took approximately 364 days for BTC to find the bottom & ironically, 1071 days before the next all time high- only a single week difference from the 2015-2017 low to high period. 2021 - BTC sets a new all time high of $69,000, a truly spectacular rise. To think this was once 0.01 cents is mind boggling. A cool %2,150 rise from the 2018 lows of around $3,100. However 74% has already been wiped from its price when it hit the $17,700 mark. This is also the first that BTC drops below the previous all time high. Price still hovers around the 0.382 Fibonacci level, should that fail, a visit to the 0.5 Fibonacci is on the cards, it also lines up with the failed rally which resulted in the 2019 high. Should BTC have a similar 84% correction as it has in the past, it would visit once again, the famed Fibonacci Golden Pocket. The golden pocket has huge volume profile, i have no doubt that long term bulls would be looking for buys from there (provided that it even gets there) Another thing to note is that, there is roughly a 4 year period between market tops. In fact, the duration between the 2013 top and the 2017 top was 1470 days (48.32 Months), only 35 days separate the 2017-2021 high to high period of 1435 days (47.17 months). Should BTC follow a similar cycle, that could potentially mean a new all time high in October 2025. BTC can even rocket from here, who knows, only time will tell. Accumulation, mark-up, distribution- Rise and repeat, its been happening for centuries. My bias remains unchanged, all my posted ideas are long & are suited for long term investors. Those get rich quick cowboys are more akin to gamblers, not investors. I believe that this is the time to be accumulating. Dollar cost averaging into your favourite projects certainly is more appealing now then it was a year ago. Many coins will go to to zero, some may 10x-100x. Having a strategy is key. Do your own due diligence. After all - “The market is a device for transferring money from the impatient to the patient.” - Warren Buffett. Hopefully this helps my fellow investors, traders & gamblers. Good Luck! Speculative Setup, DYOR.
bL1TZZ
META- Undervalued & Oversold.
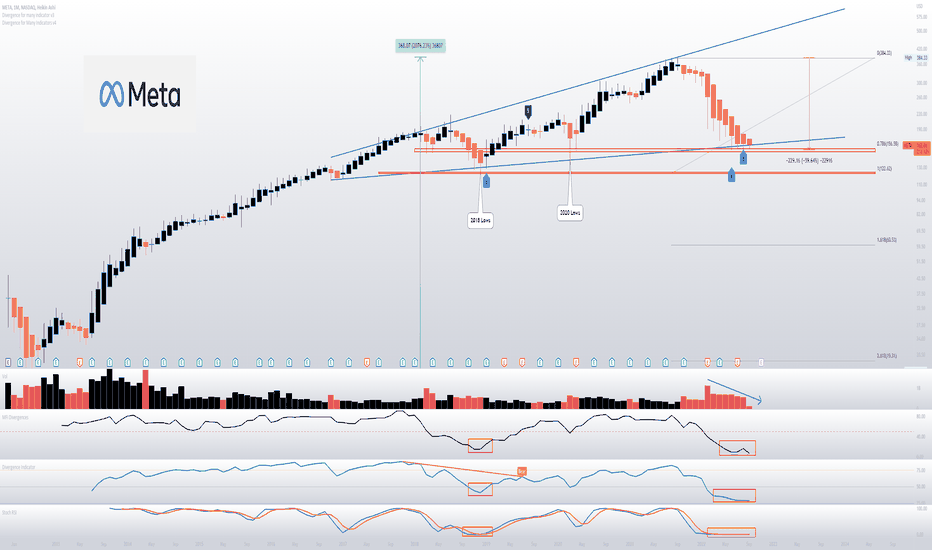
Market Cap - 426 Billion META has been on a 9 year bull run, in that period, it has firmly cemented itself as a digital marketing juggernaut. When it reached its all time high of $384.33 back in September 2021, it had an enormous market cap of 1.064 trillion dollars. At the time, it was only the fifth U.S. company to hit the milestone , joining Apple , Microsoft , Amazon and Google-parent company Alphabet . However the last 12 months have been somewhat brutal for Zuckerberg & co, the share price has dropped a staggering 60% to date, making this the biggest correction Meta has ever endured. Economic uncertainty, regulatory pressure and more recently, a first ever earnings miss, investors were quick to hit the panic button & add to the selling pressure. In February, Meta went down in history for the biggest one-day crash in the stock market. The company’s stock lost about $230 billion in market value in a single day. Meta revenue slipped to $28.8 billion in the second quarter, missing the $28.9 billion analyst estimate. Gross profit was $23.6 billion, down 0.5% from the equivalent quarter last year. In April, Apple introduced a change to its privacy policy that requires apps to ask users if they want to be tracked, this made META's ad selling business less affective, with only a reported 16% of users agreeing to be tracked. The privacy crackdown is set to cost Meta at least $10 billion in lost sales in 2022 alone. As a result of the data drought, Meta shifted their ad spending to Google because its flagship search-ad business relies on customer intent—users’ search terms immediately reveal what they are interested in—rather than data collected from app and web tracking. Google , the world’s largest digital-ad company by revenue, generated its highest sales growth in more than a decade in the third quarter. The sensational rise of short-video sharing app TikTok, has seen many users defect with approximately 1.4 billion monthly active users now on the popular platform. This is quickly approaching Instagram, which has approximately 2 billion monthly active users. This year, TikTok is on track to triple worldwide ad revenues, to $11.6bn, more than the $10.44bn for Snapchat and Twitter combined. This forced META to focus more on short-videos in the form of "Reels". Reels recently reached $1 billion in annualized revenue for the first time, Reels now has a higher revenue run rate than Facebook /Instagram Stories at identical times post-launch. Mark Zuckerberg is betting his company’s future on the metaverse — a virtual space in which people interact with each other using avatars and developing AR / VR technology. He said that he plans to invest heavily in his company’s metaverse ambitions & that will mean losing significant amounts of money on the project in the next three to five years. This massive shift has shaken up already nervous investors, however should one of its Reality Labs products change the world, it would be the jolt this company needs to continue funding its ambitions. The company once suffered a colossal 19% drop in 2018 after posting disappointing revenue and user figures for the second quarter of that year, however it bounced back before going on to make all time highs. Facebook has 2.74 billion monthly active users, No other platform offers this kind of reach. Facebook is the world’s third-most visited website- outranked only by Google and YouTube. It’s also the top Google search query. Facebook is the second-most downloaded free app in the App Store. 63% of the U.S. population over age 12 uses Facebook . 32.4% of Facebook’s audience is aged 25-34. Seniors are the fastest-growing group of Facebook users. More than 37% of people born in 1945 or earlier are on Facebook , up from 26% a year earlier. 74% of high-income earners use Facebook For those earning $75,000 or more, Facebook is the preferred social network. Facebook is also the most popular social network (besides YouTube) for college graduates, with 74% of them using the platform. LinkedIn again comes second with this group, at 51%. Facebook users spend 34 minutes per day using the platform. 36% of people get news from Facebook . 79.9% of Facebook users only access the platform on a mobile device. An average Facebook user clicks on 12 ads per month. Facebook has an advertising audience of 2.14 billion. Meta's balance sheet includes $40 billion in cash, equivalents and short term investments, with $16 billion in total debt (although some of this may include operating liabilities). The firm's free cash flow generation is very strong, with $8.5 billion generated in the quarter, up 8.9% year over year. $5 billion worth of stock was approved for purchase in the second quarter. In addition, the company authorized another $24.32 billion for stock repurchases. Meta further reduced its full-year operating expense during its latest earnings update. Its current operating expense guidance sits at $85.0-$87.0 billion for 2022 From a TA point of view, there are a number of reasons to be bullish which include- - A very strong oversold signal (not shown due to limitations using invite-only scripts on public ideas) - 9 + 5 oscillators recently printing divergence -look left, - RSI / MFI / Stochastic are all oversold & sit @ record lows, - Pulling a fib from the 2018 lows, we could see that price currently sits @ the 0.786 Fibonacci level, - Decreasing selling volume, - Support trendline being tested. Should the 0.786 / support trendline not hold, long-term bulls should look for buys @ 2018/2020 lows. Can price drop further? Sure! Timing tops or bottoms is not my thing. Will Zuckerberg's metaverse gamble pay off? Only time will tell. As it stands, Meta remains in a strong position with enormous reach, should the massive investment in metaverse pay off, there is no doubt that Meta will go on to make new highs. Speculative Setup, DYOR. Strictly a long term play. Allow 24-72 Months for this idea."there is no doubt that Meta will go on to make new highs" And a new All time high was most certainly made. Price did fall below our 2018/2020 buy zone by approximately %28, but the bulls staged a sensational rally with a 452% move to the upside. Congratulations to those who took this trade!
bL1TZZ
VeChain/USDT. Testing the 0.5 Fibonacci.

Current Market Cap 1.69 Billion Since it dumped to 0.00157 during the March 20 sell-off, VeChain rocketed up over %17,000 to a high of 27.9 cents! Shortly after, the "Incredible Sell" prints, these signals should not be ignored on higher TF's. Price has since corrected over 92% and finds itself @ the 0.5 Fib level (2 cents) This area is also previous resistance now being tested as support. We also have a non confirmed conditional buy signal. Should the 0.5 level not hold up, long term bulls should look for buys in the golden pocket (1 cent) This area is a support/demand zone / previous minor resistance. The POC compliments the 0.786, (half a cent) long term bulls should reload again. Biggest Volume Profile appears between 0.3 - 1 cent. RSI is forming a nice falling wedge, a breakout + HH could initiate a rally. Stochastic is oversold. Selling Volume has slowly declined over time. Timing the tops/bottoms isn't important nor does it work. DCAing into your favourite projects that you believe in is best. About.. VeChain is an enterprise blockchain platform that aims to provide a full view of an organization by disintermediating information from data silos. VeChain also plans to become a leading platform for initial coin offerings (ICOs) and for conducting transactions between Internet of Things (IoT) connected devices. VeChain makes use of two tokens: VeChain token (VET) as a value layer and VeChain Thor Energy (VTHO) as a smart contract layer. Speculative Setup, DYOR. Allow 3-18+ Months For all Crypto Ideas. Credit to without_worries for allowing use of indicators.
bL1TZZ
Disregard The Noise. XRP Will Eventually Pump. Bulls Load Up.

First things first, I'm not the biggest fan of this centralised thing called XRP. I don't like the propagandists on YouTube spreading rubbish like "XRP TO 10K, 25K ,50K, 100K" ", The Great Reset " etc.. But feelings don't matter here, and as my mentor repeatedly says - "Emotions man, A Money Killer" Since it hit 10 cents during the March 20 sell-off, price then rallied 1800% to $1.96, the "Great Sell" then printed and price has since corrected 85% to 29 cents. XRP never rallied again like the rest of the market, nor did it go on to make a new high like the rest of the top 10 coins, mainly due to the whole SEC saga, which I'm sure everyone is aware of by now. Price currently hovers in the Fibonacci Golden Pocket, big Volume Profile can be found between there and the 0.786 fib level (19 cents) A conditional "Incredible Buy" prints along with 5 bullish oscillators. Stochastic Oversold. Long term Bulls should now be dollar cost averaging into their positions. Buys from 17 - 19 cents would be excellent. Can price drop further? Absolutely, I don't try timing tops or bottoms. Market sentiment is extremely bearish. The financial system is unfathomably complex, and no one, the Fed included, can prepare for every possible scenario as it embarks on its most ambitious Quantitative Tightening program to date. How will this affect cryptocurrency? Only time well tell! XRP has a strong supporter base and I believe over time, Ripple will continue to nab customers from the 10,000 financial institutions that Swift has on the payroll. Good Luck! Speculative Setup, DYOR. Allow 3-18 Months For all Crypto Ideas. Credit to without_worries for allowing use of indicators.
bL1TZZ
PolkaDot. In The Golden Pocket.

Market Cap 6.9 Billion Up a cool 2,600% before a RSI Bearish Divergence + the "Incredible Sell" , price retraced to the 0.5 fib level, before rallying again to its high of $55. Price has since corrected 88% and finds itself in the Golden Pocket. We also have our first "Incredible Buy" Signal + Stochastic Oversold. Does that mean the bottom is in? Don't know, I don't try timing the tops or bottoms. Long Term bulls should DCA (Dollar Cost Average) with re-entry at $4, which is the 0.786 fib level , some big Volume Profile can be found there. Can price drop further? Most definitely! Speculative Setup, DYOR. Allow 3-18 Months For all Crypto Ideas. Credit to without_worries for allowing use of indicators.Weekly HA MFI is @ 0.02!Price bounces from our 0.786 / POC reload zone. Price has rallied approx 235% since. A whopping 7 oscillators are now currently printing divergence on the 2 week DOT/BTC chart. A possible trendline breakout + backtest and a potential massive RSI Bullish Divergence.
bL1TZZ
UniSwap- MFI EXTREMLY Oversold. Bulls Load Up.

Market Cap 3.1 Billion Up a nice 2,400% before the RSI Bear Div and the "Incredible Sell" prints. Price has corrected 92% since and was gobbled up from the 0.786 fib level. Big Volume Profile in this range with POC around $3.80 Weekly Heikin Ashi Money Flow Index sits at 0.11! Stochastic Oversold. Long Term Bulls should now DCA. Could it drop further? Sure. I don't try timing tops or bottoms. Speculative Setup, DYOR. Allow 3-18 Months For all Crypto Ideas. Credit to without_worries for allowing use of indicators.
Disclaimer
Any content and materials included in Sahmeto's website and official communication channels are a compilation of personal opinions and analyses and are not binding. They do not constitute any recommendation for buying, selling, entering or exiting the stock market and cryptocurrency market. Also, all news and analyses included in the website and channels are merely republished information from official and unofficial domestic and foreign sources, and it is obvious that users of the said content are responsible for following up and ensuring the authenticity and accuracy of the materials. Therefore, while disclaiming responsibility, it is declared that the responsibility for any decision-making, action, and potential profit and loss in the capital market and cryptocurrency market lies with the trader.