
ahmadsaad83
@t_ahmadsaad83

What symbols does the trader recommend buying?
Purchase History
پیام های تریدر
Filter
ahmadsaad83
بیت کوین در آخرین مراحل صعود: هدف نهایی سقف کانال تا ۱۳۹ هزار دلار!
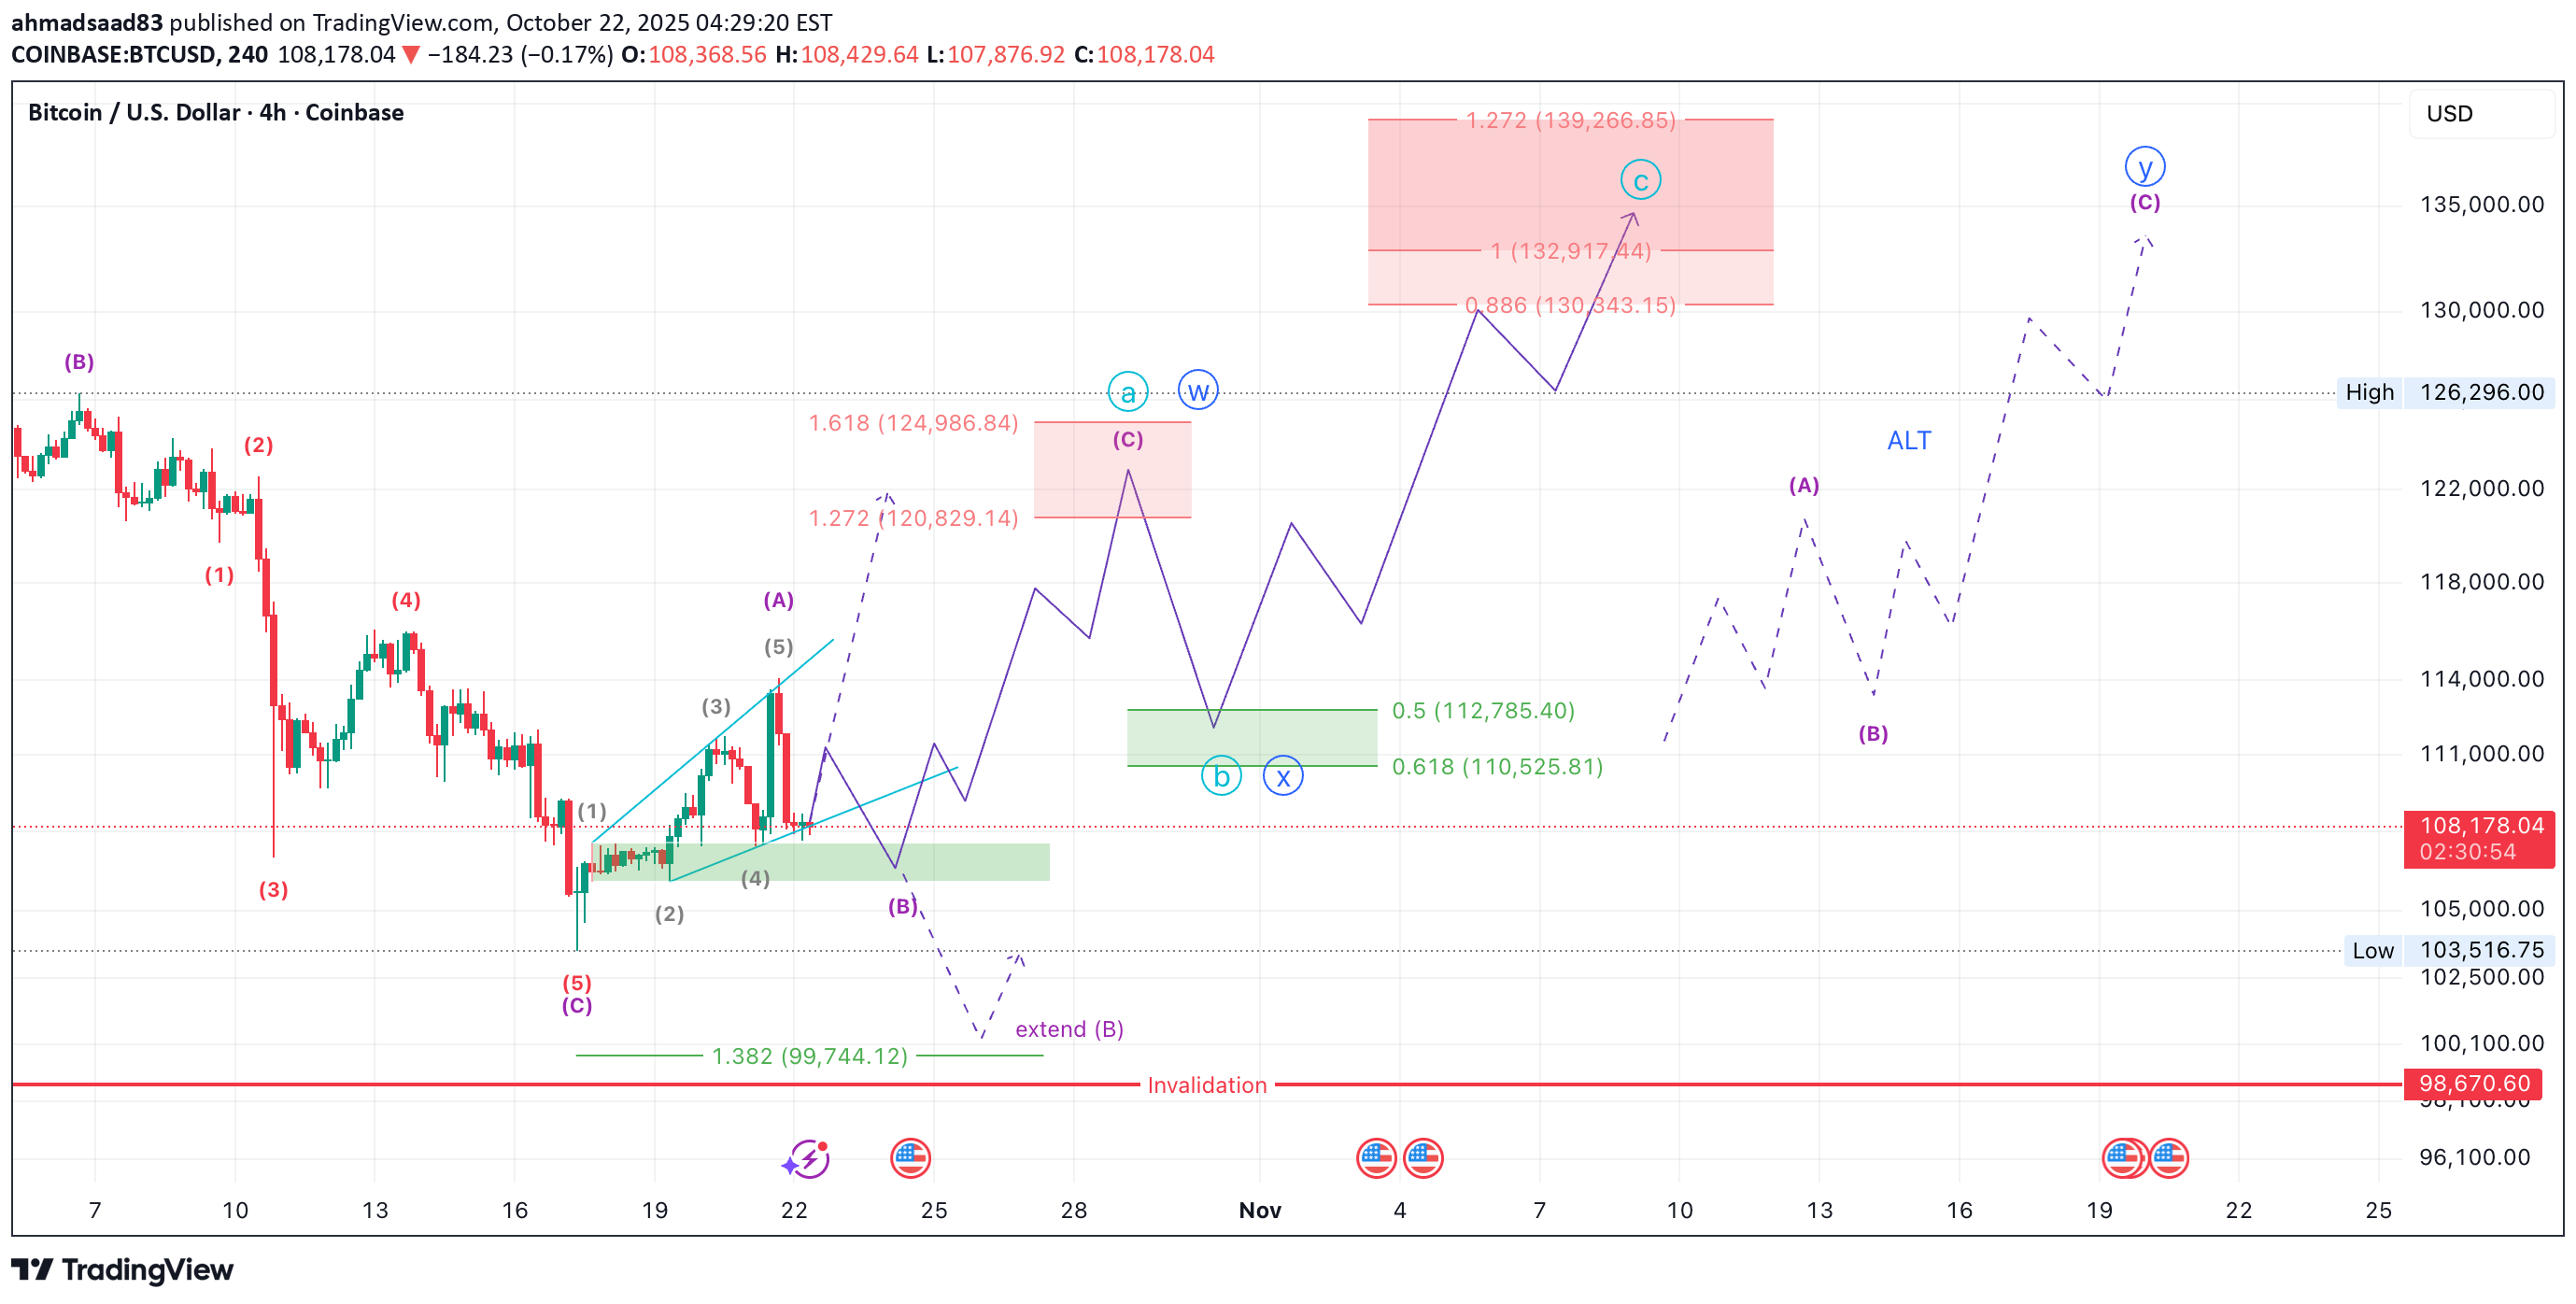
Technical Overview Bitcoin appears to be developing the final micro-structure inside Wave 5 of a larger ending diagonal pattern, which aligns with the broader weekly count. After the recent low near $103500, price began forming a corrective rise that may represent wave ABC OR WXY of the final push to complete the terminal pattern. The current 4H projection suggests that BTC will building subwave (C) within a potential W–X–Y structure. The next impulsive move could lift prices toward $130K–$139K, completing the upper boundary of the diagonal before a major reversal begins. Key Levels: Support / Buy Zone: 106 – 107k First Target: 120 - 124k Main Target Zone: 130 – 139k Invalidation: Below 99,744 (1.382 Fib level) which will invalidate the idea of extended wave B Summary: BTC is in the final phase of an extended ending diagonal, likely completing wave (5) of (V). The short-term setup remains bullish toward 130–139K, but traders should prepare for a major macro reversal once that zone is reached. Momentum divergences and weakening volume will be key confirmation signals for the top.another reason why I believe the that the Ending Diagonal scenario is the most likely to happenedwe are on the way to our target . down you can see Alt count for the wavesthanks for my friend for pointing out that this analysis is invalid, since waves 2 and 3 in an Ending Diagonal can’t be flats — let alone expanding flats! I will prepare a new analysis covering both the bullish and bearish scenarios. for now this analysis is invalid
ahmadsaad83
Bitcoin Annual Timeframe Analysis

Overview: Bitcoin's price movement on the annual timeframe demonstrates a clear formation of waves, reflecting market dynamics and investor behavior. The analysis covers the primary wave structures and transitions, as well as the evolution of analytical perspectives based on price actions. Detailed Analysis: Major Wave 1 (2009 - 2017): The first major wave consists of five distinct sub-waves: Sub-Wave 1: Rise from $0 to $30. Sub-Wave 2: Correction to $4. Sub-Wave 3: Strong rally to $1,163. Sub-Wave 4: Correction to $152. Sub-Wave 5: Extension to $19,666. Major Wave 2 (2018): A sharp correction to $3,122, representing the second major wave. This wave is consistent across all scenarios, marking the end of the first cycle and the beginning of the next major trend. Old Perspective (2019 - 2021): The rise from $3,122 to $69,000 was considered the third major wave . The correction to approximately $15,000 was classified as the fourth major wave . The expected termination near $75,000–$80,000 was projected to be the fifth major wave , respecting the Termination Channel. Analytical Shift: The breakout above $80,000 invalidated the old perspective, requiring a reevaluation. The updated analysis reclassifies the movements within Major Wave 3 as: Updated Major Wave 3 (2019 - 2024): Sub-Wave 1: A rise from $3,122 to $69,000. Sub-Wave 2: Correction to $15,974. Sub-Wave 3: Current rally to $108,000, with potential extension towards $125,000. The Termination Channel has now evolved into a Base Channel , providing support for future corrections instead of acting as resistance. Future Projections: Sub-Wave 4: A potential correction aligning with the Base Channel. Sub-Wave 5: A rally to conclude Major Wave 3, potentially exceeding $125,000. Key Failure Points: Price dropping below $69,000 would indicate weakening bullish momentum. Price falling under $46,000 would signify a potential market reversal, undermining the long-term bullish structure. Such a drop would also validate the old perspective, suggesting that Bitcoin's bullish cycle concluded at levels between $108,000 and $125,000. Conclusion: Bitcoin's wave structure showcases a clear roadmap of market dynamics. The transition from the Termination Channel to the Base Channel underscores the evolving nature of market analysis. Monitoring price action within these channels and the identified support levels is essential for making informed trading decisions. This analysis highlights key opportunities for growth while recognizing critical failure points to manage risk effectively.
ahmadsaad83
will BTC go above 100K after Halving?!

Many are optimistic about Bitcoin reaching the $150K-$200K range, let's strip away emotions and look at this logically. Wave Analysis: Wave (1): Concluded around 31K, followed by a shallow flat correction that lasted approximately five to six months, not surpassing the $24K mark (38.2% Fibonacci level). Current Phase - Wave (3): extended, similar to the first one: Sub-wave (i): Ended around $49K. Sub-wave (ii): A shallow zigzag correction that concluded at the 38.2% Fibonacci level. Sub-wave (iii): Finished around $74K. Sub-wave (iv): Currently unfolding, expected to potentially touch the 50% Fibonacci level between $58K and $54K. However, I anticipate a quick rebound from a candle tail, forming a deep flat correction. Sub-wave (v): Anticipated to end between $80K and $86K, possibly extending to $90K, differing from the consensus view. Predictions: After the completion of the major third wave, I expect a move into a fourth wave that will be significantly different in form and duration from the second wave, likely taking the form of a deep zigzag correction reaching the 50% and potentially the 61.8% Fibonacci levels, ranging from 52K to $45K. Unfortunately, this will leave many optimists stuck at the peak until the correction completes. Long-term Outlook: After completion of the fourth wave, discussions could shift to potential targets exceeding $100K. Disclaimer: This analysis is intended for educational and informational purposes only and should not be construed as financial advice. Always conduct your own due diligence and consult with a professional financial advisor before making investment decisions.keep you eyes on Btc Today, the daily candle must close above 63850 to be sure that the possibility of the uptrend overcomes the downtrend. closing above 64900 then we can confirm that the trend is reverse and we go all the way to our targets 79-85K
ahmadsaad83
APTUSDT Long Spot Trade / after the last correction

after the last correction APT break the Base Channel and retest it and entered wave 2 territory, and as I see BTC and ETH not complete there correction wave yet, and the same case with most of the other Crypto, so that mean that the price will go deeper, which make our 5 impulse Wave Idea invalid. I have completely re-analyzed this coin: APTUSDT Elliott Wave Technical Analysis Mode: Corrective Structure: Flat Position: the red Wave (c) of the orange Wave (b) Direction: the red Wave (c) is still in play Details: the red Wave (c) is still in play which I expected to be end around 6.3- 5.5 which will be my entry point, if this area is breached then the next entry point will be around 3.7 Next Direction: next higher Degrees orange Wave (b) Target : the area between 22.3-22.8 with about 300% profit, keep your eyes on on the first target around 20.08, the price may bounce back from this area. Wave Cancel invalid level: Daily closing below 3 with 45% loss. NOTE: don't sell everything in the 22.3-22.8 wait for price reverse confirmation, the price may reach the 27$ level. For long-term investment, this currency can reach the 40-60$ levels after going in a correction from the 27$ levels Disclaimer: This analysis is intended for educational and informational purposes only and should not be construed as financial advice. Always conduct your own due diligence and consult with a professional financial advisor before making investment decisions.
ahmadsaad83
KEYUSDT long Spot Trade / after the last correction

after the last correction break the Base Channel and entered wave 2 territory, and as I see BTC and ETH not complete there correction wave yet, and the same case with most of the other Crypto, so that mean that the price will go deeper, which make our 5 impulse Wave Idea invalid. KEYUSDT Elliott Wave Technical Analysis Mode: Corrective Position: Wave (c) from (X) Direction: Wave (c) is still in play Details: Wave (c) is still in play which I expected to be end around 0.0046-0.0035 which will be my entry point. Next Direction: next higher Degrees Wave (Y) Target : T1: 0.010775 with 160% profits T2: 0.0143 with 250% profits Wave Cancel invalid level: Daily closing below 0.002348 with 40% loss. Disclaimer: This analysis is intended for educational and informational purposes only and should not be construed as financial advice. Always conduct your own due diligence and consult with a professional financial advisor before making investment decisions.Binance will remove this pair
ahmadsaad83
FILUSDT long spot trade / after the last correction

after the last correction CFX break the Base Channel and entered wave 2 territory, and as I see BTC and ETH not complete there correction wave yet, and the same case with most of the other Crypto, so that mean that the price will go deeper, which make our 5 impulse Wave Idea invalid. FILUSDT Elliott Wave Technical Analysis Mode: Corrective Structure: Extended Flat Position: Wave (c) of (X) Direction: Wave (c) of (X) is still in play Details: Wave (c) is still in play which I expected to be end around 4.2-3.4 which will be my entry point. Next Direction: next higher Degrees Wave (Z) Targets: 10.4 with 170% profit 11.8 with 200% profit the area between 12.9-13.1 with 240% profit Wave Cancel invalid level: Daily closing below 2.7 with 30% loss Disclaimer: This analysis is intended for educational and informational purposes only and should not be construed as financial advice. Always conduct your own due diligence and consult with a professional financial advisor before making investment decisions. Closer look on the current correction wave on the 1D Frame:change entry point to 4.6 - 4.4
ahmadsaad83
CFXUSDT long Spot Trade / after the last correction

after the last correction CFX break the Base Channel and entered wave 2 territory, and as I see BTC and ETH not complete there correction wave yet, and the same case with most of the other Crypto, so that mean that the price will go deeper, which make our 5 impulse Wave Idea invalid. CFXUSDT Elliott Wave Technical Analysis Mode: Corrective Position: Wave (c) from Blue (B) Direction: Wave (c) is still in play Details: Wave (c) is still in play which I expected to be end around 0.16-0.14 which will be my entry point. Next Direction: Blue Wave (C) Targets : 0.498, 0,585, 0.63 with 200-270% profit Wave Cancel invalid level: Daily closing below 0.1 with 40% loss. Disclaimer: This analysis is intended for educational and informational purposes only and should not be construed as financial advice. Always conduct your own due diligence and consult with a professional financial advisor before making investment decisions.
ahmadsaad83
BTC to 60-58K

BTCUSD Elliott Wave Technical Analysis Mode: Corrective Position: Wave (iv) of (c) Direction: Wave (iv) of (c) is still in play Details: Wave (iv) is still in play which I expected to be end around 66-67K. Next Direction: Wave (V) which will complete the next higher Degrees Wave (c) Target : the area between 60-58k Wave Cancel invalid level: BTC going above 69200 Disclaimer: This analysis is intended for educational and informational purposes only and should not be construed as financial advice. Always conduct your own due diligence and consult with a professional financial advisor before making investment decisions.ALT COUNT, but not likely, because it need very fast moves to complete it before the halving.we reach the target of our wave (iv), will BTC fall down to wave (v) !!!! NOTE: if BTC didn't fall down today then it will continue up at least to 71Kwe reached our entry point BTC is now in a buffer zone, positivity overcomes negativity, the end of negativity is confirmed when the price penetrates 64900 and closes above it.
ahmadsaad83
FETUSDT long Spot Trade

FETUSDT Elliott Wave Technical Analysis Mode: Impulse Position: Wave (iv) of (3) Direction: Wave (iv) of (3) is still in play Details: Wave (iv) is still in play which I expected to be end around 2.3-2.4 which will be my entry point. Next Direction: Wave (V) which will complete the next higher Degrees Wave (3) Target : the area between 3.75-3.9 with about 60% profit, if break the next target is the area between 4.1-4.2 with 70% profit. Wave Cancel invalid level: as I see FET follow BTC move, so for this one my invalid level is BTC Daily close below 58.5K Disclaimer: This analysis is intended for educational and informational purposes only and should not be construed as financial advice. Always conduct your own due diligence and consult with a professional financial advisor before making investment decisions.first entry point is reached and we wait for the second onenext entry pointschange your next entry point to 1.55 - 1.46here is the new entry points and the new targets
ahmadsaad83
APTUSDT

APTUSDT Elliott Wave Technical Analysis Mode: Corrective Structure: Flat Position: Wave (4) of (C) Direction: Wave (4) of (C) is still in play Details: Wave (4) is still in play which I expected to be end around 12.5-11.8 which will be my entry point. Next Direction: Wave (5) which will complete the next higher Degrees Wave (C) Target : the area between 22.3-22.8 with about 80% profit, keep your eyes on on the first target around 20.08, the price may bounce back from this area. Wave Cancel invalid level: Daily closing below 11 with 11% loss. Disclaimer: This analysis is intended for educational and informational purposes only and should not be construed as financial advice. Always conduct your own due diligence and consult with a professional financial advisor before making investment decisions.check the related Ideas
Disclaimer
Any content and materials included in Sahmeto's website and official communication channels are a compilation of personal opinions and analyses and are not binding. They do not constitute any recommendation for buying, selling, entering or exiting the stock market and cryptocurrency market. Also, all news and analyses included in the website and channels are merely republished information from official and unofficial domestic and foreign sources, and it is obvious that users of the said content are responsible for following up and ensuring the authenticity and accuracy of the materials. Therefore, while disclaiming responsibility, it is declared that the responsibility for any decision-making, action, and potential profit and loss in the capital market and cryptocurrency market lies with the trader.