
afurs1
@t_afurs1

What symbols does the trader recommend buying?
Purchase History
پیام های تریدر
Filter
afurs1
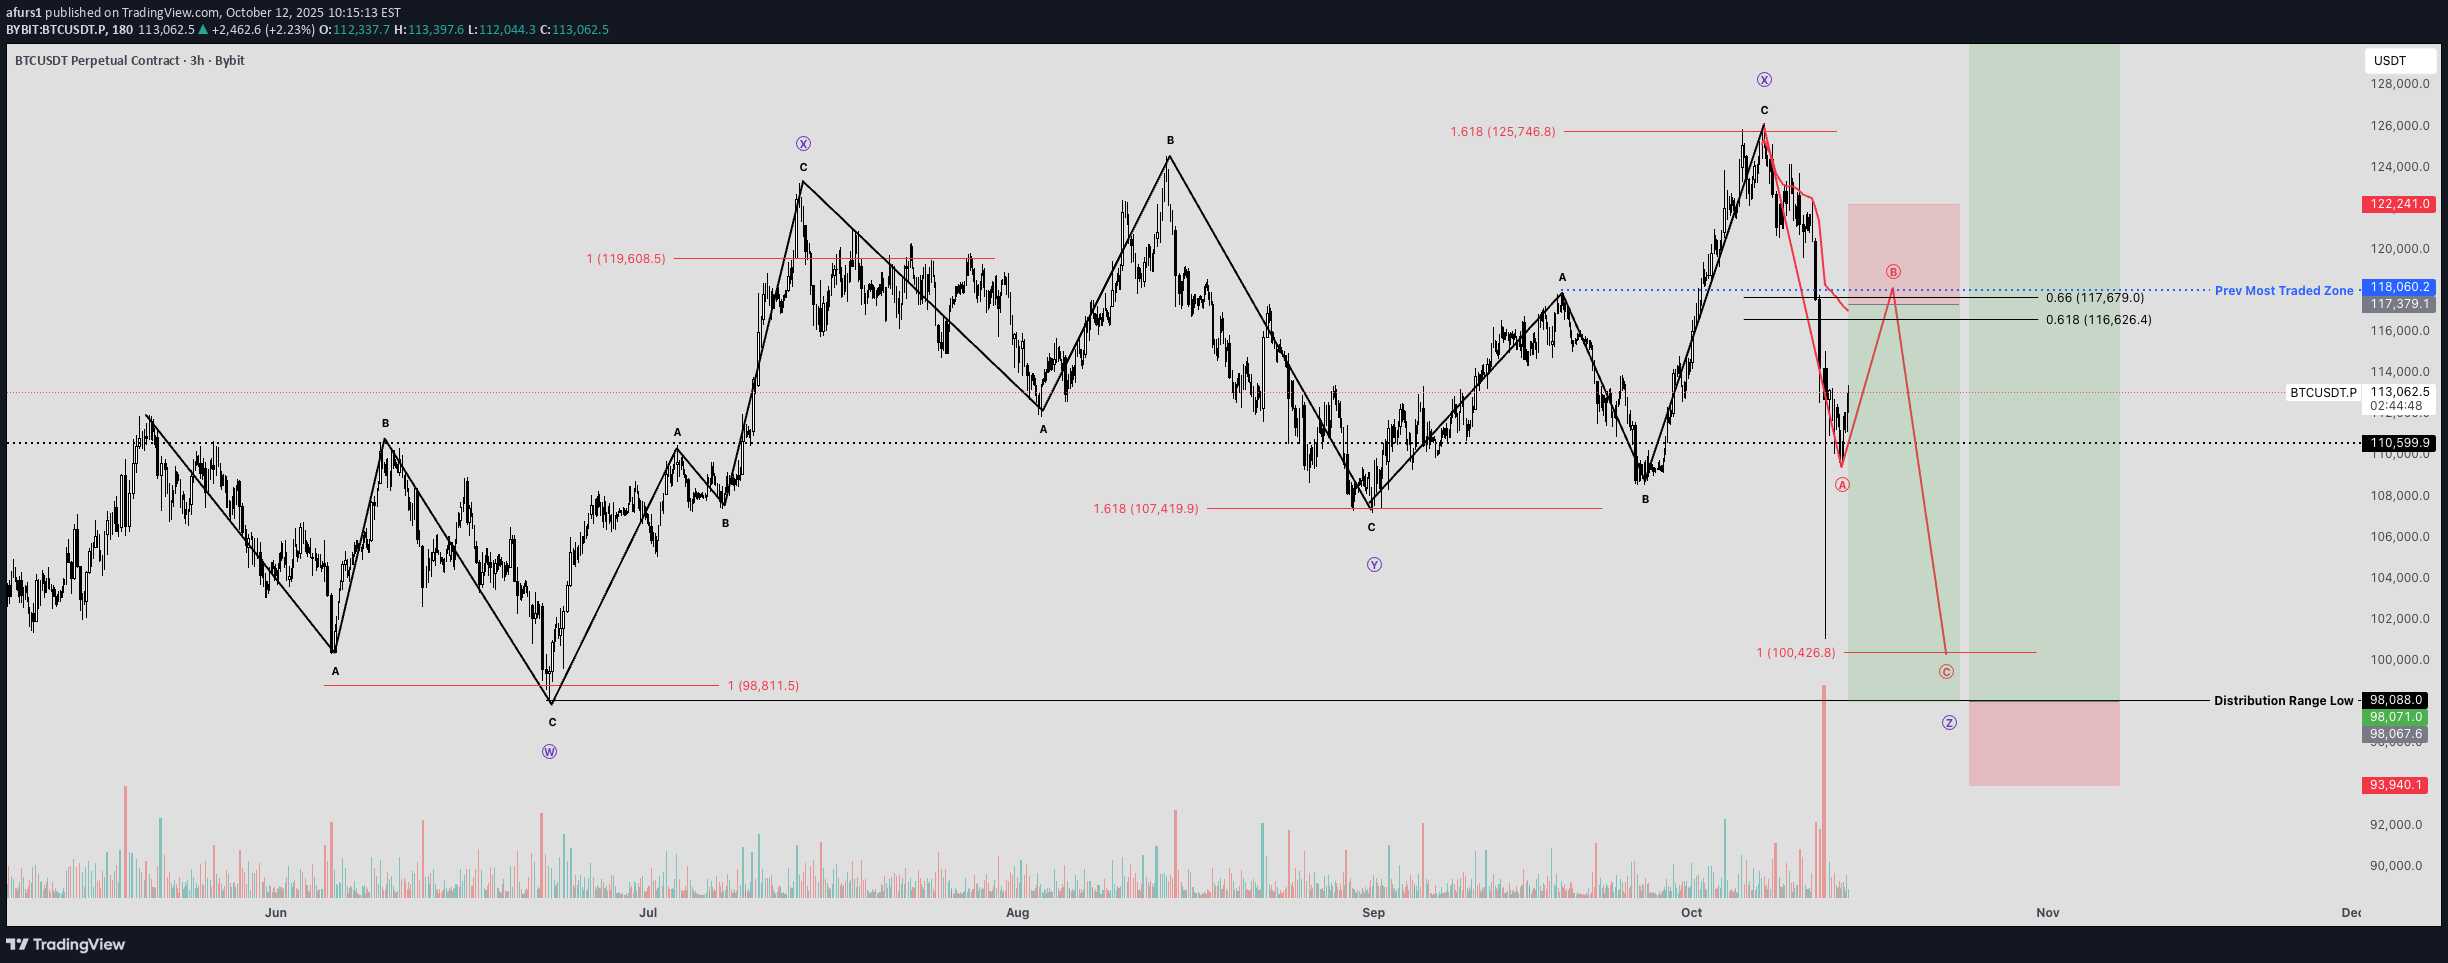
BTC Local Correction Before Further Downside
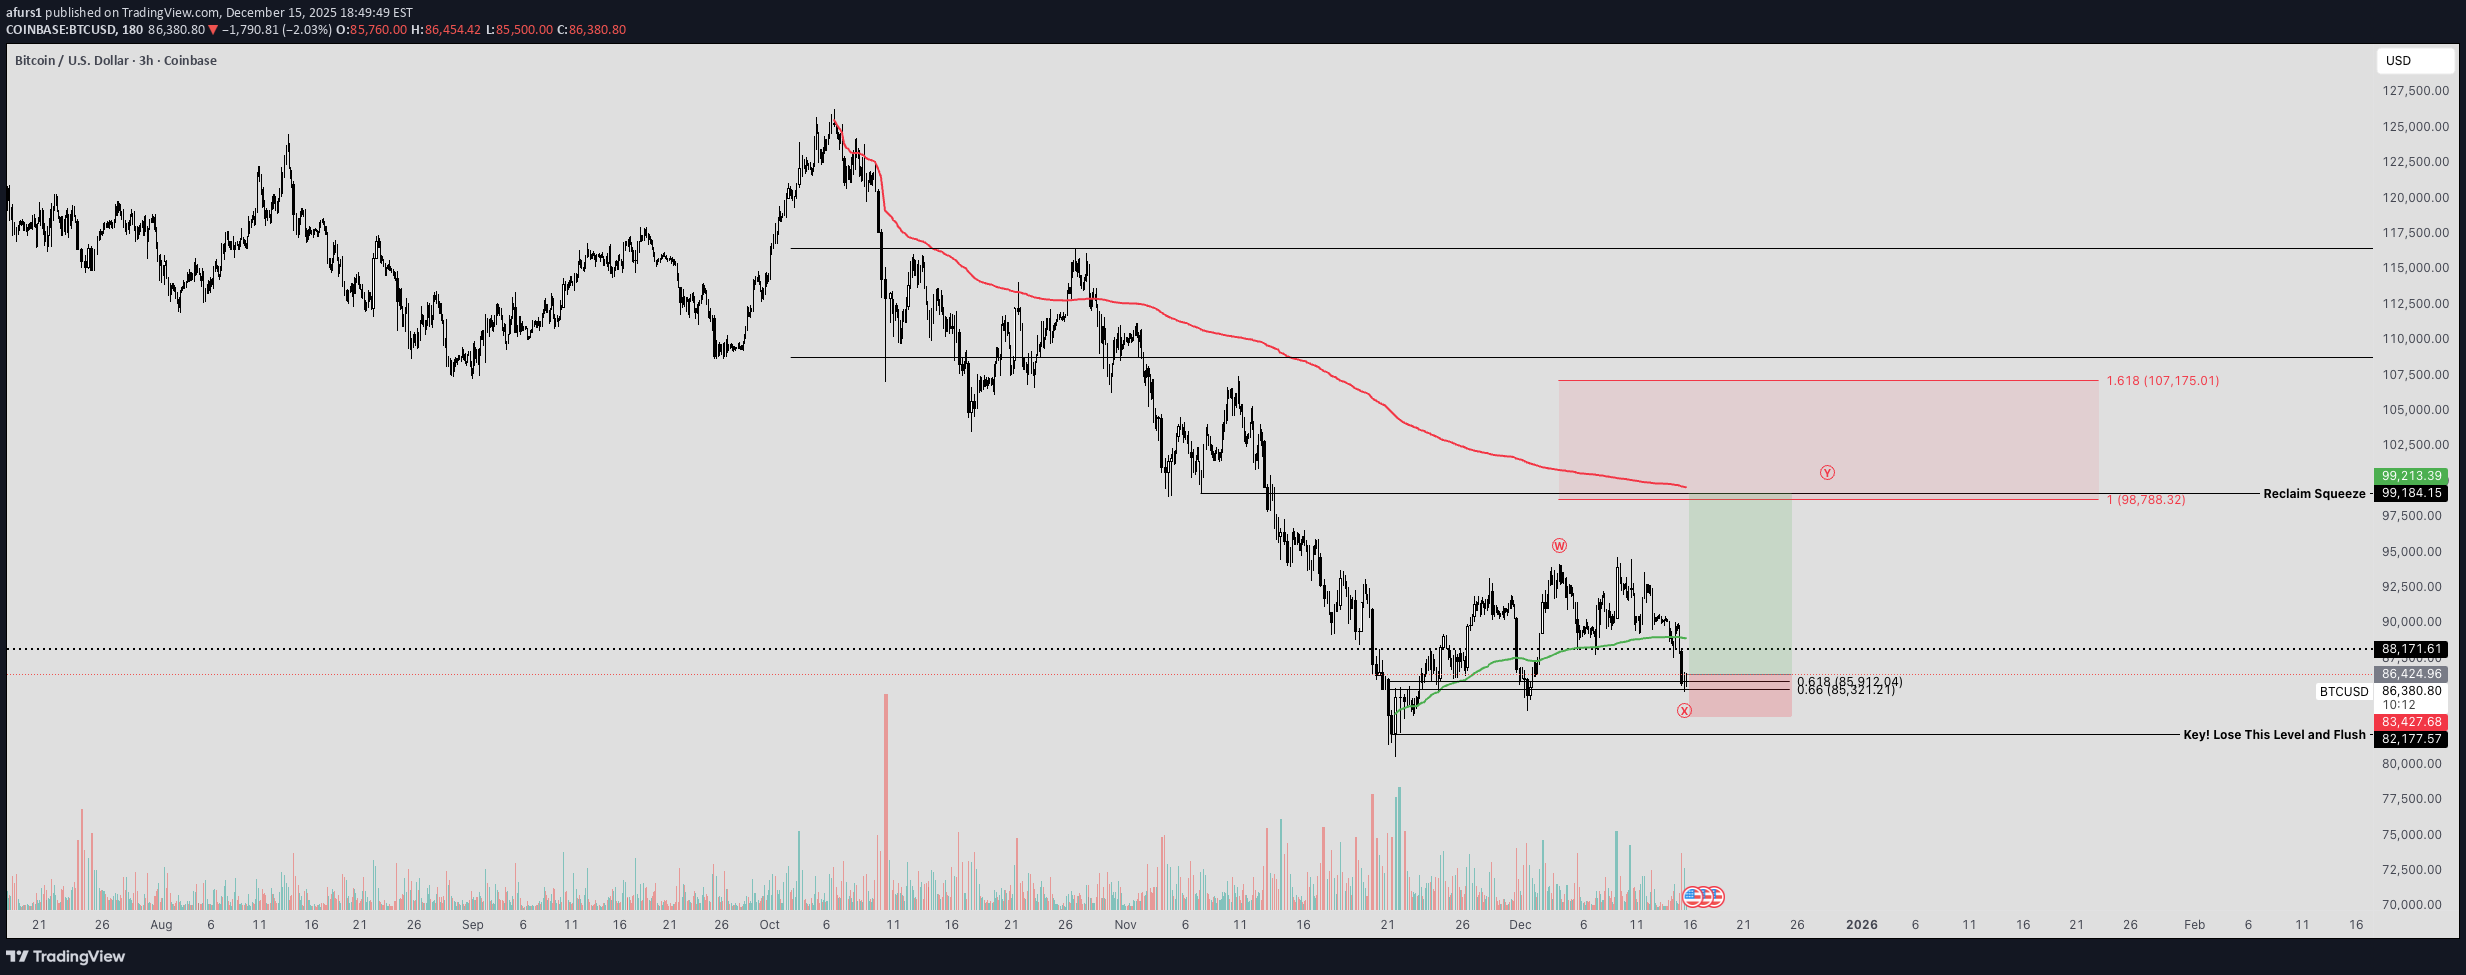
Bitcoin has been under tremendous selling pressure following the announcement that MSCI is considering further limitations on digital asset treasury companies. This development triggered a significant wave of liquidations on October 10th, which marked a critical turning point in market sentiment. Since that event, Bitcoin has remained in a persistent downward trend, showing little evidence of sustained relief rallies or bullish momentum. The trade idea presented here is based on an Elliott Wave technical pattern, specifically the WXY corrective structure. This pattern represents a complex correction composed entirely of three-wave movements, commonly referred to as zigzag formations. In this case, the market appears to be completing a measured 1-to-1 move, which is characteristic of WXY corrections and often signals a temporary pause before continuation of the prevailing trend. From a technical perspective, current price action aligns well with a potential mean reversion toward the VWAP drawn from the all-time high (ATH). This VWAP level acts as a dynamic resistance zone and suggests a possible retracement toward approximately $98,000. If price reaches this level, it would likely represent the completion of the corrective structure rather than a trend reversal. Following this reversion, the broader market structure implies that further downside movement remains the higher-probability outcome, as bearish momentum continues to dominate the larger timeframe.
afurs1
تحلیل نهایی بیت کوین ۲۰۲۵: نقطه عطف بزرگ با تئوری امواج الیوت و حراجی!

Bitcoin has had a challenging year in 2025, as the market has proven to be extremely choppy, volatile, and frustrating for many investors. Following the massive liquidation event in October—followed by a secondary drop below $100K—many crypto investors have likely begun to lose confidence in this asset class and are now seeking opportunities elsewhere. While I believe we are nearing the end of the broader market cycle, the current trajectory and sentiment suggest that we have not yet reached the extreme greed levels seen in previous peaks. Many altcoins have been decimated, and even the major cryptocurrencies have shown significant weakness, struggling to set any meaningful new all-time highs. Now, I want to analyze the current price action through two theoretical lenses: Elliott Wave Theory and Auction Theory. Elliott Wave Perspective From an Elliott Wave standpoint, I believe we are witnessing what is known as a complex W–X–Y–X–Z correction. Essentially, this pattern represents a prolonged sideways pullback where price action forms a series of measured moves within a range. Each of these moves consists of a three-wave (A–B–C) structure. The completion points of these waves can be projected using trend-based Fibonacci extensions to identify symmetrical move targets. When multiple A–B–C structures occur in sequence, they can form a larger W–X–Y–X–Z corrective pattern, with each letter representing the end of a smaller A–B–C correction. To illustrate this, I’ve labeled each minor A–B–C correction with its corresponding Fibonacci projection, showing a clearly defined structure filled with several measured move targets. This pattern is significant because it represents the largest form of correction within Elliott Wave theory, indicating a major decision point for price action. A breakdown from here could signal a Wyckoff distribution pattern, potentially leading to much lower prices. However, if this correction completes and resolves to the upside, the price should resume movement in the direction of the broader trend—which remains upward. Auction Theory Perspective From an Auction Theory perspective, I aim to analyze the trading volume within this range to establish the Low Value, Fair Value, and High Value areas. Auction Theory suggests that when price breaks above a high but fails to sustain momentum, it often gravitates back toward the lower end of the value area—most commonly returning to the Point of Control (POC), or the most heavily traded price zone, also referred to as “Fair Value.” In essence, price tends to oscillate between high and low value areas, frequently retesting fair value as a springboard for potential breakouts. Currently, we appear to be experiencing what’s known as a failed auction at the lower end of the range—where price attempted to break down, failed, and has since reclaimed the value area, potentially finding support near the range lows. If buyers step in here, the logical target would be the opposite end of the range high. Confluence and Outlook What’s particularly compelling is the confluence between the Elliott Wave count and the failed auction setup. Both suggest that Bitcoin is at a pivotal decision point. A successful defense of this value area could lead to a significant move higher, while a decisive breakdown would confirm the completion of a distribution phase and likely signal the start of a more prolonged bear market. I’m particularly interested in how Bitcoin reacts at this key zone, as sentiment is currently at extremely low levels and several technical indicators are pointing toward the potential beginning of a larger upward move. Entry Targets: $103,400 Stoploss: $99,500 (Daily Close) Target: $120k + Only time will tell.
afurs1
تله بزرگ طلا: فریب صعودی که به دام نزولی تبدیل میشود!
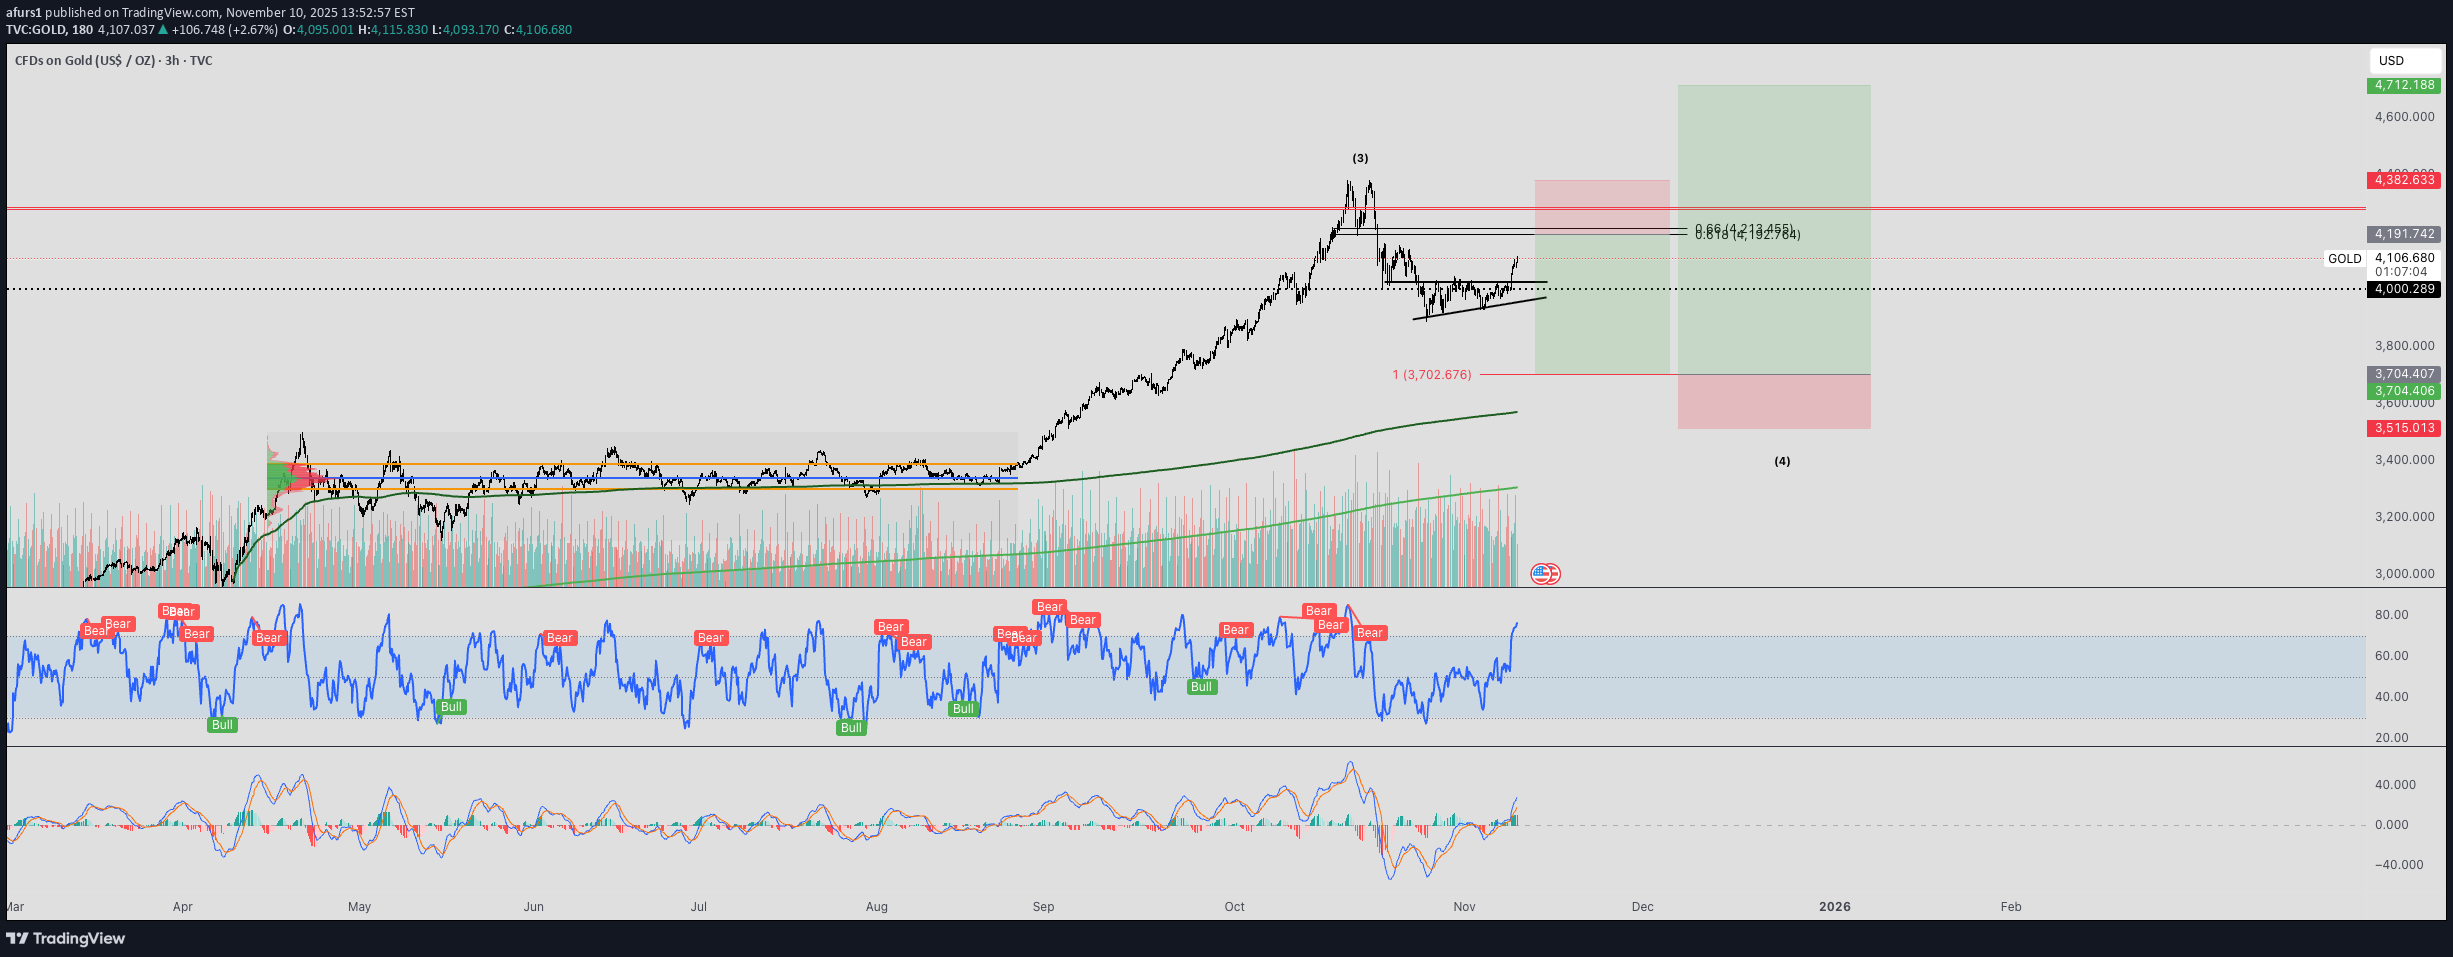
GOLD has been outperforming almost every major asset class for the last 20 years to the surprise of many people including myself. I was only born in the 90's so I have yet to be aware of the power that comes from owning gold. That being said, It would be really nice to see the Gold correction mature here in order for us to grab liquidity which will ultimately bring us to much higher prices. Using some basic technical analysis, I will be watching the 618 retracement zone for a short trade entry with a stop above the ATH. Although I am not as interested in a large size short position if it is provided, I would be very interested in expanding my portfolio with some Gold holdings if my targets are hit, going into 2026. I believe this will be the final 5th wave of the overall Elliot Wave count that begin in 2015 when the new Gold rally had begun. Lets see where the market decides to move.In the perfect world we would see a sharp ABC correction, as the prev correction was a sideways flat , also known as a PIT (pullback in time). According to Elliot Wave principles, you tend to get one of each style correction in a broader 5 wave move. Meaning one is sideways, and another is more aggressive. Since we already know the first correction was a sideways flat, it increases the chances of this wave being a more aggressive pullback.Here is the longer term view , where gold tapped into the 2.618 extension.
afurs1
افت سنگین متا (META): آیا زیر ۶۰۰ دلار فرصت خرید بلندمدت است؟
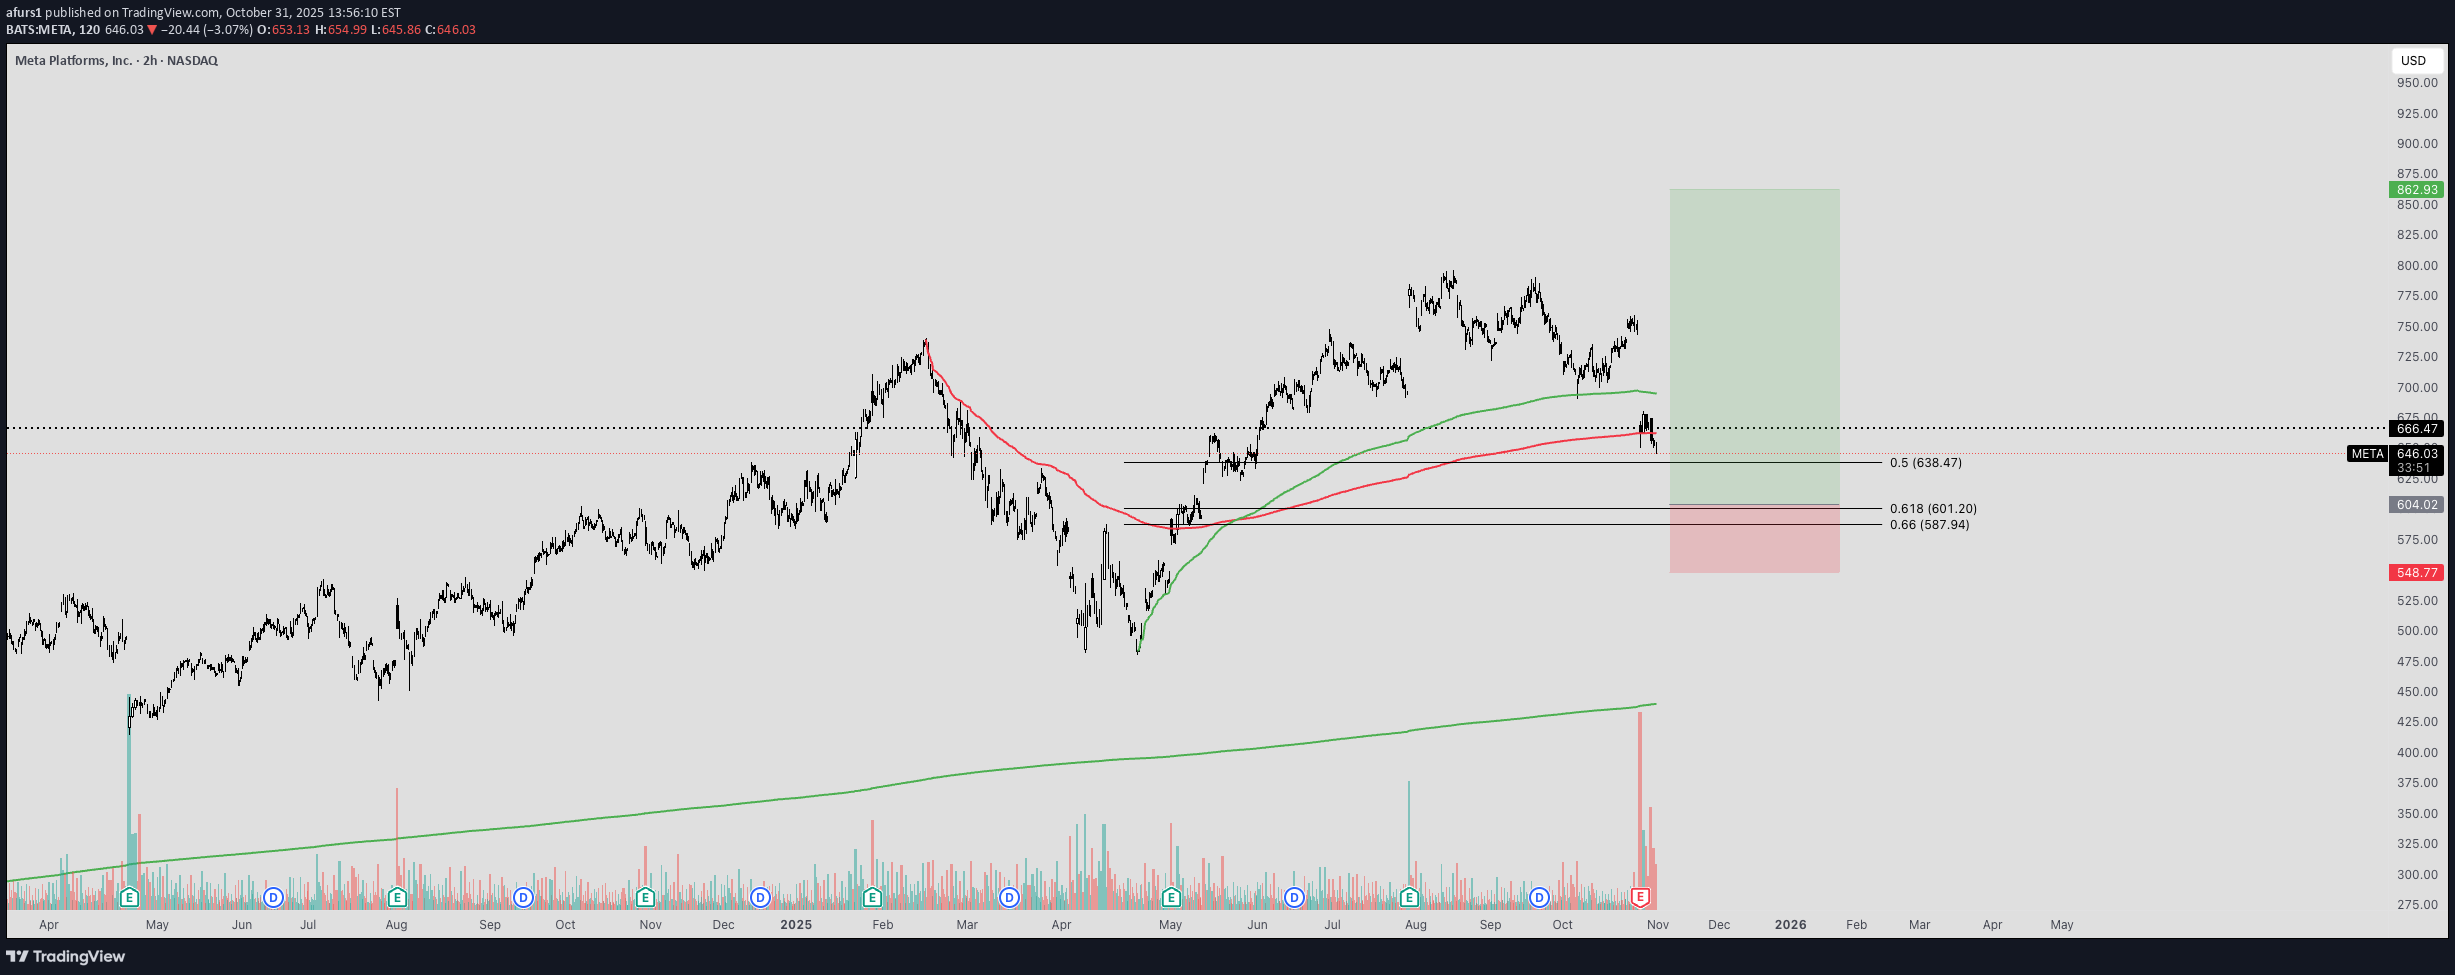
Following a disappointing earnings report, Meta (META) dropped more than 10% in post-market trading, decisively breaking through several key support levels. My primary support zones are typically derived from anchored VWAPs (Volume-Weighted Average Prices), which help identify where institutional buyers may step in to defend trend continuation. However, what’s becoming increasingly concerning is the decisive break below both major VWAPs — one anchored to the previous all-time high and another from the “tariff crash” lows. This type of price action reflects broad-based weakness and a shift in market structure, suggesting that META may be entering a deeper corrective phase. The loss of both VWAPs indicates that long-term buyers are no longer in control of the trend, and that liquidity pockets beneath recent price levels could become magnets for further downside. From a technical perspective, the current setup points toward a potential cascading move lower into the 0.618 Fibonacci retracement zone, which also aligns with multiple unfilled gaps on the chart. These confluence zones often act as high-probability areas for price stabilization or reversal, particularly when accompanied by a sentiment washout or capitulation event. Moving forward, I’ll be closely monitoring the sub-$600 area as a potential longer-term accumulation zone. This region not only coincides with that Fibonacci retracement but could also mark the completion of a higher-degree corrective structure within the broader uptrend. Once price stabilizes, I plan to develop a detailed Elliott Wave projection to map out the next impulsive leg higher — ideally one that reestablishes META’s leadership role among the large-cap tech names. In summary, while short-term weakness appears dominant, the upcoming retracement could offer an attractive buying opportunity for patient investors, provided the broader market context and technical structure begin to realign in favor of the bulls.The current correction can be viewed as a double combo (WXY) , meaning it is a combination of multiple measured moves to the downside. The initial wave is labeled as an ABC, where the trend based fib extension points towards a measured move of approx $716, followed by the broader WXY where the initial ABC correction sets the W pivot, following an X move retracement, and then a final move lower for Y. Interestingly enough, the trend based fibonacci is pointing to a similar price as the 618 zone.Another stacked confluence, the most traded zone of the tariff crash being in line with the retracement zone.Will be attentive tomorrow as we may have an opportunity to ladder in at the target zoneStarting to ladder into this position now that we are approaching target! Will make my largest purchase below $600 if it is givenNice bounce right at the 618 where i expectedCan tighten the stop now to a daily close below the prev low, making for a very low risk potentially high reward tradeReclaiming $668 would be a major sign of strength. I would view this drop as a deviation out of the fair value trading range based on the volume profile which could propel META back to the opposite end of the range near ATHLooking great, Ill be watching how this one progresses and update further context once more data is available.
afurs1
آیا اپل به قله رسیده است؟ بهترین زمان خرید بعدی در محدوده ۲۲۷ دلار!
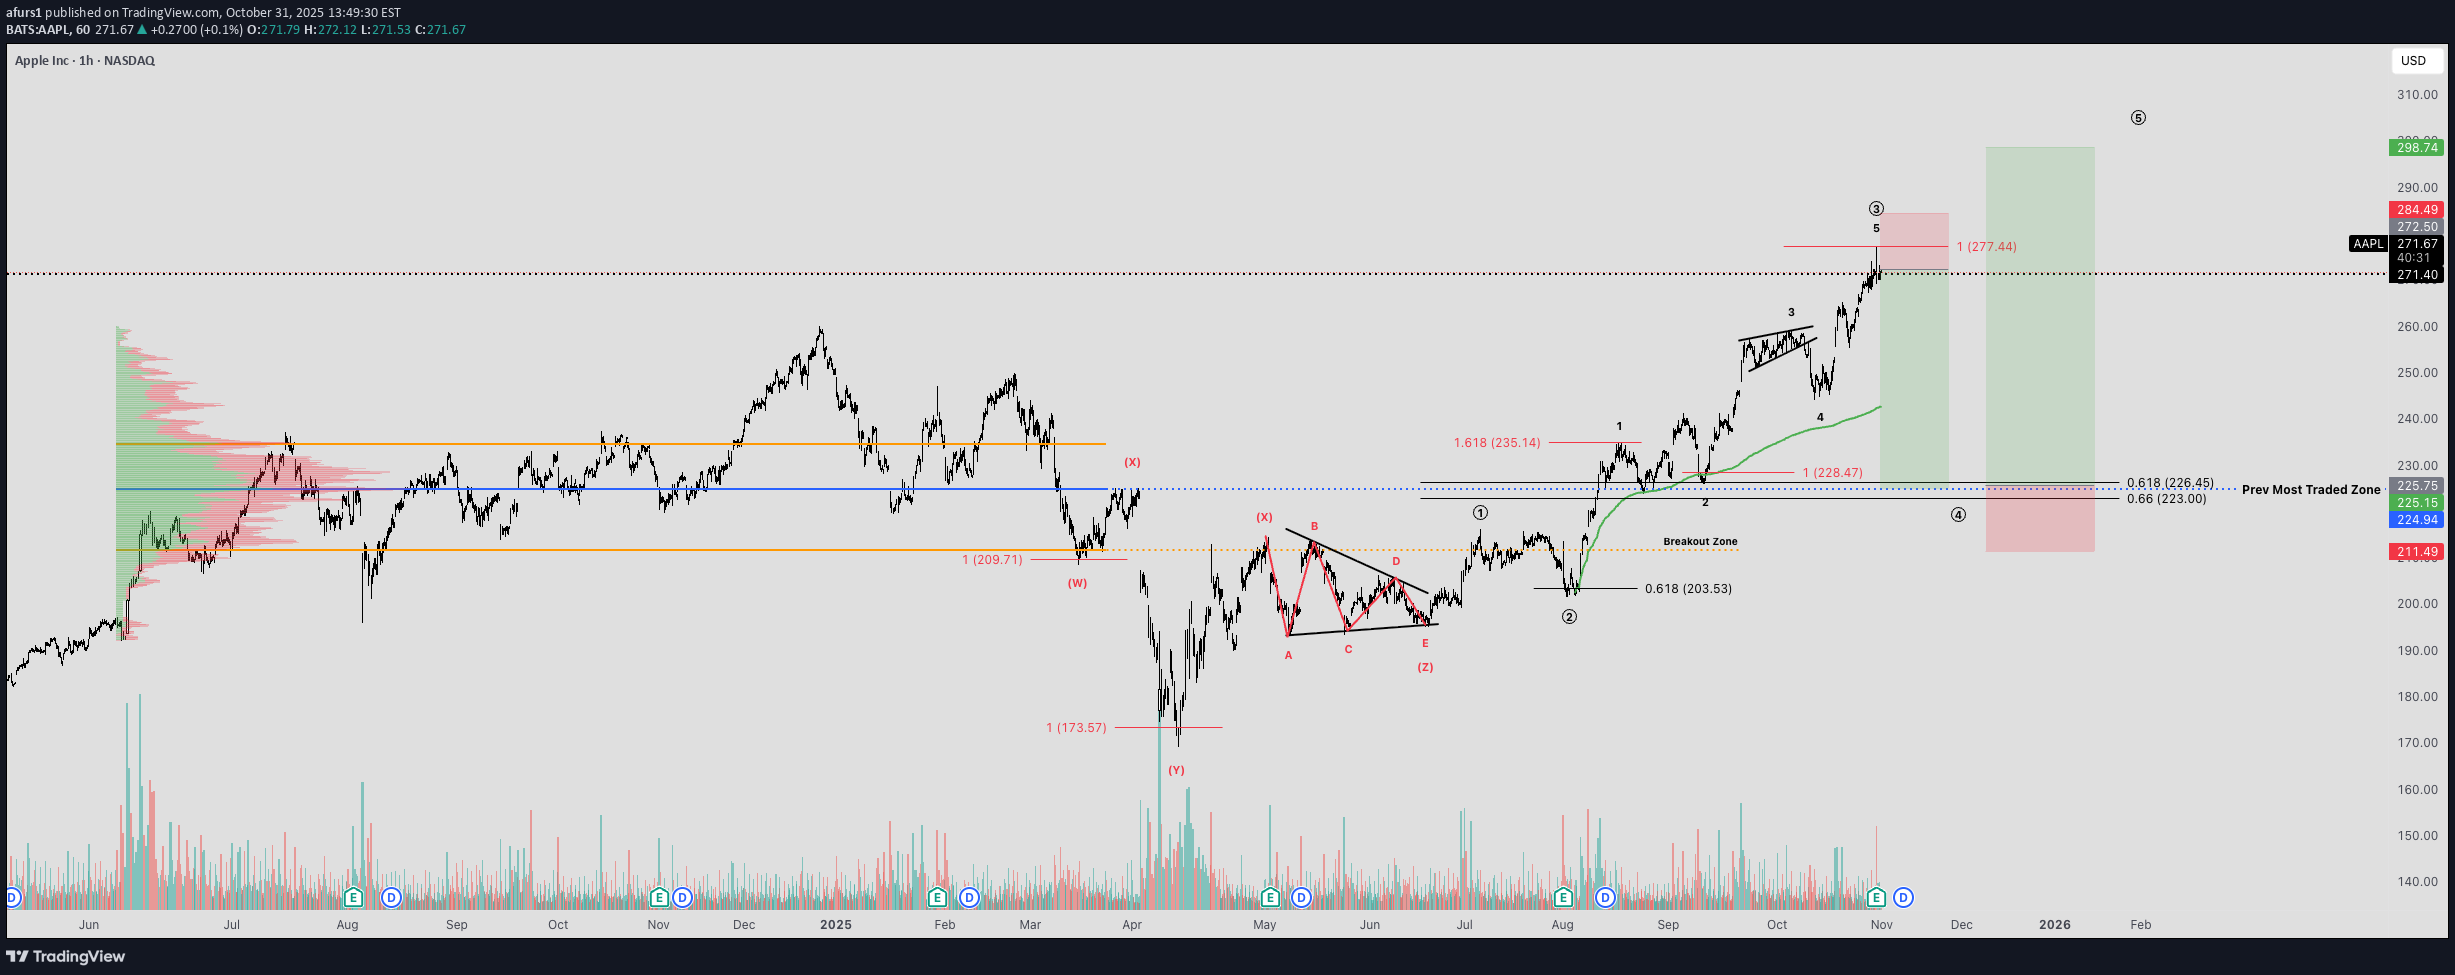
Apple has been one of the lagging stocks I’ve analyzed in previous posts, where I discussed its price action as a major underperformer compared to the broader indices and other large-cap stocks. As a mega-cap company, Apple is undeniably one of the key drivers of both the index and the overall market. If Apple begins a correction, there’s a strong likelihood that the index itself will trade lower as a result. Following the completion of a complex combination correction (W–X–Y–X–Z), where the final Z-wave forms a triangle, we can apply trend-based Fibonacci extensions to project the contractionary phases in the market based on prior structure. Since this is a corrective wave, once it completes, price action should rotate back into the broader uptrend, currently surpassing the previous high by roughly $17. I also believe the Elliott Wave count here identifies the current structure as the top of Wave 3. The recent push into new highs appears to be a three-wave corrective structure (A–B–C), with the 1 to 1 trend-based Fibonacci extension suggesting an expansion target near $277 — potentially marking an earnings high and a “sell-the-news” opportunity or, at minimum, a take-profit zone. If Apple starts to break down from current levels, I’d be closely watching for a move back toward the previous most-traded zone, shown as the blue Volume POC on the chart. This would align with Elliott Wave theory, which states that Wave 4 cannot overlap the high of Wave 1. Since the first correction in this structure appears to be a flat A–B–C, Wave 4 could potentially be deeper and more pronounced. A pullback toward the $227 level would be particularly attractive to me as a long-term investment opportunity in Apple.This is the 3 Wave ABC into the peakGreat reaction thus farRejecting at the 618 zone for a continuation. It would be really nice to see this gap get filled at the very least
afurs1
تصفیه حساب سنگین پیش از پامپ بیت کوین: آیا کف بازار همینجاست؟
In the past 24 hours, the crypto market has experienced a significant wave of liquidations, with estimates ranging from several hundred million to over one billion USD. Bitcoin’s share of these liquidations appears relatively modest—amounting to tens of millions—while the majority of forced exits have occurred in altcoins and leveraged positions. After briefly dipping toward the $100K level, Bitcoin’s price action formed a substantial downside wick, suggesting an area that sellers may look to retest should further downward pressure persist. I’m currently watching for a potential scalp short opportunity just below $120K, as overall crypto enthusiasm—particularly in altcoins—appears to be fading. That said, even if the price revisits the $100K zone, I wouldn’t turn excessively bearish. Historically, similar periods of panic have coincided with major market bottoms, such as during the COVID crash, which ultimately preceded a parabolic rally. Additionally, I’ve identified what may be a complex Elliott Wave structure known as a Triple Combination Correction, consisting of multiple ABC (three-wave zigzag) formations. Elliott characterized these as corrective patterns that often maintain mathematical relationships to preceding waves—relationships that can be measured using a trend-based Fibonacci extension across the three initial pivots. Traders commonly refer to such projections as “measured moves.” This price behavior also aligns with Wyckoff’s principles of distribution, in which the secondary X-wave represents the UTAD (Upthrust After Distribution) before price retraces toward the origin of the W-wave. For additional confluence, I’m monitoring key support areas such as the previous low VWAP. For now, however, my primary focus remains on observing the likelihood of a bounce between $98K and $100K, based on the outlined technical structures.Slowly making the way uptextbook anchored vwap rejectionCould be getting the downside here
afurs1
SOLANA Dream Buy Zone

Solana is currently forming a very interesting potential ABC corrective structure leading into the 1-1 trend based fibonacci extension being approx. $215. The end of this current Wave C is forming an ending diagonal nearing the apex. According to Elliot Wave theory, ending diagonals (wedges) tend to occur when the existing directional trend is showing signs of exhaustion and requires a pricing reset/rebalance. This can occur as a very fast, sharp move downwards before continuing in the direction of the broader trend which remains to the upside. What interests me is the several zones of confluence that line up just below $180, being the overall target of the wedge, as well as the location of both major VWAP's from the high and the low , that can act as major support zones for a bounce. This drop could be fast and scary, likely to shakeout many traders and investors especially those on high leverage. Ive set my alerts here at the zone for a major long trade that could sustain itself to new highs.Here is how I would count it. Meanwhile the trend based fib extensions are respecting the wave analysis.We instead simply pumped and dumped into the weekly level. And this scenario may be very real going into the next few daysHere we go, I would also be aware of the 147ish zone, which is the most traded price within the zoneLong Trade active!Dont know If I really like this price action. Lets sit out for now and wait for some more clarity.
afurs1
SOL Ready to RIP

Solana has been demonstrating notable resilience in recent sessions, consistently finding support along a well-defined local uptrend visible on the 1H, 2H, and even 4H timeframes. The $200 level continues to serve as a critical inflection point, acting as both historical support and resistance, with price repeatedly testing but struggling to establish firm acceptance above this zone. That said, with Ethereum showing renewed strength and capturing market attention, we could begin to see capital rotation into other leading altcoins as investors look for relative value and potential catch-up plays. This type of market dynamic often precedes what many refer to as “alt season,” when capital flow broadens beyond Ethereum and Bitcoin, sparking accelerated moves across the broader crypto market. Whether this backdrop evolves into the explosive breakout traders are anticipating remains uncertain—but the stage appears to be set. As always in these markets, conviction must be balanced with patience, as only time will ultimately reveal whether the momentum materializes into the massive move so many are hoping for.
afurs1
The Next Big Crypto Trade

Bitcoin has experienced a notable decline following a failed auction attempt after sweeping all-time high liquidity. This move is now being followed by a significant retracement toward the lower boundary of the broader range, with the current range low positioned around $111K. In contrast, MicroStrategy (MSTR) has exhibited a more structurally defined downtrend, having broken below its previous pivot low. This price action potentially forms a textbook ABC corrective pattern, with the 1:1 extension target clearly identifiable. Should the broader market continue to decline in the lead-up to this week’s FOMC meeting and Powell’s remarks, a compelling long setup may emerge. This could coincide with a potential 'sell-the-news' reaction, particularly if the Federal Reserve moves to cut interest rates. Rate-sensitive equities and assets may initially respond to such news with bullish enthusiasm, possibly triggering a wave of market euphoria and leading to a short squeeze scenario. I’m closely monitoring the $320 level on MSTR, which aligns with three key technical confluences: The 0.618 Fibonacci retracement level from the overall move (swing low to swing high). The 1:1 extension target of the possible ABC corrective structure. A key support/resistance flip zone, which may mark a potential structural pivot point. This zone presents a high-probability area for potential price reaction. Let’s see how this plays out.You can see we have 2 major volume zones from the accumulation range. Lets see if we bounce from either of themFor now, patiently waiting for the market to come closer to my pullback target for what could be an ABC correction here within the range.Currently trading into the GAP zone, should we get a bounce here, I like this for the long trade.Finally into the levels. Taking the long trade, and building the swing as we drop. I will ladder into this position with 3 entries.How you like thatDecent reaction so far... For further continuation, price would need to change market structure at key levels to reverse the trend. We do have a major news catalyst tomorrow at 8:30am est,so I will monitor the pre-markets to see where price may be moving to.MSTR needs to reclaim 335 to show some strengthGame timeAccumulation rangeBroader picture, MSTR is still respecting the 1-1 target for the correction at the lowsfood for thoughtGetting the breakoutLets get the pump startedTP1Getting a bit of a pullback today, to establish some clarity of a potential reversal. I would prefer to see the stock maintain above the 344ish zone, marked by the orange line on the volume profile as this is the higher end of the accumulation range. Holding this zone would increase probabilities for the next push higher.So far breaking below, but in the formation of a corrective structure. So for now daily closes are more important as this to me is more so a liquidity zone, and perhaps area to compound the tradeExactly what I wanted to seeSubtle mini crash overnight on BTC. But MSTR is recovering well, should we reclaim above the same level as Friday (338) then this is likely just a stop run / volatility / deviation of the broader uptrend.Just need this prev day low to hold nowWe also have the 618 retracement. My thoughts are, if this is the real breakout and we have a feint now to shake out weaker hands then this is the place to bounce fromLooking good, this zone is also the s/r flip of the previous balance rangeWould be really nice to get an inverse h&s and mimic the symmetry from the drop.welp that is dissapointing, seems a bit weaker than I expected... Last level to hold is now the value area low of this range being $326. Lose that and I will be stopped outLost 326 and stopped outGoing to take a new long position here as MNAV hits a record low, as well as the prev range most traded zone, in confluence with the anchored vwap from the previous low pivot.Need to get above the 320 zone to confirm this deviation / stop huntNice reaction thus farWhat a crazy shakeout, now getting acceptance back into the range. Lets get the daily close above $320 todayTextbook wycoff accumulationKey Area of support for the Wycoff is $325 now.Nice closeAs per wycoff, this is the restest of the support that needs to hold in order to move into the next phase.So far being respectedThis rise can be aggressive nowThere is the aggressive rise
afurs1
TESLA ABC Trap Zone

Tesla’s price action has been exhibiting a period of consolidation characterized by lateral movement, forming a pattern commonly identified as a triangular structure. Triangular formations, by their nature, have the potential to break out in either direction—upward or downward—depending on market dynamics. However, my focus is particularly on recognizing this pattern within the context of an Elliot Wave ABC corrective structure. Specifically, the second wave in this sequence appears to manifest as a triangle, suggesting a phase of market indecision and consolidation. This phase is typically followed by a final impulsive move downward, which would serve to complete the overall corrective pattern. Understanding this sequence is critical, as it provides insight into the potential continuation or reversal of Tesla’s price trend after the correction concludes.For now, the chart is showing my more likely hood of the bullish scenario for continuation to the upside.Here is the bearish count
Disclaimer
Any content and materials included in Sahmeto's website and official communication channels are a compilation of personal opinions and analyses and are not binding. They do not constitute any recommendation for buying, selling, entering or exiting the stock market and cryptocurrency market. Also, all news and analyses included in the website and channels are merely republished information from official and unofficial domestic and foreign sources, and it is obvious that users of the said content are responsible for following up and ensuring the authenticity and accuracy of the materials. Therefore, while disclaiming responsibility, it is declared that the responsibility for any decision-making, action, and potential profit and loss in the capital market and cryptocurrency market lies with the trader.