a_tale_of_bulls_and_bears
@t_a_tale_of_bulls_and_bears
What symbols does the trader recommend buying?
Purchase History
پیام های تریدر
Filter
Signal Type

a_tale_of_bulls_and_bears

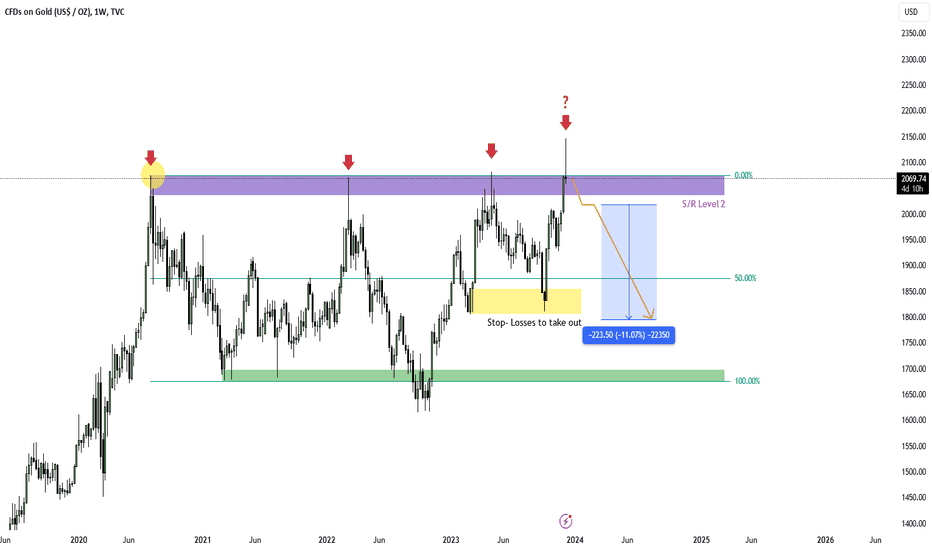
Since the top (yellow circle) that was created in August 2020 Gold has been ranging. Three times price tried to move above the resistance level (S/R Level 2) but got pushed down every time. Now the fourth try and it doenst look ... watch out bad pun... golden for the bulls. Its still not decided as the weekly candle just started. However i will take a short if price should fall below S/R Level 2.I will narrow down my entry as shortly after the weekly close. Entry: Price falling below S/R Level 2 and closing on a weekly level. Invalidation: Price doenst close below S/R Level 2 S-L: Price retaking S/R Level 2 after a close below Target: Minor Swinglow where the current move started aswell a nice area to trigger the Stop- Losses of many people. Good luck Disclaimer: - My posts are mostly for my own journaling - This information does not constitute as financial advice and is only for educational purposes. I am not your financial advisor. - You trade entirely at your own risk - Make your own research - Finance and trading is evil, capitalism is bad, duh ;)Personally like the current reaction on the daily. Will open a short soon.Trade was opened before it met my requirements as the volatile reaction fits my risk criteriaIf tho price went against me, adjusted SL to a bit above S/R Level 2Stop- Loss was triggered

a_tale_of_bulls_and_bears

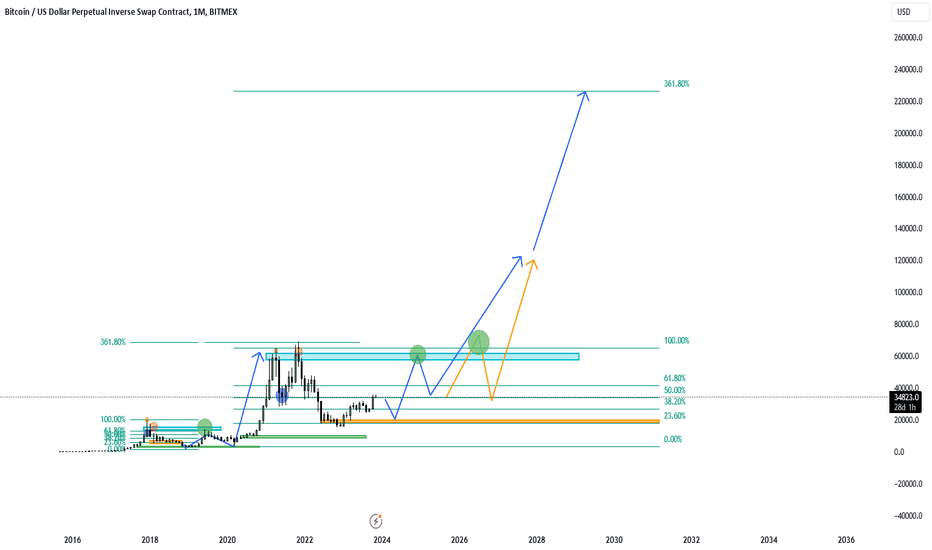
As its been almost over a year since i posted an analysis on Bitcoin its about time with the current strong uptrend. In my idea i compared the two bull markets of 2017/2018 with the one from 2020/2021 and showed how similiar they were. To quote from my previous analysis (You can find a Link to the original post below) #### 1. We created a top (orange circle) 2. Downtrend and retest of the 50% of the swing 3. Uptrend from the 50% and creating a swing high that takes out a big upper resistance 4. Again going towards 50% but this time no big demand showing up 5. Fall under the 50% - this is where we are now in the current swing If we continue like in the first swing we should see price falling towards the 23.60% level which interestingly is in confluence with the big resistance level (orange line) that created the 2017/2018 top. ### The last part happened recently, however i expected a deeper correction. I still expect a drop to the orange area around the 23.60% Fib level. This also happened before the 2020/2021 bullmarket started. I marked (arrows) two potenial scenarios that i can see happening. Currently i favor the blue scenario. In both cases the orange area where i look to add further spot BTC and additional leveraged positions. Both scenarios are also based on another occurance that happened between the 2 previous bullmarkets: A retest and breakdown of the resistance level that stopped the uptrend / bullmarket. (see the 3 green circles) Target for the next Bullrun Current target: Around 225 000 USD. Thoughts why this target: - The 361.80% Fib extension of 2017/2018 bullmarket was also the ATH of the 2020/2021 bullmarket - 100 000 USD / Bitcoin seems to be expected by too many people, therefor many might sell there and be surprised by the harsh movement up after. We can see the uptrend of 2020/2021 was the harshest after price passed 30k and 40k - catching many traders offguard. Good luck Disclaimer: - My posts are mostly for my own journaling - This information does not constitute as financial advice and is only for educational purposes. I am not your financial advisor. - You trade entirely at your own risk - Make your own research - Finance and trading is evil, capitalism is bad, duh ;)Estimated Bitcoin halving date: April 18, 2024

a_tale_of_bulls_and_bears

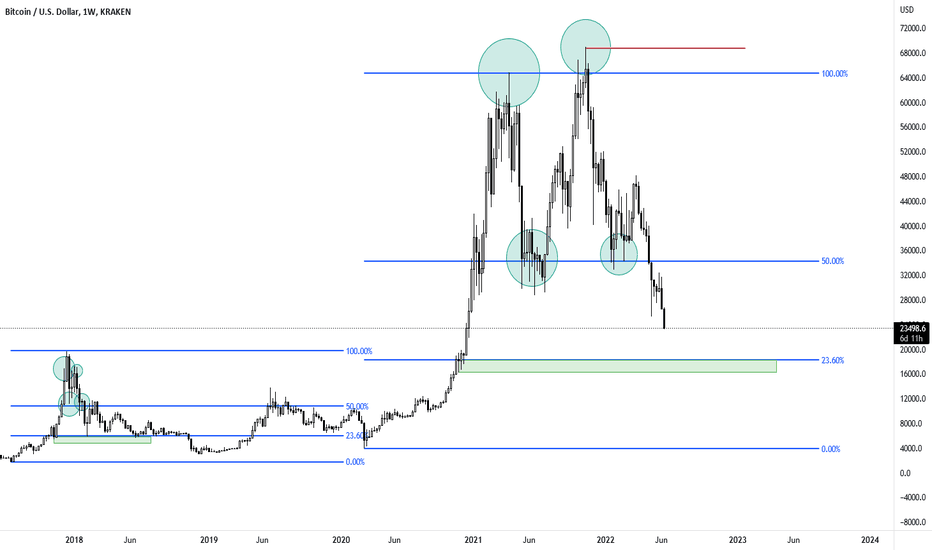
I posted a similiar chart as private idea some days ago. ( tradingview.com/chart/XBTUSD/lDhV0hKb-Bitcoin-The-Dark-Knight/) This idea here is an updated slightly adjusted version. If i look at the big rise from 2017/2018 and our current swing i see certain similarities. 1. We created a top. 2. Downtrend and retest of the 50% of the swing. 3. Uptrend from the 50% and creating a swing high that takes out the big upper resistance 4. Again going towards 50% but this time no big buying showing up. 5. Fall under the 50% and heading towards the 23% - this is where we are now in the current swing If both swings move similiar we should see the following happening now: 1. Move to the 23% level. 2. Buyers show up push price again towards the 50% level - but no clean retake 3. Price falling down again to the 23.60 Additional: In Both times we had Engulfs or SFPs of the High. Problems with this analysis: We cant deny that the retest of the 50% level on the second swing generated a Higher High (red line) - however its a weak Higher High as it barely went above the recent swinghigh. Besides the similiarities with the shakeout and retest of 2017. I classified it even as divergence or engulf in my recent analysis.Price approaching green levelPrice dipped into the green area and a small reaction so farOpened a leveraged longSo far so good - around +6% up. But could imagine if that is the bottom that we might see a retest / shakeout.Personally i dont like the current structure Bitcoin developed. Price swept above GSH1 and fell this is to me very bearish. Closed my lev. longs and only holding for longterm. For lev. i would want to see either price going above GSH1 or price sweeping under the green support zone and reclaiming it.~ +60%

a_tale_of_bulls_and_bears

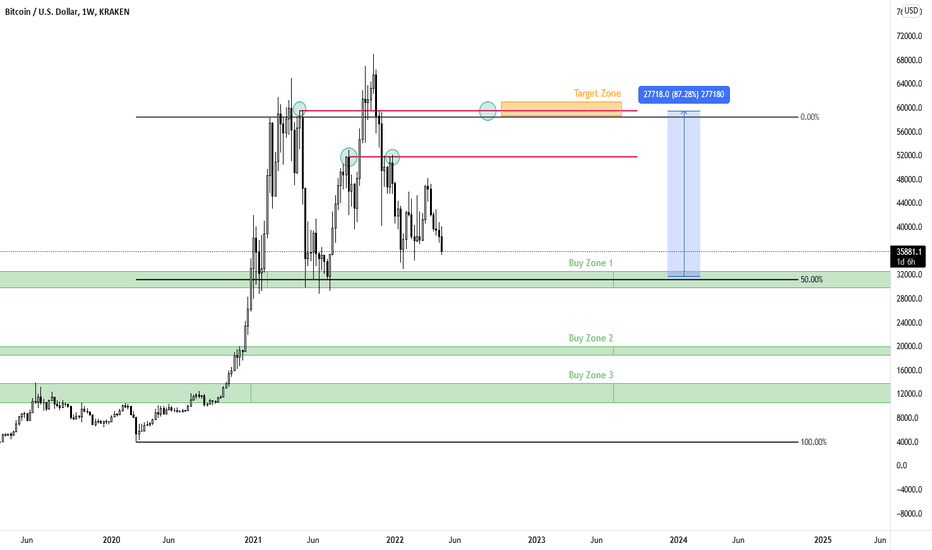
BTC price currentl moving down towards a big support level that generated the last ATH. I marked 3 Zones where i will buy equally amounts for a long term hold. Target is the orange rectangle (Target Zone).Favorite Zone is Buy Zone 1 as it has a nice confluence with the 50% of the current range and as mentioned above its from where the last ATH (all_time_high) was created from. Its where my biggest buy orders are placed.Reason for the target zone is that BTC in my expierence likes to create engulfed tops / bottoms and retests them before further movement. Good luckDisclaimer:- This information does not constitute as financial advice and is only for educational purposes. I am not your financial advisor.- You trade entirely at your own risk- Make your own research- Finance and trading is evil, capitalism is bad, duh ;)1/3 position filled2/3 position filled (i placed 3 orders at the top, center and bottom of buy zone 13/3 was filledPrice approaching buy zone 2Again 3 orders placed at the top, center and bottom of buy zone 2Postion 3 of 3 filled at buy zone 2
Disclaimer
Any content and materials included in Sahmeto's website and official communication channels are a compilation of personal opinions and analyses and are not binding. They do not constitute any recommendation for buying, selling, entering or exiting the stock market and cryptocurrency market. Also, all news and analyses included in the website and channels are merely republished information from official and unofficial domestic and foreign sources, and it is obvious that users of the said content are responsible for following up and ensuring the authenticity and accuracy of the materials. Therefore, while disclaiming responsibility, it is declared that the responsibility for any decision-making, action, and potential profit and loss in the capital market and cryptocurrency market lies with the trader.