Technical analysis by a_tale_of_bulls_and_bears about Symbol BTC on 6/13/2022

a_tale_of_bulls_and_bears
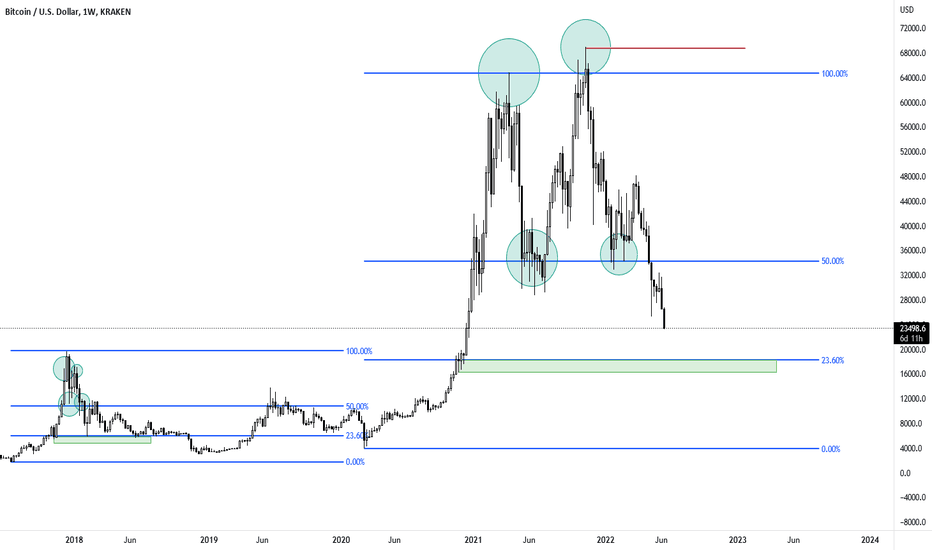
I posted a similiar chart as private idea some days ago. ( tradingview.com/chart/XBTUSD/lDhV0hKb-Bitcoin-The-Dark-Knight/) This idea here is an updated slightly adjusted version. If i look at the big rise from 2017/2018 and our current swing i see certain similarities. 1. We created a top. 2. Downtrend and retest of the 50% of the swing. 3. Uptrend from the 50% and creating a swing high that takes out the big upper resistance 4. Again going towards 50% but this time no big buying showing up. 5. Fall under the 50% and heading towards the 23% - this is where we are now in the current swing If both swings move similiar we should see the following happening now: 1. Move to the 23% level. 2. Buyers show up push price again towards the 50% level - but no clean retake 3. Price falling down again to the 23.60 Additional: In Both times we had Engulfs or SFPs of the High. Problems with this analysis: We cant deny that the retest of the 50% level on the second swing generated a Higher High (red line) - however its a weak Higher High as it barely went above the recent swinghigh. Besides the similiarities with the shakeout and retest of 2017. I classified it even as divergence or engulf in my recent analysis.Price approaching green levelPrice dipped into the green area and a small reaction so farOpened a leveraged longSo far so good - around +6% up. But could imagine if that is the bottom that we might see a retest / shakeout.Personally i dont like the current structure Bitcoin developed. Price swept above GSH1 and fell this is to me very bearish. Closed my lev. longs and only holding for longterm. For lev. i would want to see either price going above GSH1 or price sweeping under the green support zone and reclaiming it.~ +60%
