
ZareeFxTradingAac
@t_ZareeFxTradingAac

What symbols does the trader recommend buying?
Purchase History
پیام های تریدر
Filter
ZareeFxTradingAac
XAUUSD (Altın Spot) – 1 Saatlik Grafik Teknik Analizi
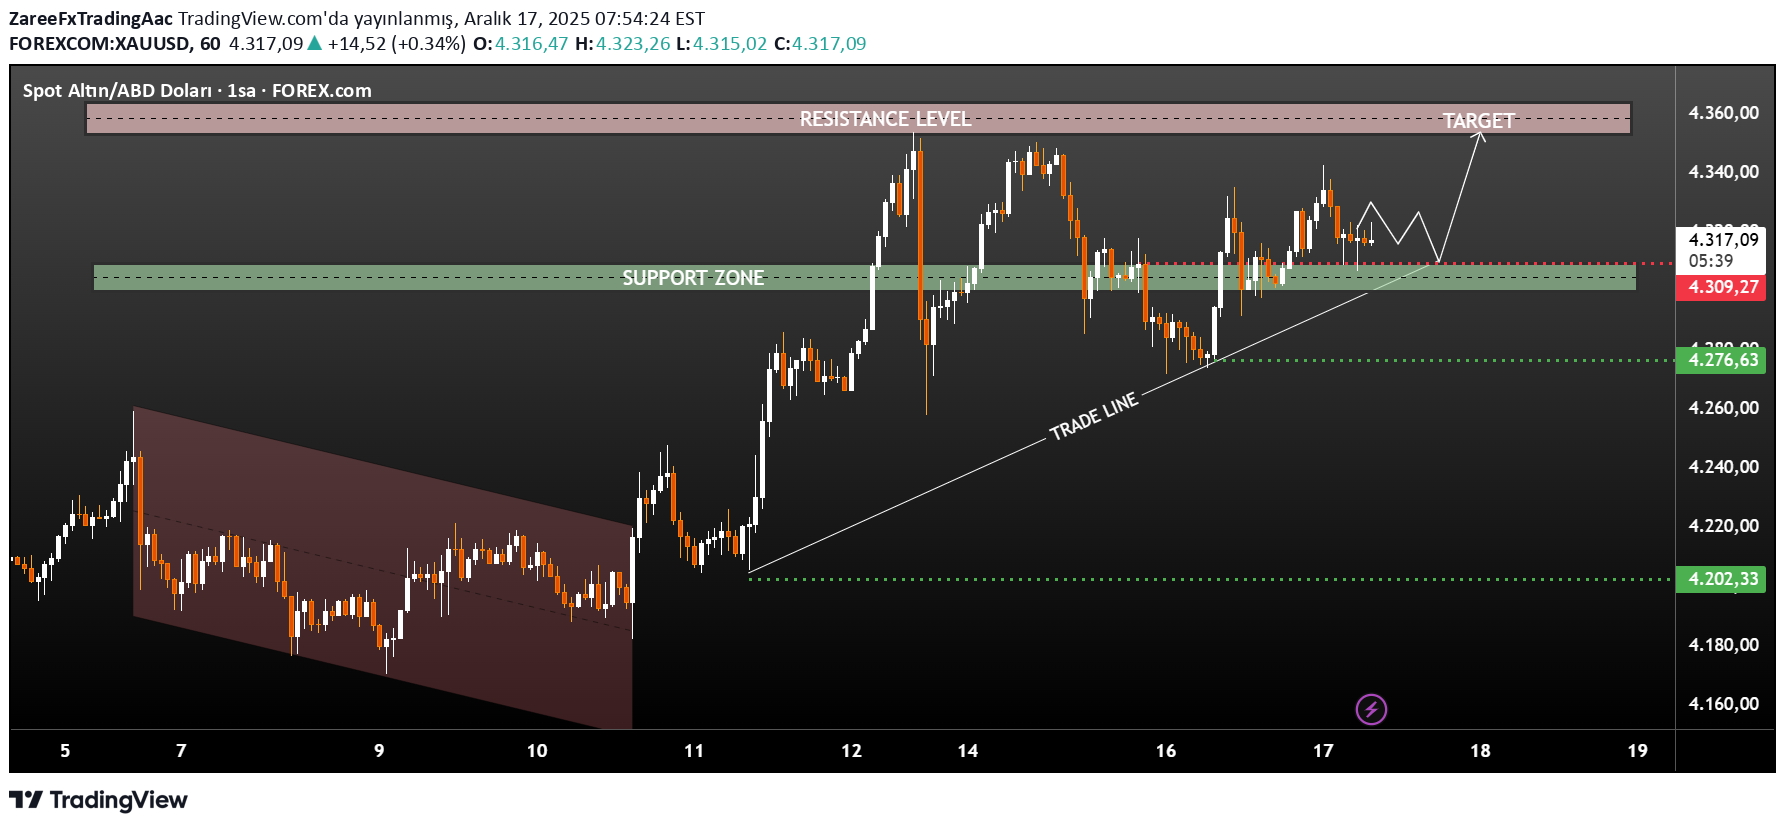
Piyasa Trendi Genel yön: Yükseliş Fiyat, düşen kanaldan güçlü şekilde yukarı kırılarak trend dönüşünü teyit etmiştir. Mevcut piyasa yapısı daha yüksek zirveler ve daha yüksek dipler oluşturarak yükselen trend çizgisi ile desteklenmektedir. Önemli Seviyeler Destek bölgesi: 4300 – 4310 Birden fazla kez test edilip korunmuştur Güçlü alıcı ilgisi bulunmaktadır Dinamik destek: 11 Aralık’tan gelen yükselen trend çizgisi Direnç bölgesi: 4355 – 4365 Daha önce satış baskısının görüldüğü alan Hedef bölge: 4365 üzeri Direnç kırılımı yeni bir yükseliş ivmesi oluşturabilir Price Action Analizi Güçlü yükselişten sonra fiyat, destek üzerinde konsolidasyon yapmaktadır; bu sağlıklı bir görünüm. Satıcı baskısı zayıf, alıcılar kontrolü elinde tutuyor. Destek bölgesindeki uzun alt fitiller, alıcı savunmasını göstermektedir. İşlem Senaryoları Yükseliş senaryosu (öncelikli): Fiyat 4300 üzerinde kaldığı sürece 4355 → 4365 seviyelerine doğru hareket beklenir Direncin net kırılması yeni zirvelerin önünü açabilir Düşüş senaryosu (destek kırılırsa): 4300 altında kalıcı kapanış 4275 – 4200 bölgesine doğru geri çekilme olasıdır Sonuç XAUUSD, 1 saatlik zaman diliminde yükseliş trendini korumaktadır. 4300 destek bölgesi üzerinde kaldığı sürece, yukarı yönlü beklenti 4360 ve üzeri seviyelerdir.
ZareeFxTradingAac
XAUUSD (Gold Spot) – 1H Chart Technical Analysis
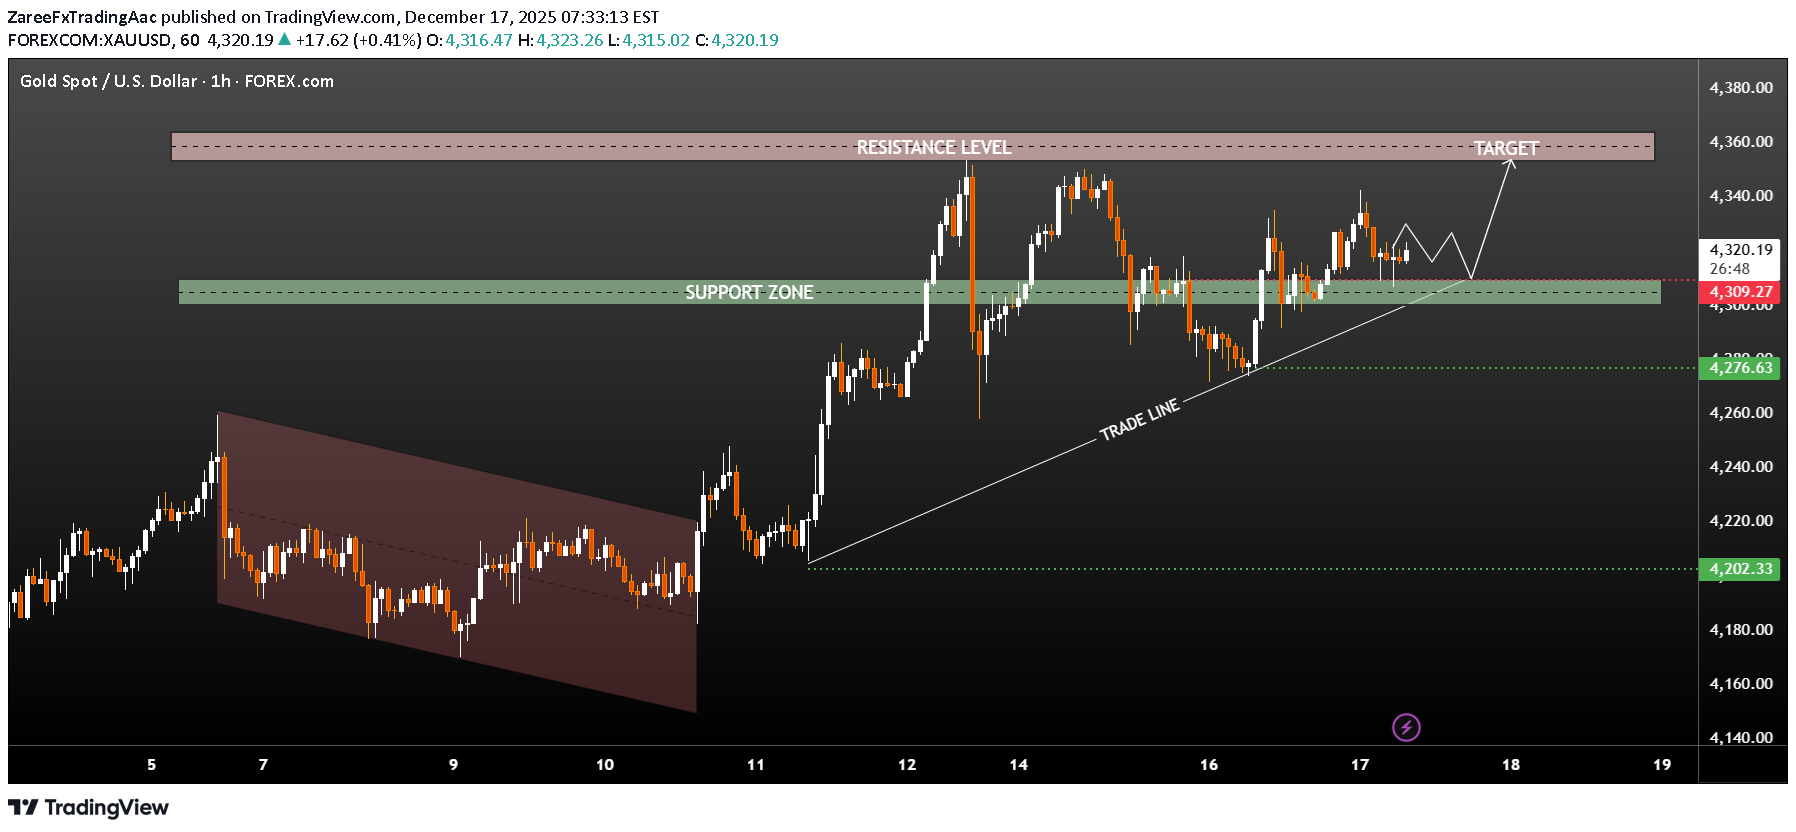
Market Structure Overall Bias: Bullish continuation Price transitioned from a descending channel (left side) into a strong impulsive rally, confirming a trend reversal to the upside. Current structure shows higher highs and higher lows, respecting an ascending trendline (“trade line”). Key Levels Support Zone: 4300 – 4310 Multiple successful retests Acts as a demand zone and trend continuation base Dynamic Support: Rising trendline from the Dec 11 low Resistance Zone: 4355 – 4365 Clear supply area with prior rejection Upside Target: 4365+ Liquidity resting above resistance, aligned with projected breakout path Price Action Insight After the impulsive move up, price entered a healthy consolidation above support. No strong bearish follow-through—suggests accumulation rather than distribution. Wicks below support are being bought aggressively, reinforcing bullish intent. Trade Outlook Bullish Scenario (Preferred): Hold above 4300 Continuation toward 4355 → 4365 Break and close above resistance opens room for new highs Bearish Risk: Clean break and close below 4300 Loss of trendline could trigger pullback toward 4275 → 4200 Conclusion Gold remains bullish on the 1H timeframe, supported by strong structure, clear demand, and ascending momentum. As long as price holds above the 4300 support zone, the probability favors a push into the 4360 resistance and potential breakout.
ZareeFxTradingAac
XAUUSD (Altın) Analizi – 1 Saatlik Grafik: Destek Korunuyor, Ola
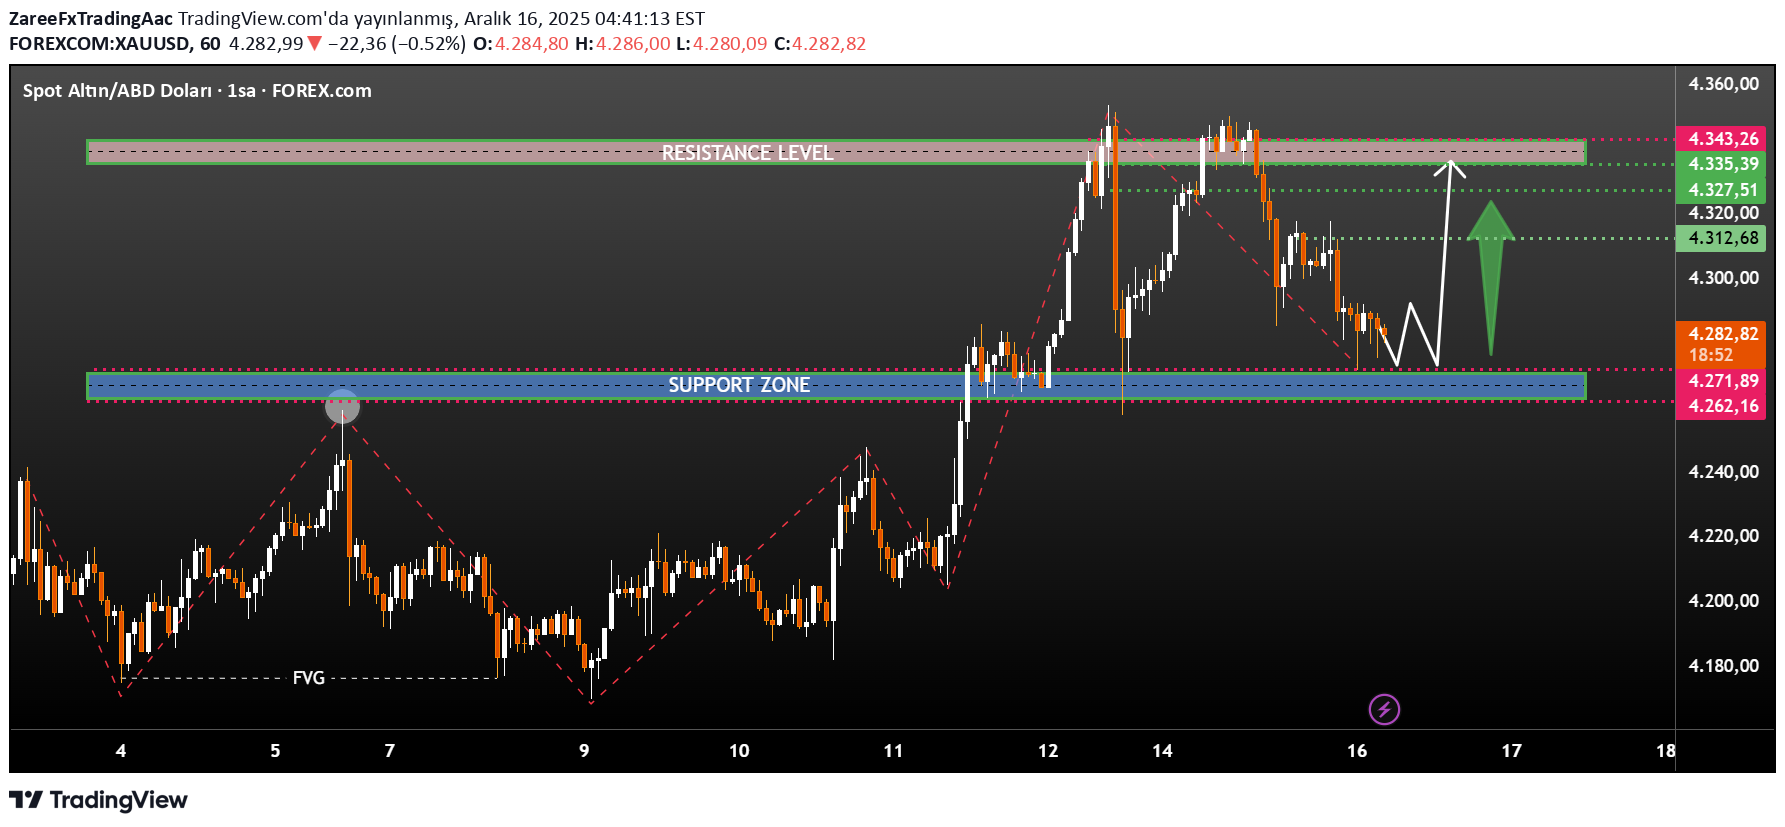
Piyasa Yapısı – Genel Bakış Altın daha önce güçlü bir yükseliş hareketi yaptı ve 4.335 – 4.345 ana direnç bölgesinden net şekilde reddedildi. Bu reddin ardından fiyat düzeltme niteliğinde bir düşüş sürecine girdi ve daha düşük tepeler oluşturdu. Şu anda fiyat, önemli bir talep / destek bölgesinde bulunuyor ve burada tutunma belirtileri gösteriyor. Önemli Fiyat Seviyeleri 🔴 Ana Direnç Bölgesi: 4.335 – 4.345 Geçmişte güçlü satış baskısı Bu bölgenin üzerinde olası likidite 🟦 Kritik Destek Bölgesi: 4.262 – 4.272 Fiyatın birçok kez tepki verdiği alan Önceki kırılım bölgesi → destek dönüşümü 🟢 Ara Seviyeler: 4.312 – 4.320 – Gün içi direnç 4.327 – 4.335 – Direnç öncesi bölge Price Action Değerlendirmesi Fiyat destek bölgesinin üzerinde kalmayı sürdürüyor, bu da satış baskısının zayıfladığını gösteriyor. Düşüş hareketi impulsif değil, düzeltme niteliğinde, bu da yükselişin devam etme olasılığını artırıyor. Beklenen yapı: Destekten tepki Küçük bir geri çekilme (daha yüksek dip) Direnç bölgesine doğru yükseliş Yükseliş Senaryosu (Tercih Edilen) ✔ Destek korunur ✔ 1H grafikte higher low oluşur ✔ 4.312 – 4.320 üzerine kırılım ve kapanış 🎯 Yükseliş Hedefleri: Hedef 1: 4.320 Hedef 2: 4.335 Hedef 3: 4.345 (ana direnç) Düşüş Senaryosu (Geçersizlik) ❌ 1H mum kapanışı 4.260 altı 4.230 – 4.200 bölgesine doğru düşüş riski Yükseliş beklentisi geçersiz olur Sonuç Altın, fiyat 4.262 – 4.272 destek bölgesinin üzerinde kaldığı sürece teknik olarak yükseliş eğilimini koruyor. Grafik, onay alınması hâlinde pullback ve yükselişin devamı senaryosunu destekliyor. 📈 Bias: Destek üzerinde yükseliş ⚠️ Risk: Destek bölgesinin kırılması
ZareeFxTradingAac
XAUUSD (Gold) 1H Chart Analysis – Support Hold & Potential Bulli
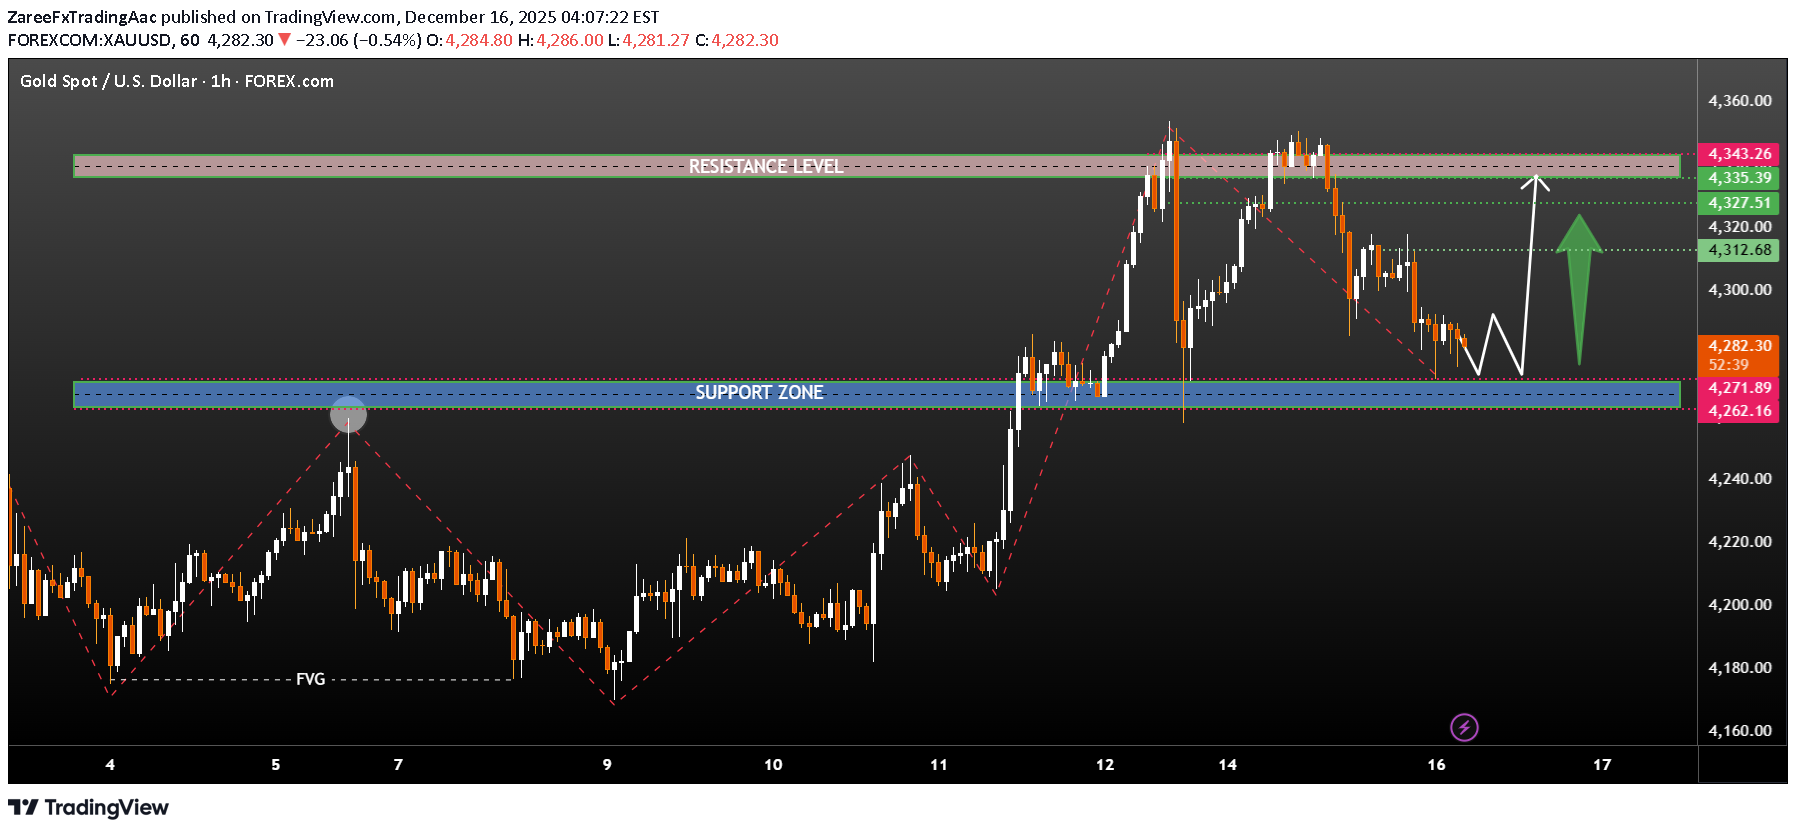
Market Structure Overview Gold previously rallied strongly and rejected from a major resistance zone around 4,335 – 4,345, forming a clear distribution top. Price then entered a corrective bearish move, respecting a descending structure (lower highs). The decline has now brought price back into a well-defined demand / support zone. Key Levels 🔴 Major Resistance Zone: 4,335 – 4,345 Strong rejection previously Liquidity resting above this area 🟦 Key Support Zone: 4,262 – 4,272 Multiple reactions Structure base & demand Prior breakout zone → support flip 🟢 Intermediate Levels: 4,312 – 4,320 → intraday reaction area 4,327 – 4,335 → pre-resistance zone Price Action Insight Price is currently holding above the support zone, suggesting seller exhaustion. The corrective move appears structured, not impulsive → favors continuation higher. The projected path shows: Bounce from support Minor pullback (higher low) Continuation toward resistance Bullish Scenario (Preferred) ✔ Support zone holds ✔ Higher low forms on 1H ✔ Break above 4,312 – 4,320 🎯 Targets: TP1: 4,320 TP2: 4,335 TP3: 4,345 (major resistance) Bearish Invalidation ❌ Clean 1H close below 4,260 Would open downside toward 4,230 – 4,200 Bullish bias invalidated Conclusion Gold remains technically bullish as long as price respects the 4,262 – 4,272 support zone. Current price action favors a pullback-to-rally setup, targeting prior highs near the resistance band. Patience is key—confirmation above intraday resistance will strengthen bullish continuation probability. 📈 Bias: Bullish above support ⚠️ Risk: Breakdown below demand zone
ZareeFxTradingAac
آمادهسازی برای فروش: چگونه از سقف مقاومت برای ترید خلاف روند سود بگیریم؟
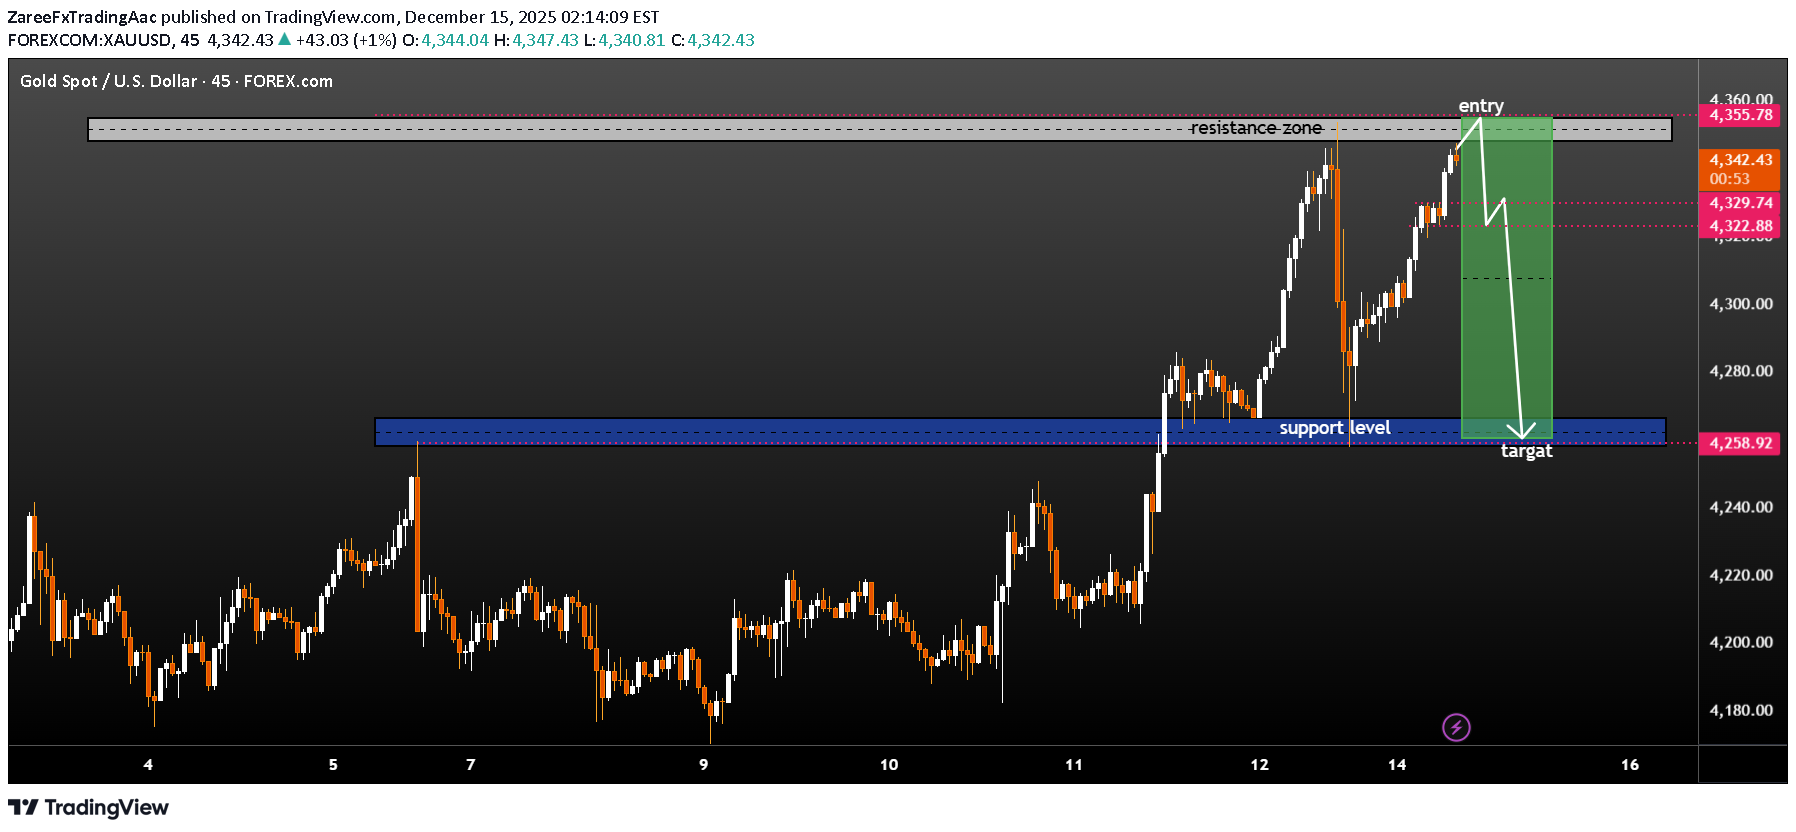
Conclusion This chart presents a classic resistance-to-support mean-reversion setup. While the broader momentum is bullish, price is at a high-probability sell zone, making shorts valid only with confirmation. Aggressive traders fade resistance; conservative traders wait for structure breakdown. Price is in a strong short-term uptrend, making higher highs and higher lows. The rally has reached a well-defined resistance zone (≈ 4,350–4,360), previously respected by price. Momentum is slowing near resistance, suggesting potential exhaustion. Key Levels Resistance zone: 4,350 – 4,360 Short entry area: Near the top of the resistance zone (as marked) Intermediate reaction level: ~4,325 – 4,330 (minor pullback / structure) Major support & target: ~4,255 – 4,260 (blue support zone) Trade Idea Shown on Chart Bias: Short (counter-trend, resistance rejection) Entry: At/near resistance after rejection Target: Prior demand/support zone around 4,258 Risk–Reward: Favorable (large downside relative to tight invalidation) Confirmation to Watch Bearish rejection candles (long upper wicks, engulfing) Failure to hold above the resistance zone Break below short-term higher-low structure Invalidation Clean break and hold above 4,360 Strong bullish continuation candles above resistance
ZareeFxTradingAac
ETHUSD (1H) – Üçgen Kırılımı ve Yükseliş Senaryosu
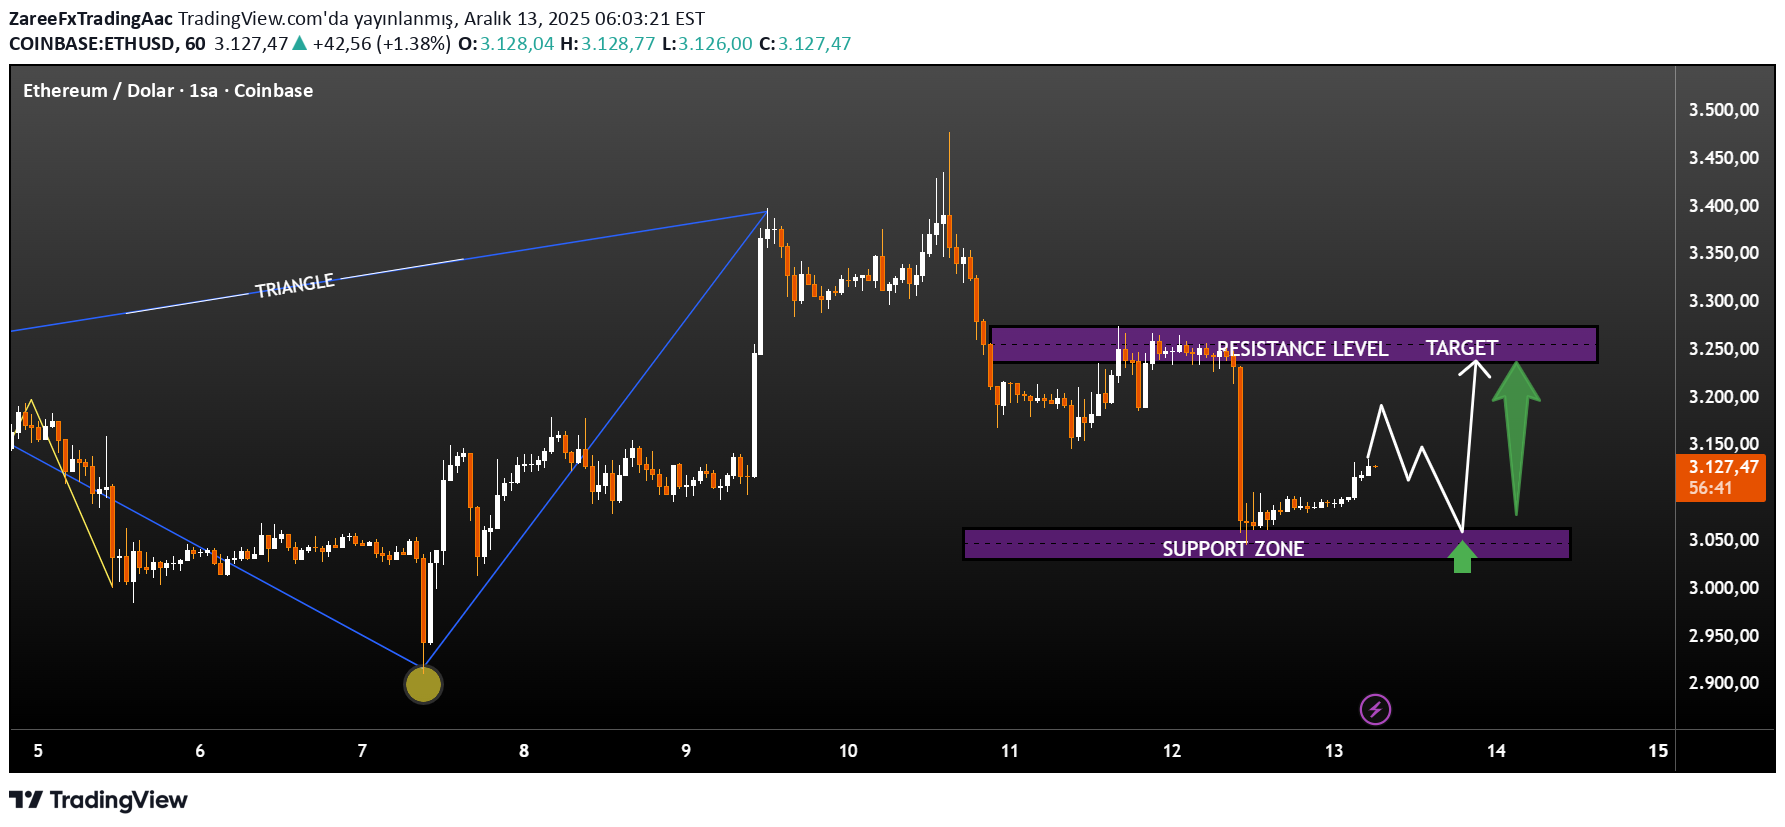
Grafik Analizi: Konsolidasyon ve kırılım: Ethereum fiyatı bir süre üçgen formasyonu içinde sıkıştı ve ardından yukarı yönlü güçlü bir kırılım gerçekleştirdi. Bu durum alıcıların piyasada baskın olduğunu gösteriyor. Kırılım sonrası düzeltme: Yükseliş impulsundan sonra fiyat teknik bir düzeltmeye girdi ve önemli bir bölgeyi yeniden test ediyor. Önemli destek bölgesi: 3.050 – 3.080 aralığı güçlü bir destek bölgesi olarak öne çıkıyor. Bu bölge alıcıların tekrar devreye girebileceği kritik alan. Direnç / hedef bölgesi: 3.240 – 3.270 aralığı, olası yükseliş hareketinde ana hedef ve direnç bölgesi olarak işaretlenmiş durumda. Olası senaryo: Fiyat destek bölgesi üzerinde tutunur ve yukarı yönlü yapı korunursa, direnç bölgesine doğru yükseliş beklenebilir. Geçersizlik durumu: Destek bölgesinin aşağı yönlü net kırılması, yükseliş senaryosunu geçersiz kılar ve daha derin bir düzeltmeye yol açabilir.
ZareeFxTradingAac
ETHUSD (1H) – Triangle Breakout, Support Retest & Upside Target
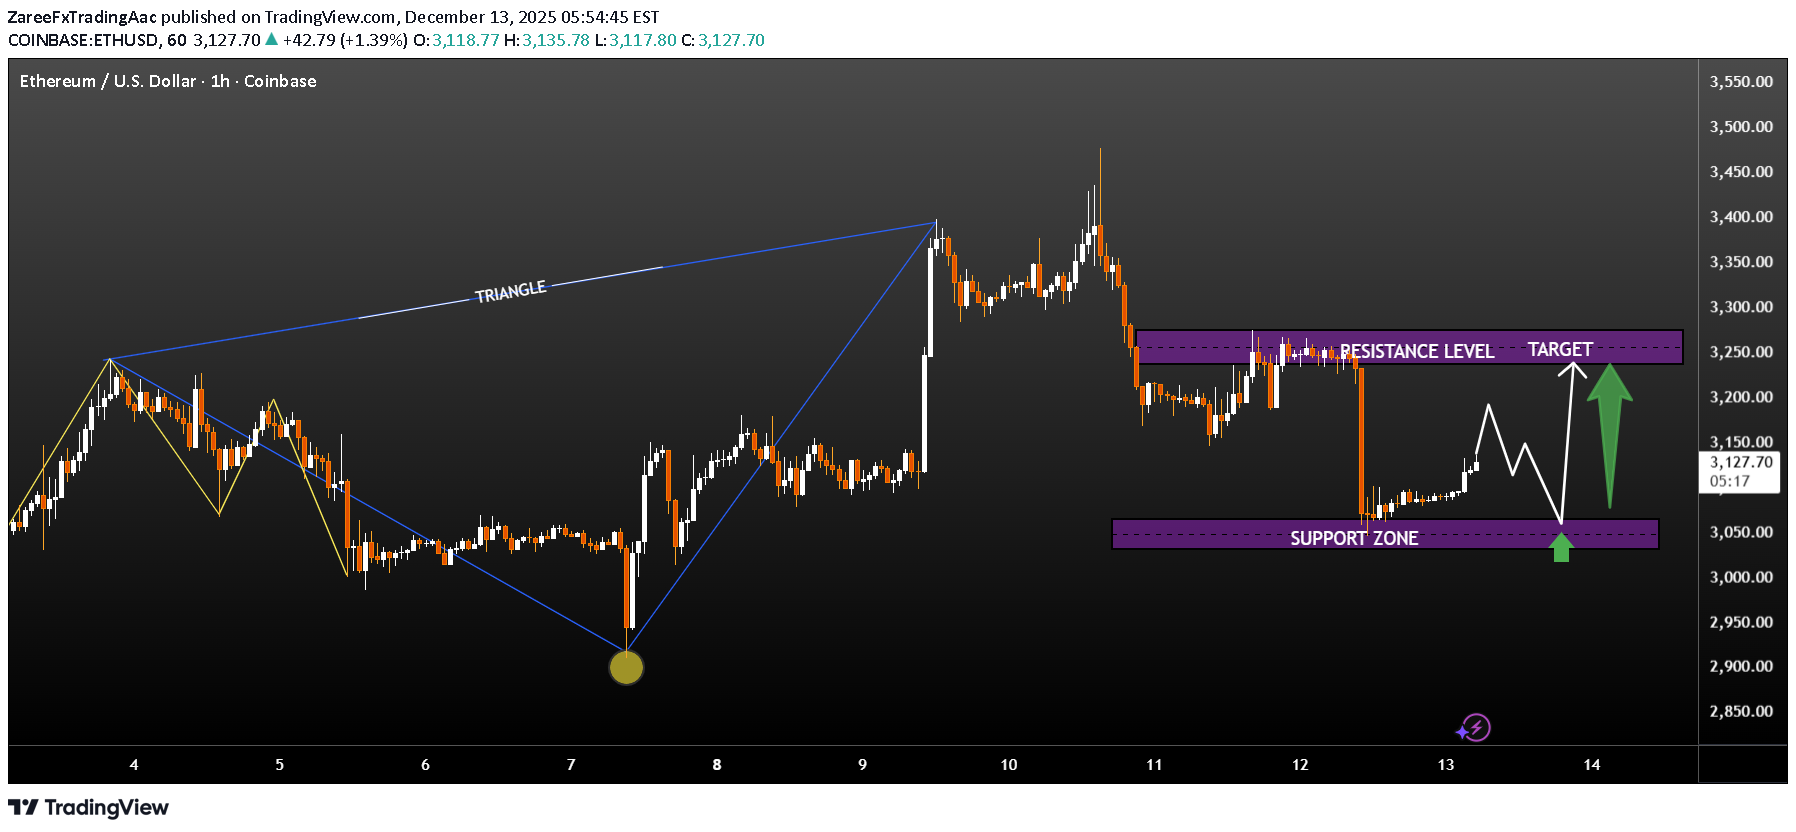
Chart Analysis: Market Structure: Ethereum previously formed a triangle pattern, indicating consolidation and pressure build-up. A strong bullish impulse confirmed the breakout, showing buyer dominance. Post-Breakout Move: After the breakout, price rallied aggressively and then entered a corrective phase, pulling back from recent highs. Key Support Zone: The current drop has brought price into a strong support zone around 3,050 – 3,080, highlighted on the chart. This zone is critical and acting as a demand area where buyers may step in. Resistance / Target Area: The resistance level around 3,240 – 3,270 is marked as the next upside target. This area previously rejected price and will be key for continuation. Expected Scenario: If ETH holds above the support zone and forms higher lows, a bullish continuation toward the resistance/target zone is likely. A clear rejection from support strengthens the probability of a move higher. Risk Note: A clean breakdown below the support zone would invalidate the bullish setup and may lead to deeper correction.
ZareeFxTradingAac
Bitcoin (BTC/USD) H1 – Yatay Akümülasyon & Boğa Devam Senaryosu
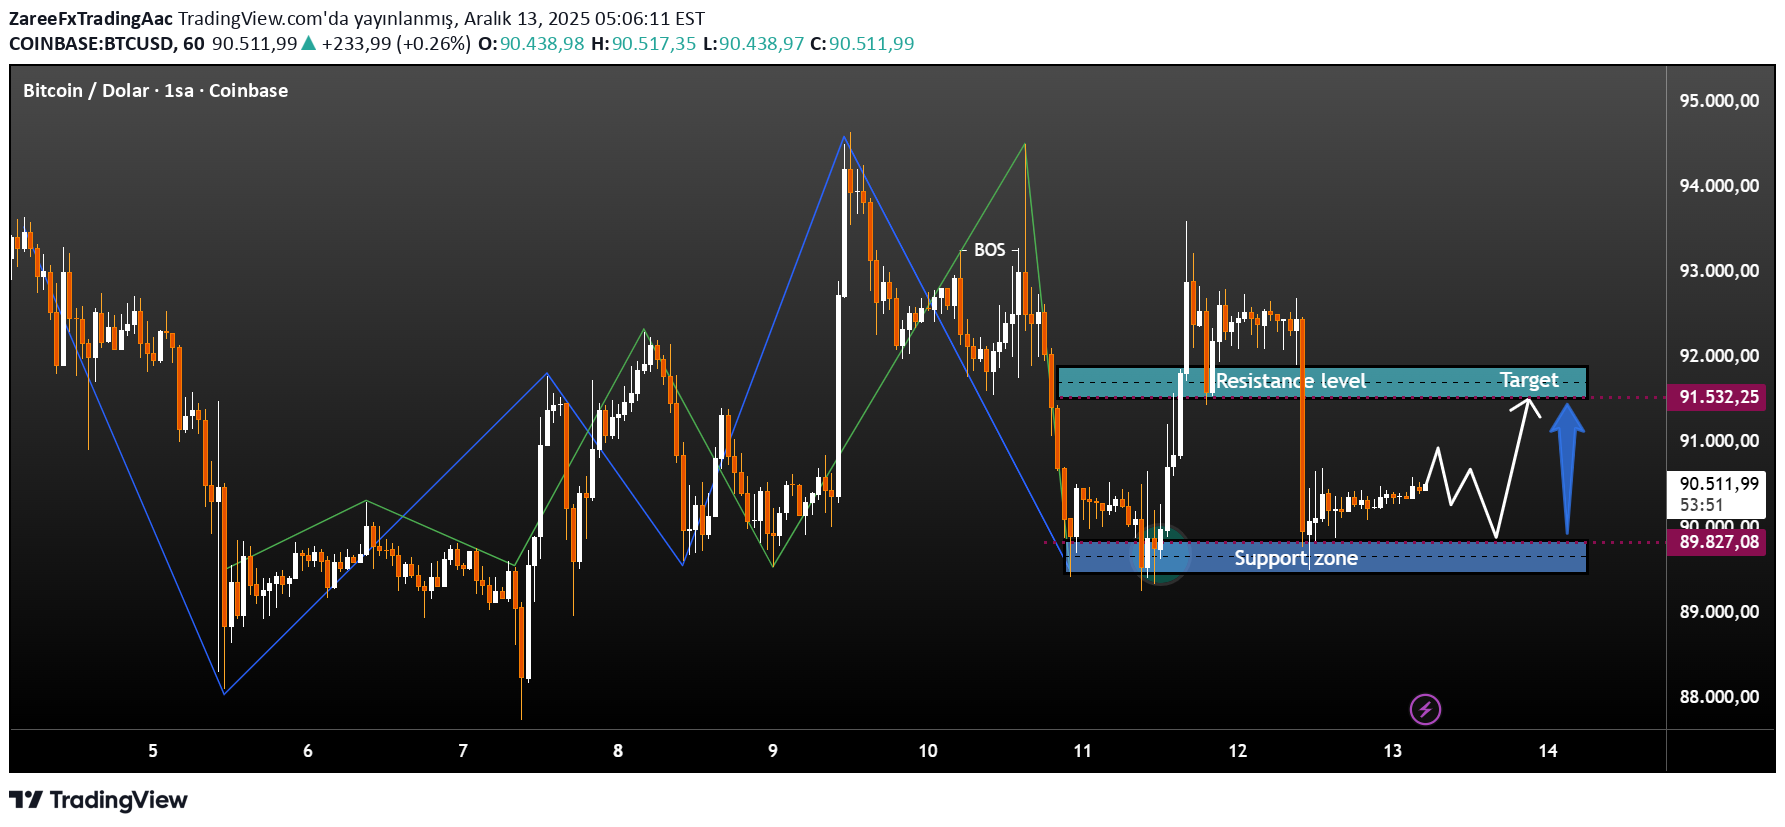
Grafik Analizi: BTC/USD 1 saatlik grafikte, güçlü bir yükseliş impulsunun ardından belirgin bir konsolidasyon (yatay hareket) görülüyor. Bu yapı, bir sonraki güçlü hareket öncesi birikim sürecine işaret ediyor. Piyasa Yapısı: Daha önce yukarı yönlü bir Break of Structure (BOS) oluştu, bu da kısa vadeli boğa yapısını doğruluyor. Sonrasında fiyat range (yatay bant) içine girdi. Destek Bölgesi (Talep Alanı): 89.800 – 90.000 aralığındaki alt mavi bölge, fiyatın defalarca tepki verdiği güçlü bir destek alanı olarak çalışıyor. Direnç Bölgesi (Arz Alanı): 91.500 – 91.800 seviyelerindeki üst mavi bölge kritik direnç konumunda ve şu an fiyatı sınırlıyor. Mevcut Durum: Fiyat destek üzerinde kalıyor ve daha yüksek dipler oluşturarak alıcıların akümülasyon yaptığını gösteriyor. Beklenen Senaryo: Direncin üzerinde net bir kırılım ve kapanış, fiyatı daha yüksek hedeflere doğru boğa devamına taşıyabilir. Dirençten ret gelirse, destek bölgesinin yeniden test edilmesi olasıdır.
ZareeFxTradingAac
Bitcoin (BTC/USD) H1 – Range Accumulation & Bullish Continuation
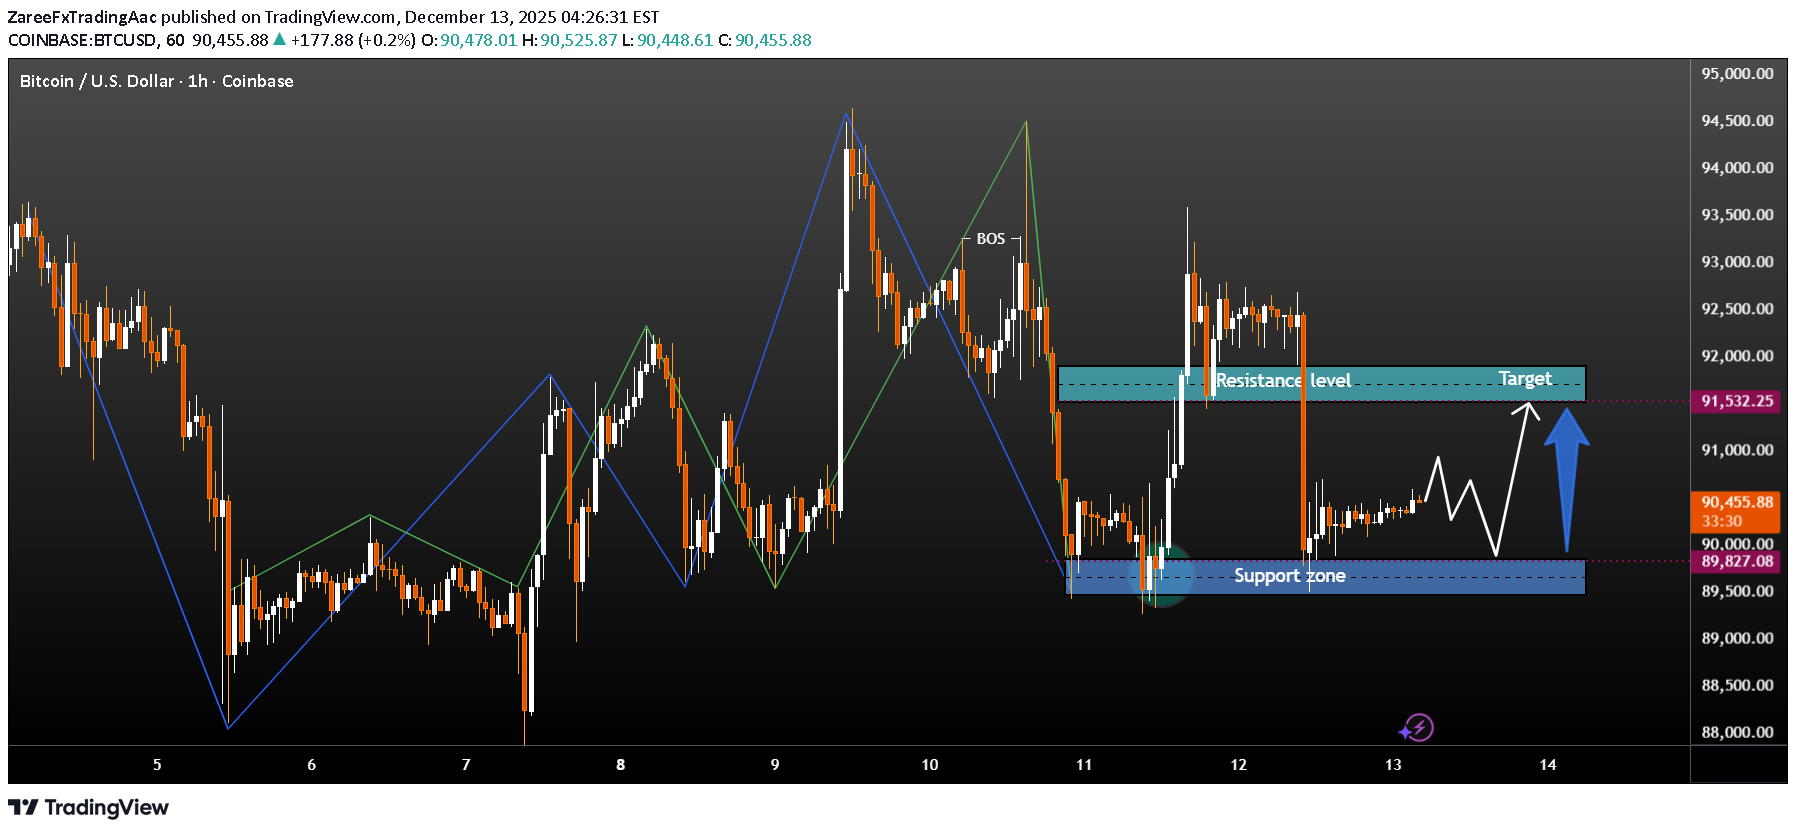
Chart Analysis: The BTC/USD 1-hour chart shows a clear consolidation phase after a strong impulsive move, indicating market indecision before the next expansion. Market Structure: Price previously formed a Break of Structure (BOS) to the upside, confirming short-term bullish intent. After that impulse, Bitcoin entered a range-bound structure, respecting both support and resistance zones. Support Zone (Demand Area): The lower blue zone around 89,800 – 90,000 has acted as a strong demand area, where price reacted multiple times and buyers stepped in aggressively. Resistance Level (Supply Area): The upper blue zone near 91,500 – 91,800 is a key resistance, currently capping price. Previous rejections suggest sellers are active here. Current Scenario: Price is consolidating above support, forming higher lows, which signals accumulation. This behavior often precedes a breakout. Expected Move: A successful breakout and close above resistance can trigger a bullish continuation toward higher levels, as indicated by the projected arrow. If resistance holds, price may retest the support zone before the next attempt.
ZareeFxTradingAac
تحلیل تکنیکال طلا (XAUUSD) یک ساعته: نقشهراه صعود یا ریزش در آستانه شکست مهم!
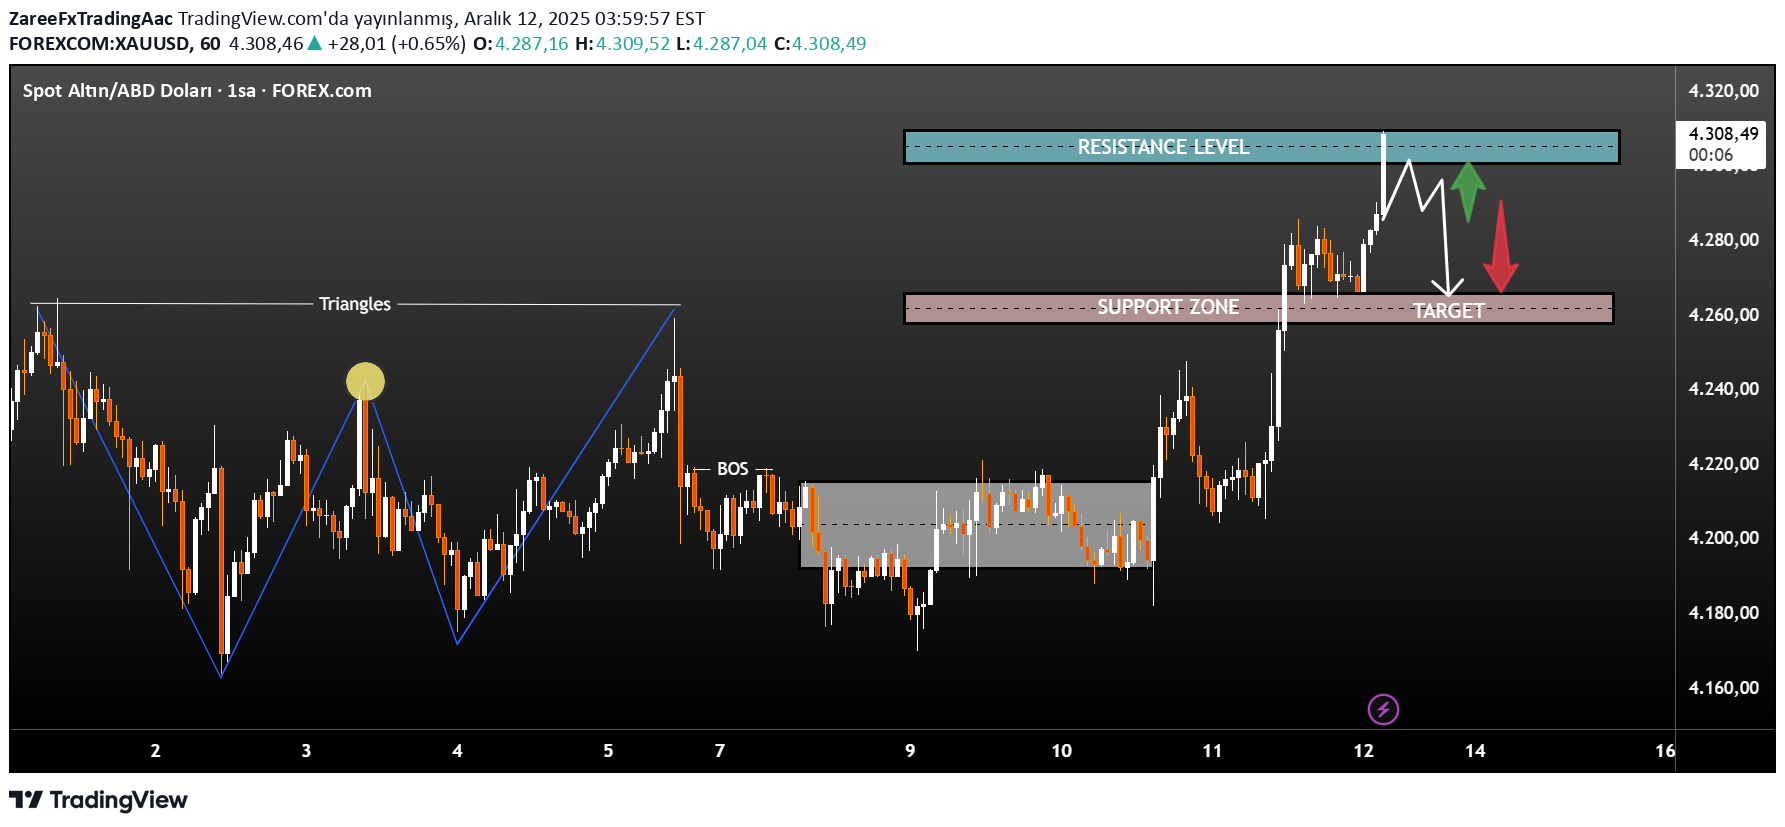
1. Üçgen Formasyonu (Sol Bölüm) Sol tarafta işaretlenen simetrik üçgen, piyasada bir sıkışma dönemi olduğunu gösteriyor. Ardından gelen güçlü yükseliş, üçgenin yukarı yönde kırıldığını ve trendin genişlediğini doğruluyor. 2. Break of Structure (BOS) – Yapı Kırılımı BOS bölgesi şunu gösteriyor: Önceki bir dip seviyesi kırılmış Kısa süreli düşüş yapısına geçiş oluşmuş Ancak fiyat sonra yeniden güçlü şekilde yükselmiş → Bu durum bir likidite toplama hareketi olduğunu gösteriyor, gerçek trend dönüşü değil. 3. Birikim Bölgesi (Gri Kutu) Bu yatay konsolidasyon bölgesi: Likidite birikimi Piyasada bekleme süreci Ardından gelen temiz bir yükseliş kırılımı Bu çıkış, sonraki güçlü yükseliş hareketini destekliyor. 4. Destek Bölgesi (Pembe Alan) Yaklaşık 4260–4270 seviyesi: Daha önce dirençti Şimdi destek olarak çalışıyor Ayrıca senin grafikte “TARGET” yani geri çekilme hedefi Bu bölge, trendin devam edip etmeyeceğini belirleyen kilit nokta. 5. Direnç Bölgesi (Mavi Alan) Yaklaşık 4300+ seviyesi: Güçlü arz bölgesi Fiyatın tepki vermesi muhtemel Çift tepe veya likidite avı ihtimali yüksek Bu nedenle çizdiğin iki senaryo oldukça mantıklı: ✔️ Direnç kırılır → yükseliş devam eder ❌ Dirençten red gelir → fiyat destek bölgesine döner 6. Olası Senaryolar 🟩 Senaryo A – Yükseliş (Devam Senaryosu) Fiyat direnci test eder Küçük bir düzeltme yapar Mavi bölgeyi kırar Trend yukarı yönlü devam eder 🟥 Senaryo B – Düşüş (Red Senaryosu) Fiyat dirençten ret yer Daha düşük bir tepe oluşturur Destek bölgesine düşer (TARGET) Destek kırılırsa koreksiyon derinleşebilir ✔️ Grafiğin için Önerilen Başlık “XAUUSD 1H – Üçgen Kırılımı, BOS Onayı ve Ana Destek/Direnç Bölgeleri”
Disclaimer
Any content and materials included in Sahmeto's website and official communication channels are a compilation of personal opinions and analyses and are not binding. They do not constitute any recommendation for buying, selling, entering or exiting the stock market and cryptocurrency market. Also, all news and analyses included in the website and channels are merely republished information from official and unofficial domestic and foreign sources, and it is obvious that users of the said content are responsible for following up and ensuring the authenticity and accuracy of the materials. Therefore, while disclaiming responsibility, it is declared that the responsibility for any decision-making, action, and potential profit and loss in the capital market and cryptocurrency market lies with the trader.