Technical analysis by ZareeFxTradingAac about Symbol PAXG: Buy recommendation (12/16/2025)

ZareeFxTradingAac
XAUUSD (Gold) 1H Chart Analysis – Support Hold & Potential Bulli
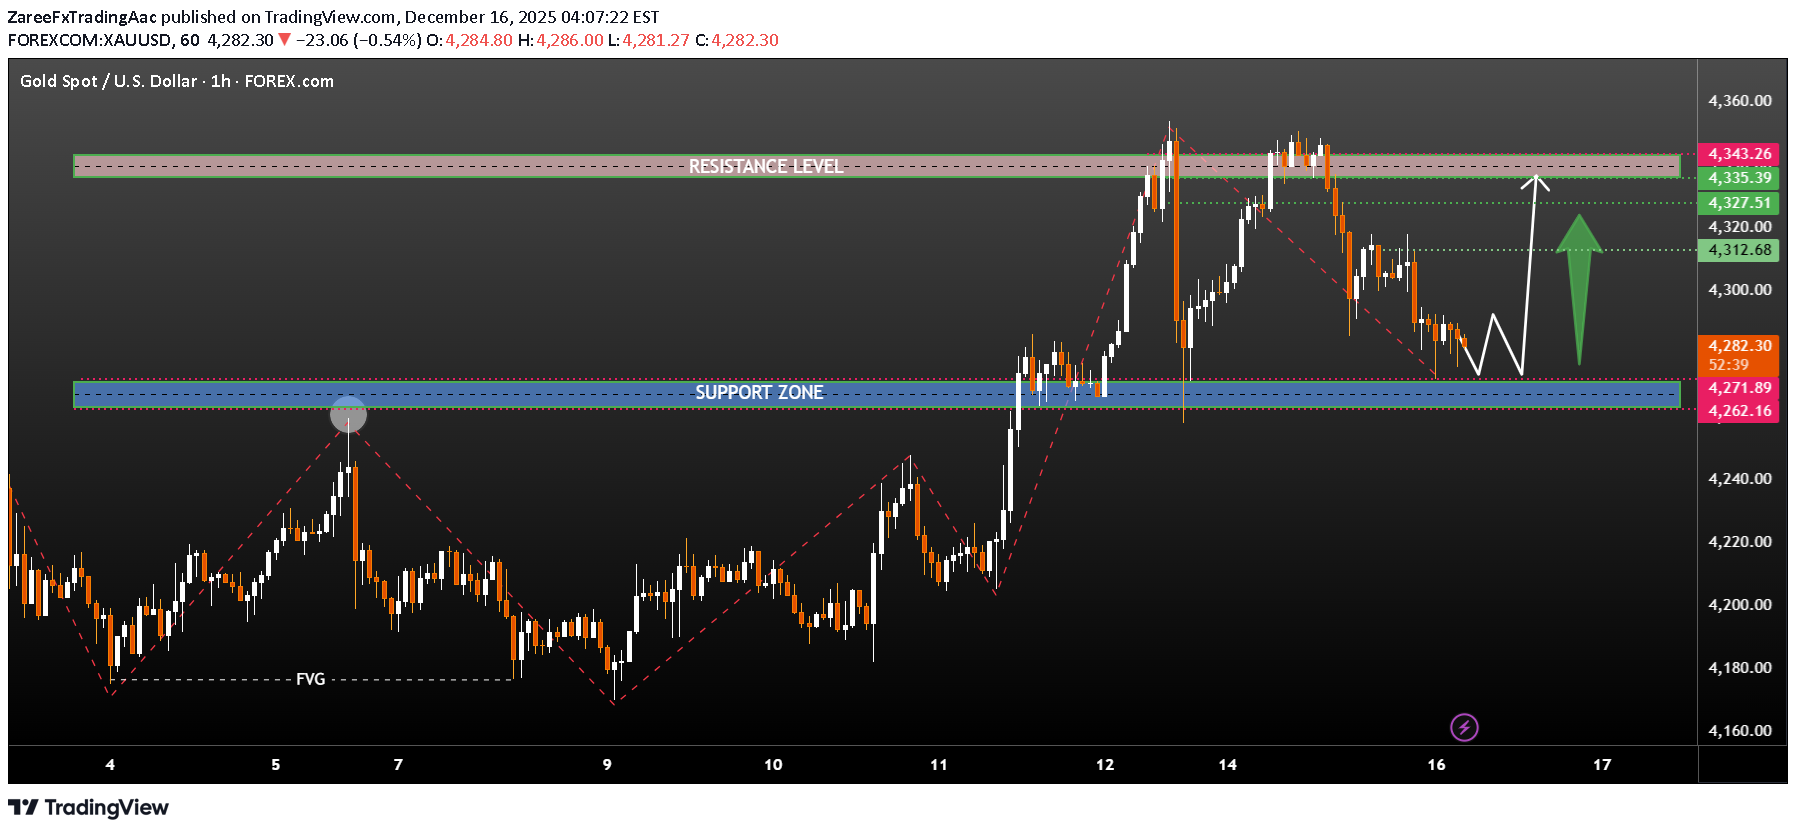
Market Structure Overview Gold previously rallied strongly and rejected from a major resistance zone around 4,335 – 4,345, forming a clear distribution top. Price then entered a corrective bearish move, respecting a descending structure (lower highs). The decline has now brought price back into a well-defined demand / support zone. Key Levels 🔴 Major Resistance Zone: 4,335 – 4,345 Strong rejection previously Liquidity resting above this area 🟦 Key Support Zone: 4,262 – 4,272 Multiple reactions Structure base & demand Prior breakout zone → support flip 🟢 Intermediate Levels: 4,312 – 4,320 → intraday reaction area 4,327 – 4,335 → pre-resistance zone Price Action Insight Price is currently holding above the support zone, suggesting seller exhaustion. The corrective move appears structured, not impulsive → favors continuation higher. The projected path shows: Bounce from support Minor pullback (higher low) Continuation toward resistance Bullish Scenario (Preferred) ✔ Support zone holds ✔ Higher low forms on 1H ✔ Break above 4,312 – 4,320 🎯 Targets: TP1: 4,320 TP2: 4,335 TP3: 4,345 (major resistance) Bearish Invalidation ❌ Clean 1H close below 4,260 Would open downside toward 4,230 – 4,200 Bullish bias invalidated Conclusion Gold remains technically bullish as long as price respects the 4,262 – 4,272 support zone. Current price action favors a pullback-to-rally setup, targeting prior highs near the resistance band. Patience is key—confirmation above intraday resistance will strengthen bullish continuation probability. 📈 Bias: Bullish above support ⚠️ Risk: Breakdown below demand zone