Technical analysis by ZareeFxTradingAac about Symbol BTC: Buy recommendation (12/13/2025)

ZareeFxTradingAac
Bitcoin (BTC/USD) H1 – Range Accumulation & Bullish Continuation
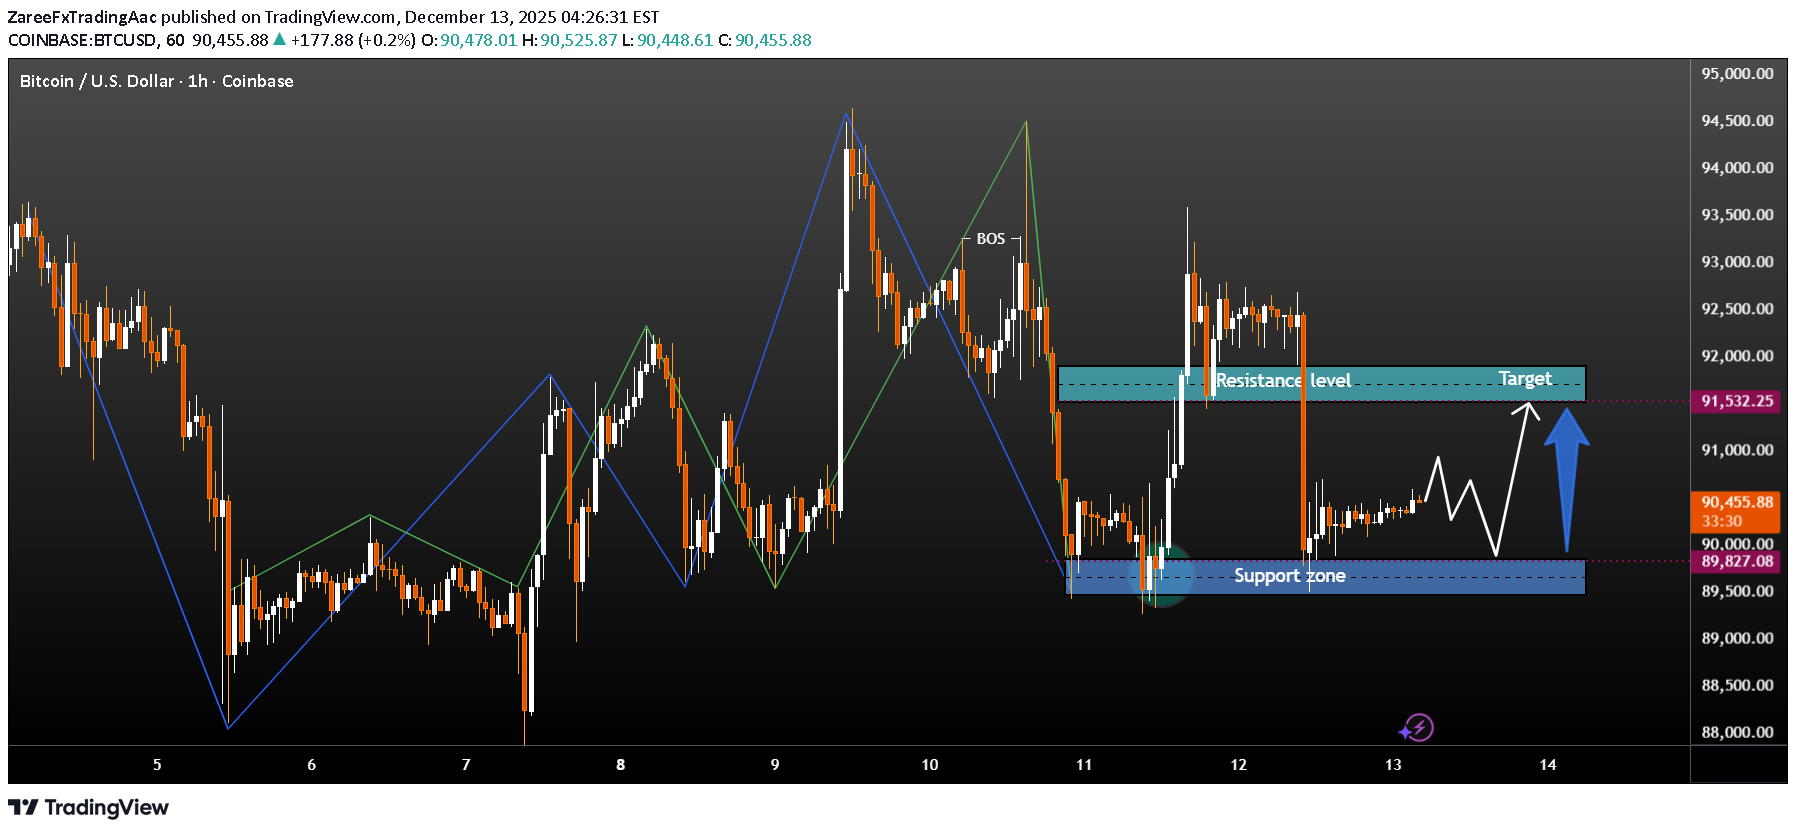
Chart Analysis: The BTC/USD 1-hour chart shows a clear consolidation phase after a strong impulsive move, indicating market indecision before the next expansion. Market Structure: Price previously formed a Break of Structure (BOS) to the upside, confirming short-term bullish intent. After that impulse, Bitcoin entered a range-bound structure, respecting both support and resistance zones. Support Zone (Demand Area): The lower blue zone around 89,800 – 90,000 has acted as a strong demand area, where price reacted multiple times and buyers stepped in aggressively. Resistance Level (Supply Area): The upper blue zone near 91,500 – 91,800 is a key resistance, currently capping price. Previous rejections suggest sellers are active here. Current Scenario: Price is consolidating above support, forming higher lows, which signals accumulation. This behavior often precedes a breakout. Expected Move: A successful breakout and close above resistance can trigger a bullish continuation toward higher levels, as indicated by the projected arrow. If resistance holds, price may retest the support zone before the next attempt.