
Wave-Trader
@t_Wave-Trader
What symbols does the trader recommend buying?
Purchase History
پیام های تریدر
Filter
Analysis of BTC/USDT 2D Chart (July 7, 2025)
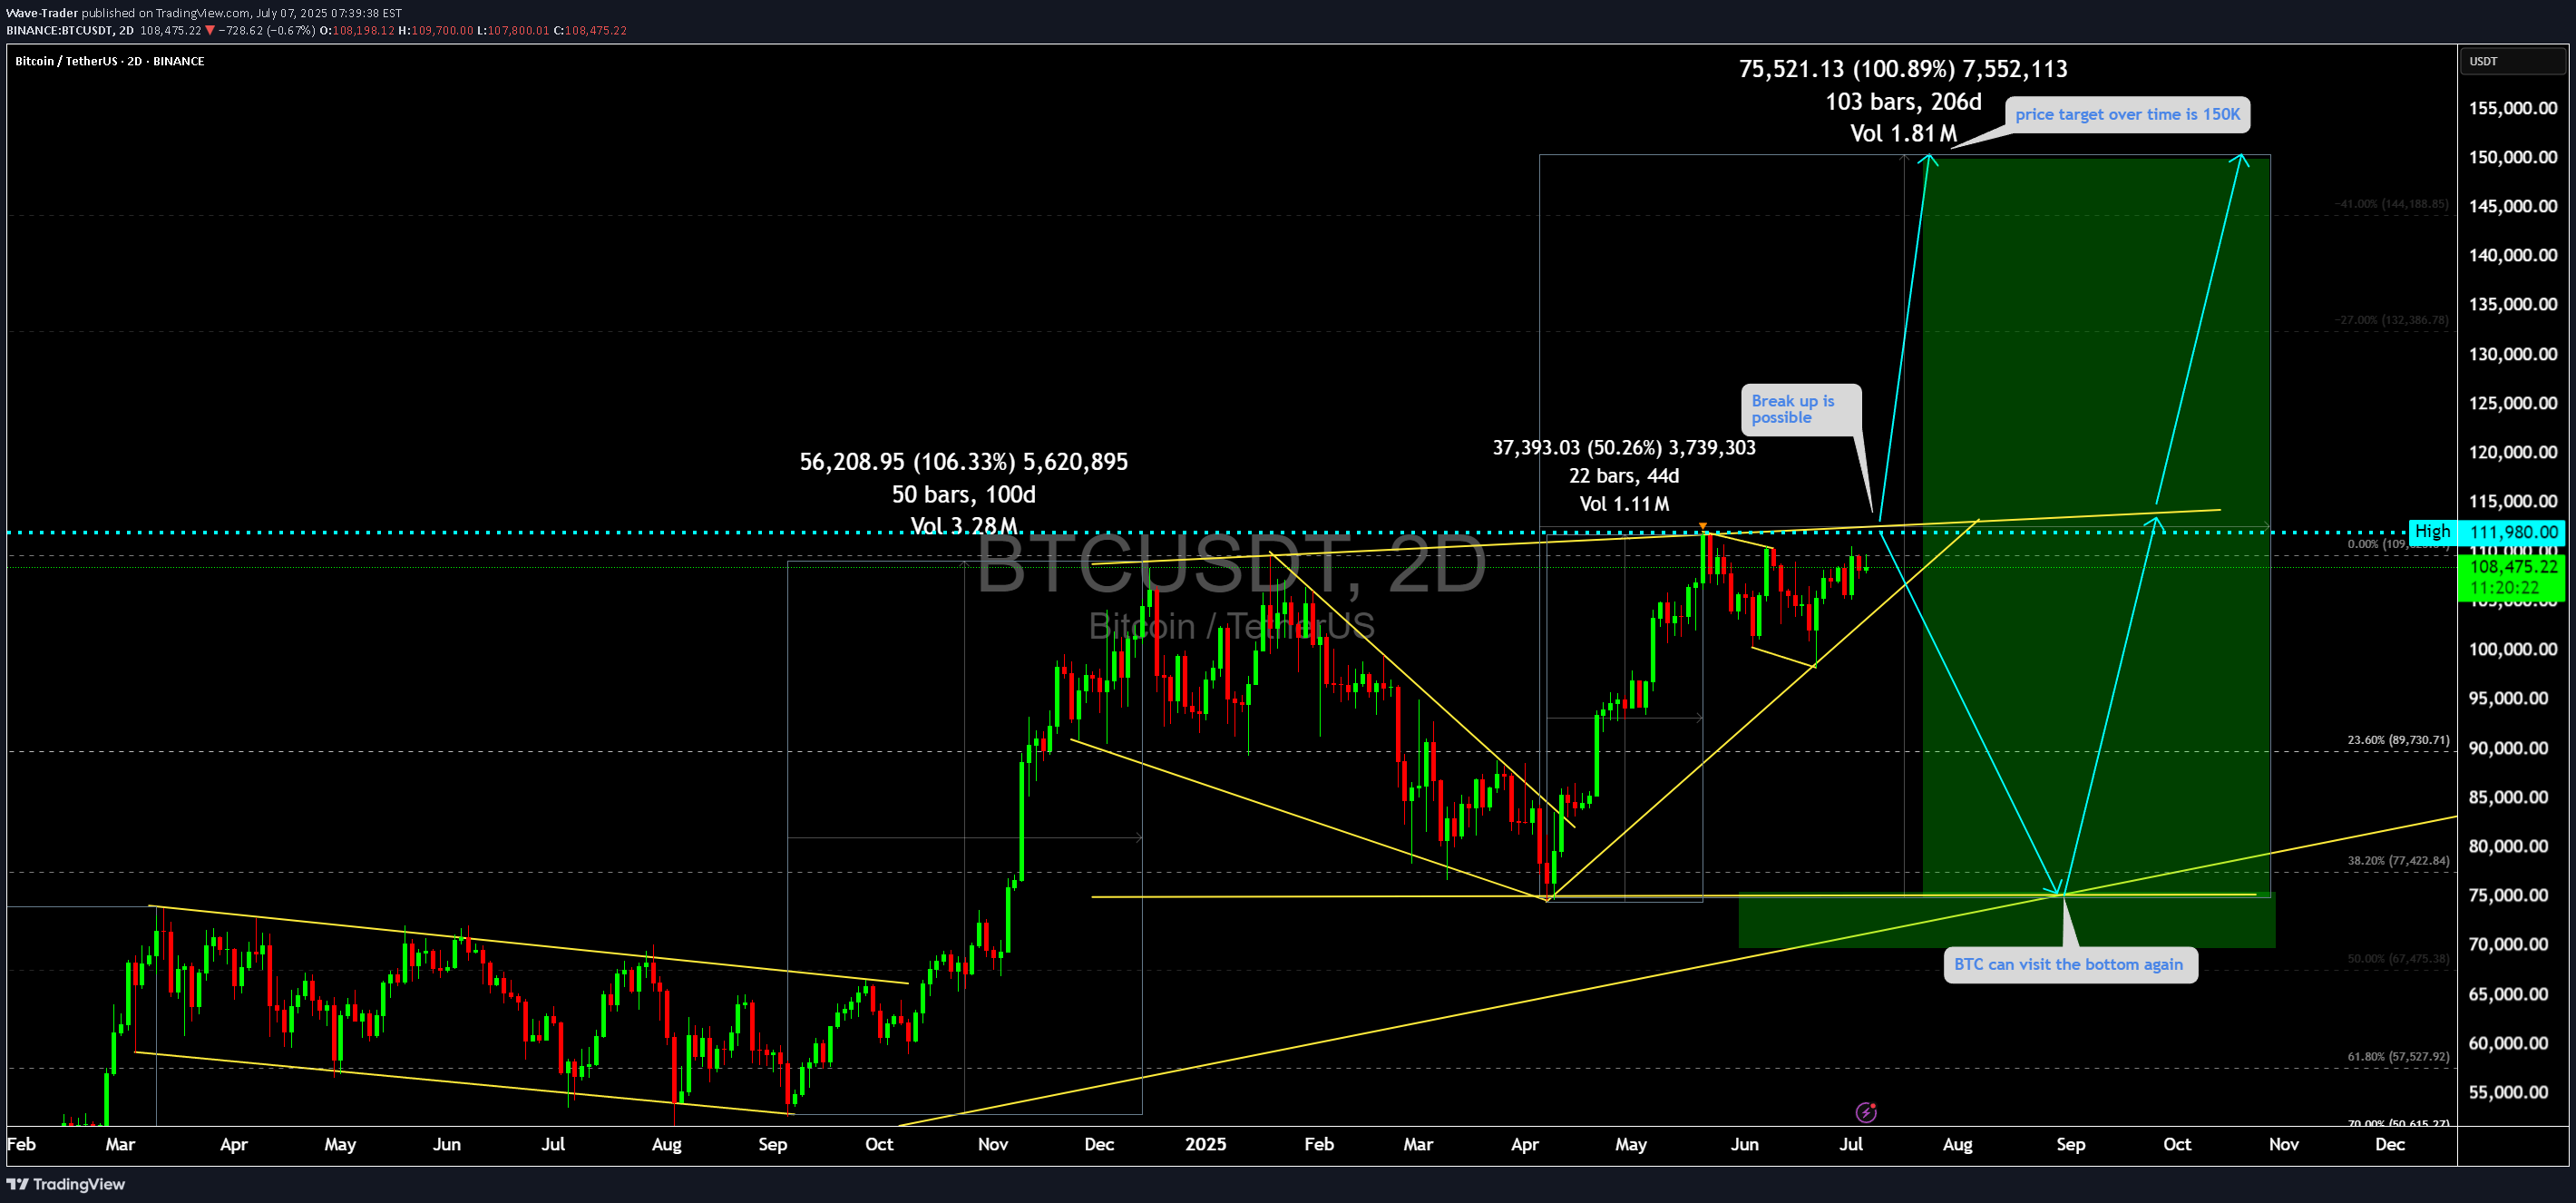
This updated chart for BTC/USDT continues to support a macro bullish structure, offering two main paths from the $109K zone. Below is a consolidated technical and strategic breakdown of the chart you just uploaded, with refined annotations and updated trade logic:📊 Chart Summary – Two Key Scenarios🔹 Current Price: ~$108,450🔹 Resistance: $111,980🔹 Support Zone: $75,000–$77,500🟢 Scenario A: Bullish Breakout to $150,000Structure:BTC is currently consolidating just below $111,980 resistance.Forming a bullish continuation triangle (compressed range into resistance).Breakout Potential: Symmetry projection shows a ~100% rally in ~103–108 days—similar to prior cycles.Target Zones:Target 1: $132,000 (previous 100% measured move)Target 2: $150,000 (1.618 Fib extension)Volume Behaviour:Increasing volume near breakoutVolatility compression before expansion (classic of breakout setups)📈 Signal to Enter: Break and daily close above $112K confirms breakout — initiating aggressive long setups targeting $132K–$150K.🔻 Scenario B: Bearish Pullback to $75K–$77K Before Next Leg UpStructure:Price could reject the $111K zone and revisit previous demand base around $75K.This would mirror the past March–May correction (50% drop → recovery).Converges with:38.2% retracement = $77,42250% retracement = $67,475Bullish long-term trendline supportImplication:This would be a healthy correction rather than trend reversalReaccumulating opportunity for long-term traders📉 Signal to Enter: Pullback and bullish structure confirmation around $75K–$77K. Look for volume spike, price rejection wicks, or bullish engulfing candles.📐 Technical Levels RecapTypeLevelSignificanceResistance$111,980Major breakout triggerSupport 1$89,730Shallow retracement zone (23.6%)Support 2$77,422Strong historical bounce zone (38.2%)Support 3$67,475Deep reaccumulating zone (50%)Target 1$132,000100% symmetrical moveTarget 2$150,000+1.618 Fib extension – full euphoric top🧠 Strategy Notes📍 Already Long from ~$82K?Use trailing stop around $98K–$101KLet the position run into strength but be protected against the pullback scenario📍 Looking to Enter Fresh?Wait for clean breakout above $112K — confirms continuationOR, enter near $75K–$77K on corrective retest with bullish confirmation signals🔄 Chart Pattern Comparison:PeriodRally SizeDurationResultSep–Dec 2024+106%~100 daysHit $109KJul–Nov 2025*+100% est.~103 daysProjected $150K✅ Final Thought:This reanalysis confirms that BTC remains in a macro bullish structure, either rallying to $150K directly or after a controlled retest of $75K. Both offer trade setups, and risk can be tightly managed by using key fib levels and support zones.
Meta (META) Stock: Bullish Reversal and Growth Potential
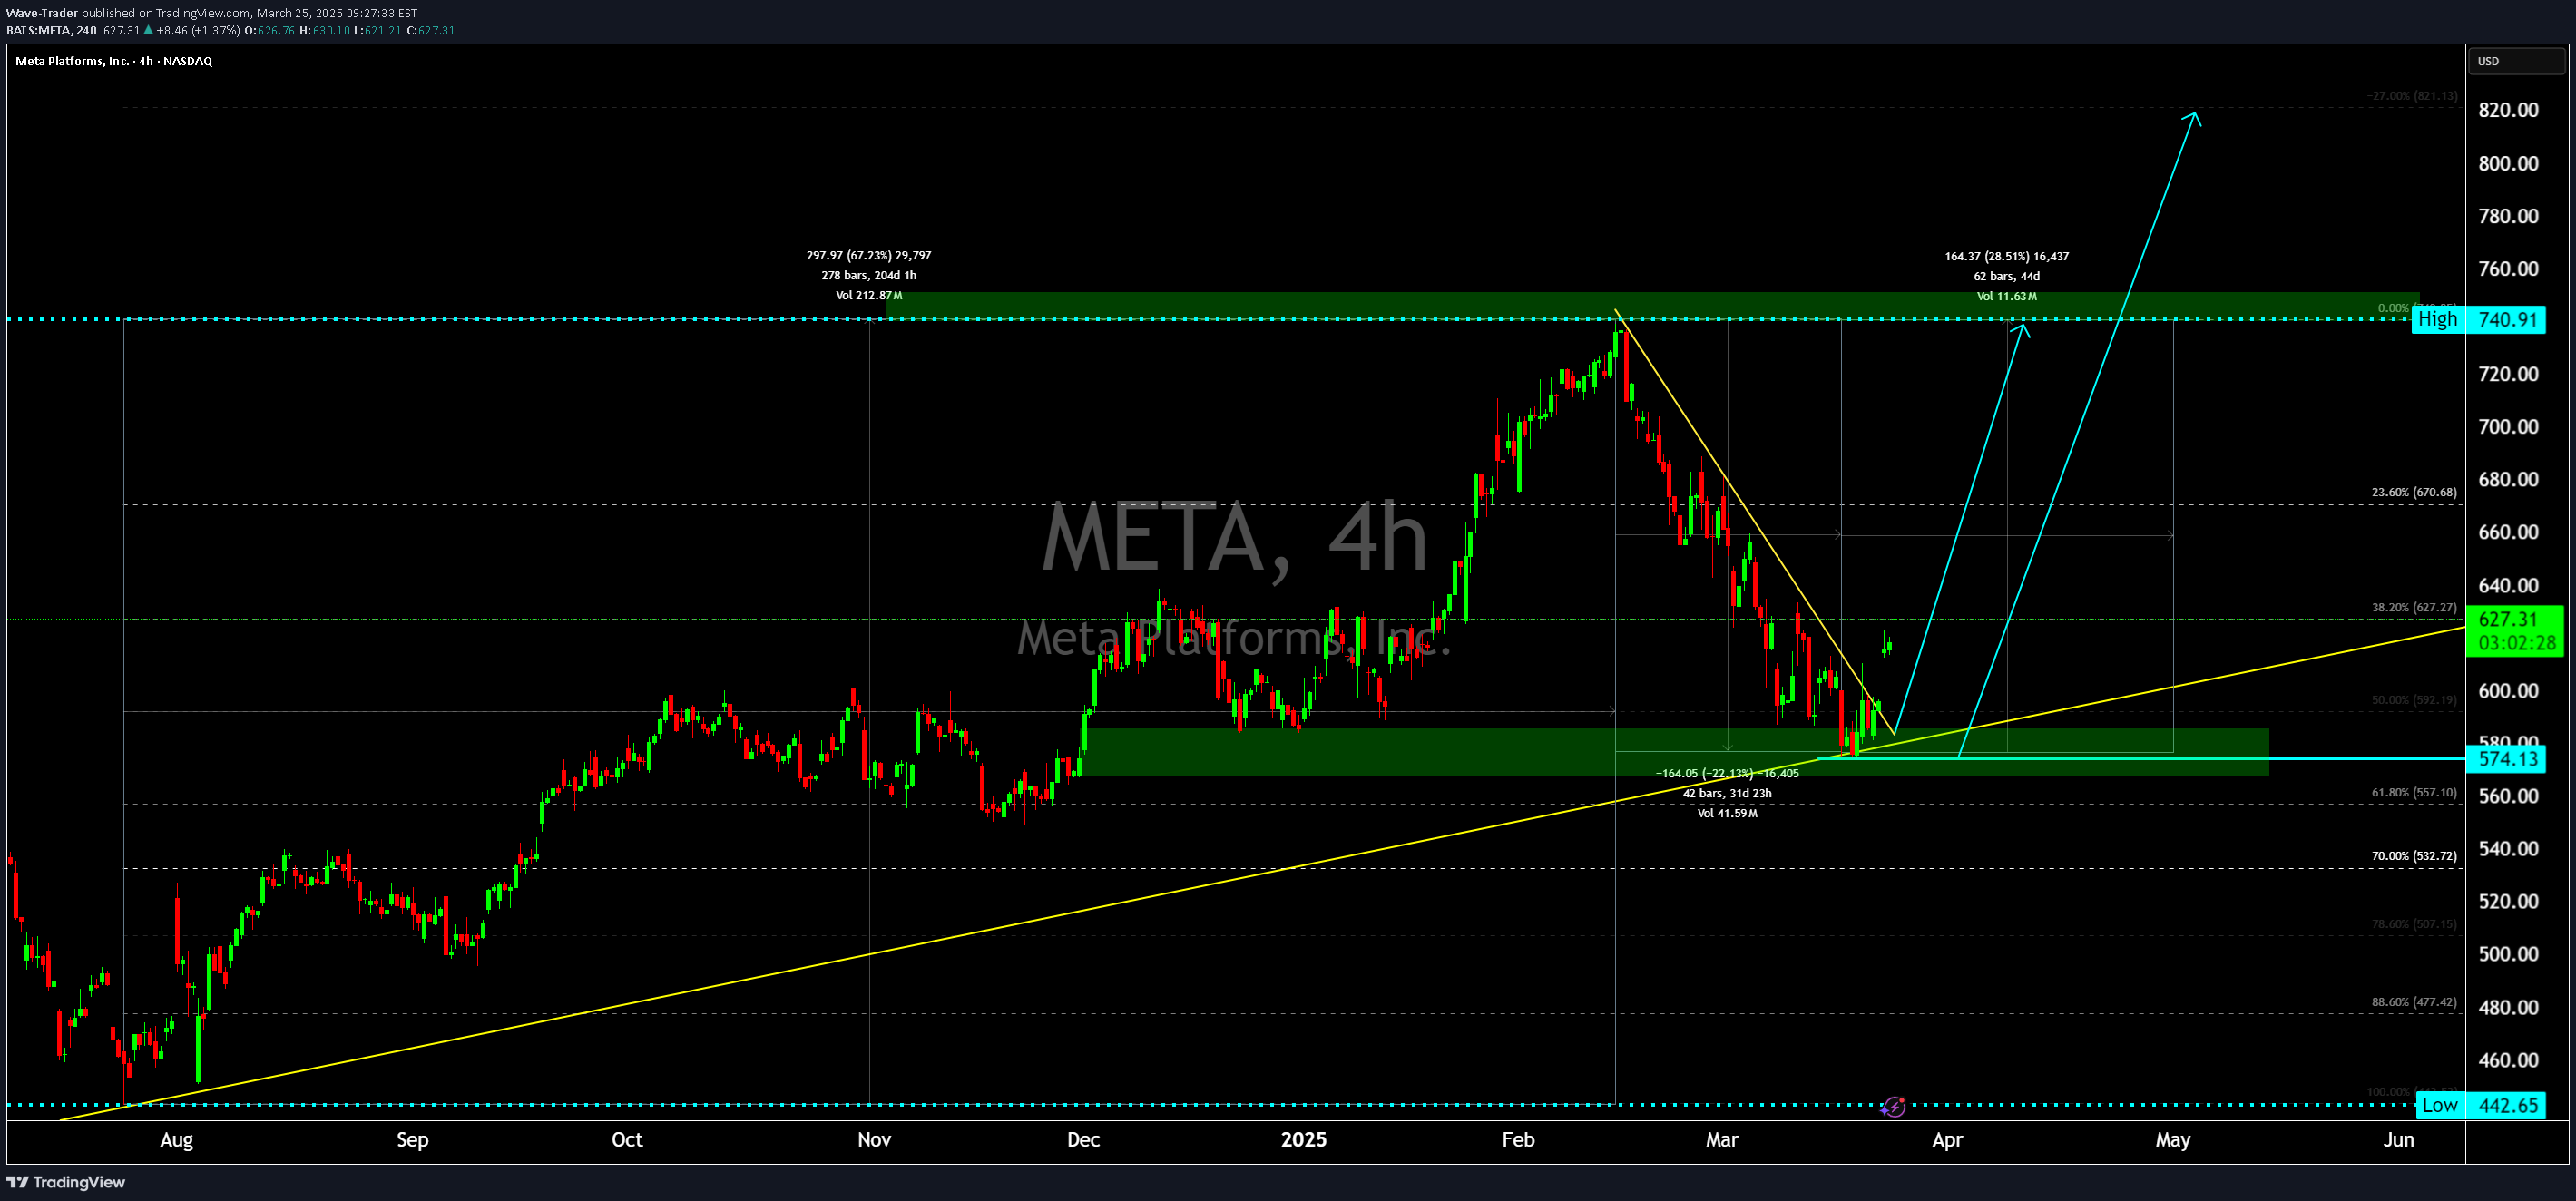
Technical Analysis Breakdown Key Technical Indicators Support Level Bounce: The stock has found strong support around the $574-$600 zone Yellow ascending trend line providing long-term support Multiple bounce points confirming this critical support area Bullish Reversal Pattern: Forming a potential inverse head and shoulders pattern Neckline resistance around $740-$750 Projected target after breakout could reach around $820-$840 Momentum Indicators: Price moving above key moving averages Consolidation phase completed after significant correction Increasing bullish momentum evident in recent candle formations Fundamental Catalysts Supporting Bullish Thesis 1. AI Investment and Infrastructure Massive investments in AI infrastructure Development of advanced AI models and technologies Metaverse and AI integration creating new revenue streams Potential for significant long-term growth in AI-driven products 2. Cost Optimization Strategies Continued focus on operational efficiency Significant workforce optimization in 2023-2024 Improved cost structure supporting margin expansion Enhanced profitability through strategic restructuring 3. Digital Advertising Recovery Advertising market showing signs of stabilization Meta's core advertising platform remains dominant Improved targeting capabilities with AI integration Expected recovery in digital ad spending 4. Monetization of New Platforms Instagram Reels gaining significant traction WhatsApp Business expanding monetization options Potential new revenue streams from AI-powered services Diversification beyond traditional social media advertising Price Target and Investment Outlook Near-term target: $740-$820 Long-term potential: $900-$1000 range Strong technical and fundamental support for bullish scenario Risk Factors to Monitor: Regulatory challenges Global economic conditions Competitive landscape in AI and social media
NVIDIA (NVDA) Buy Setup Analysis
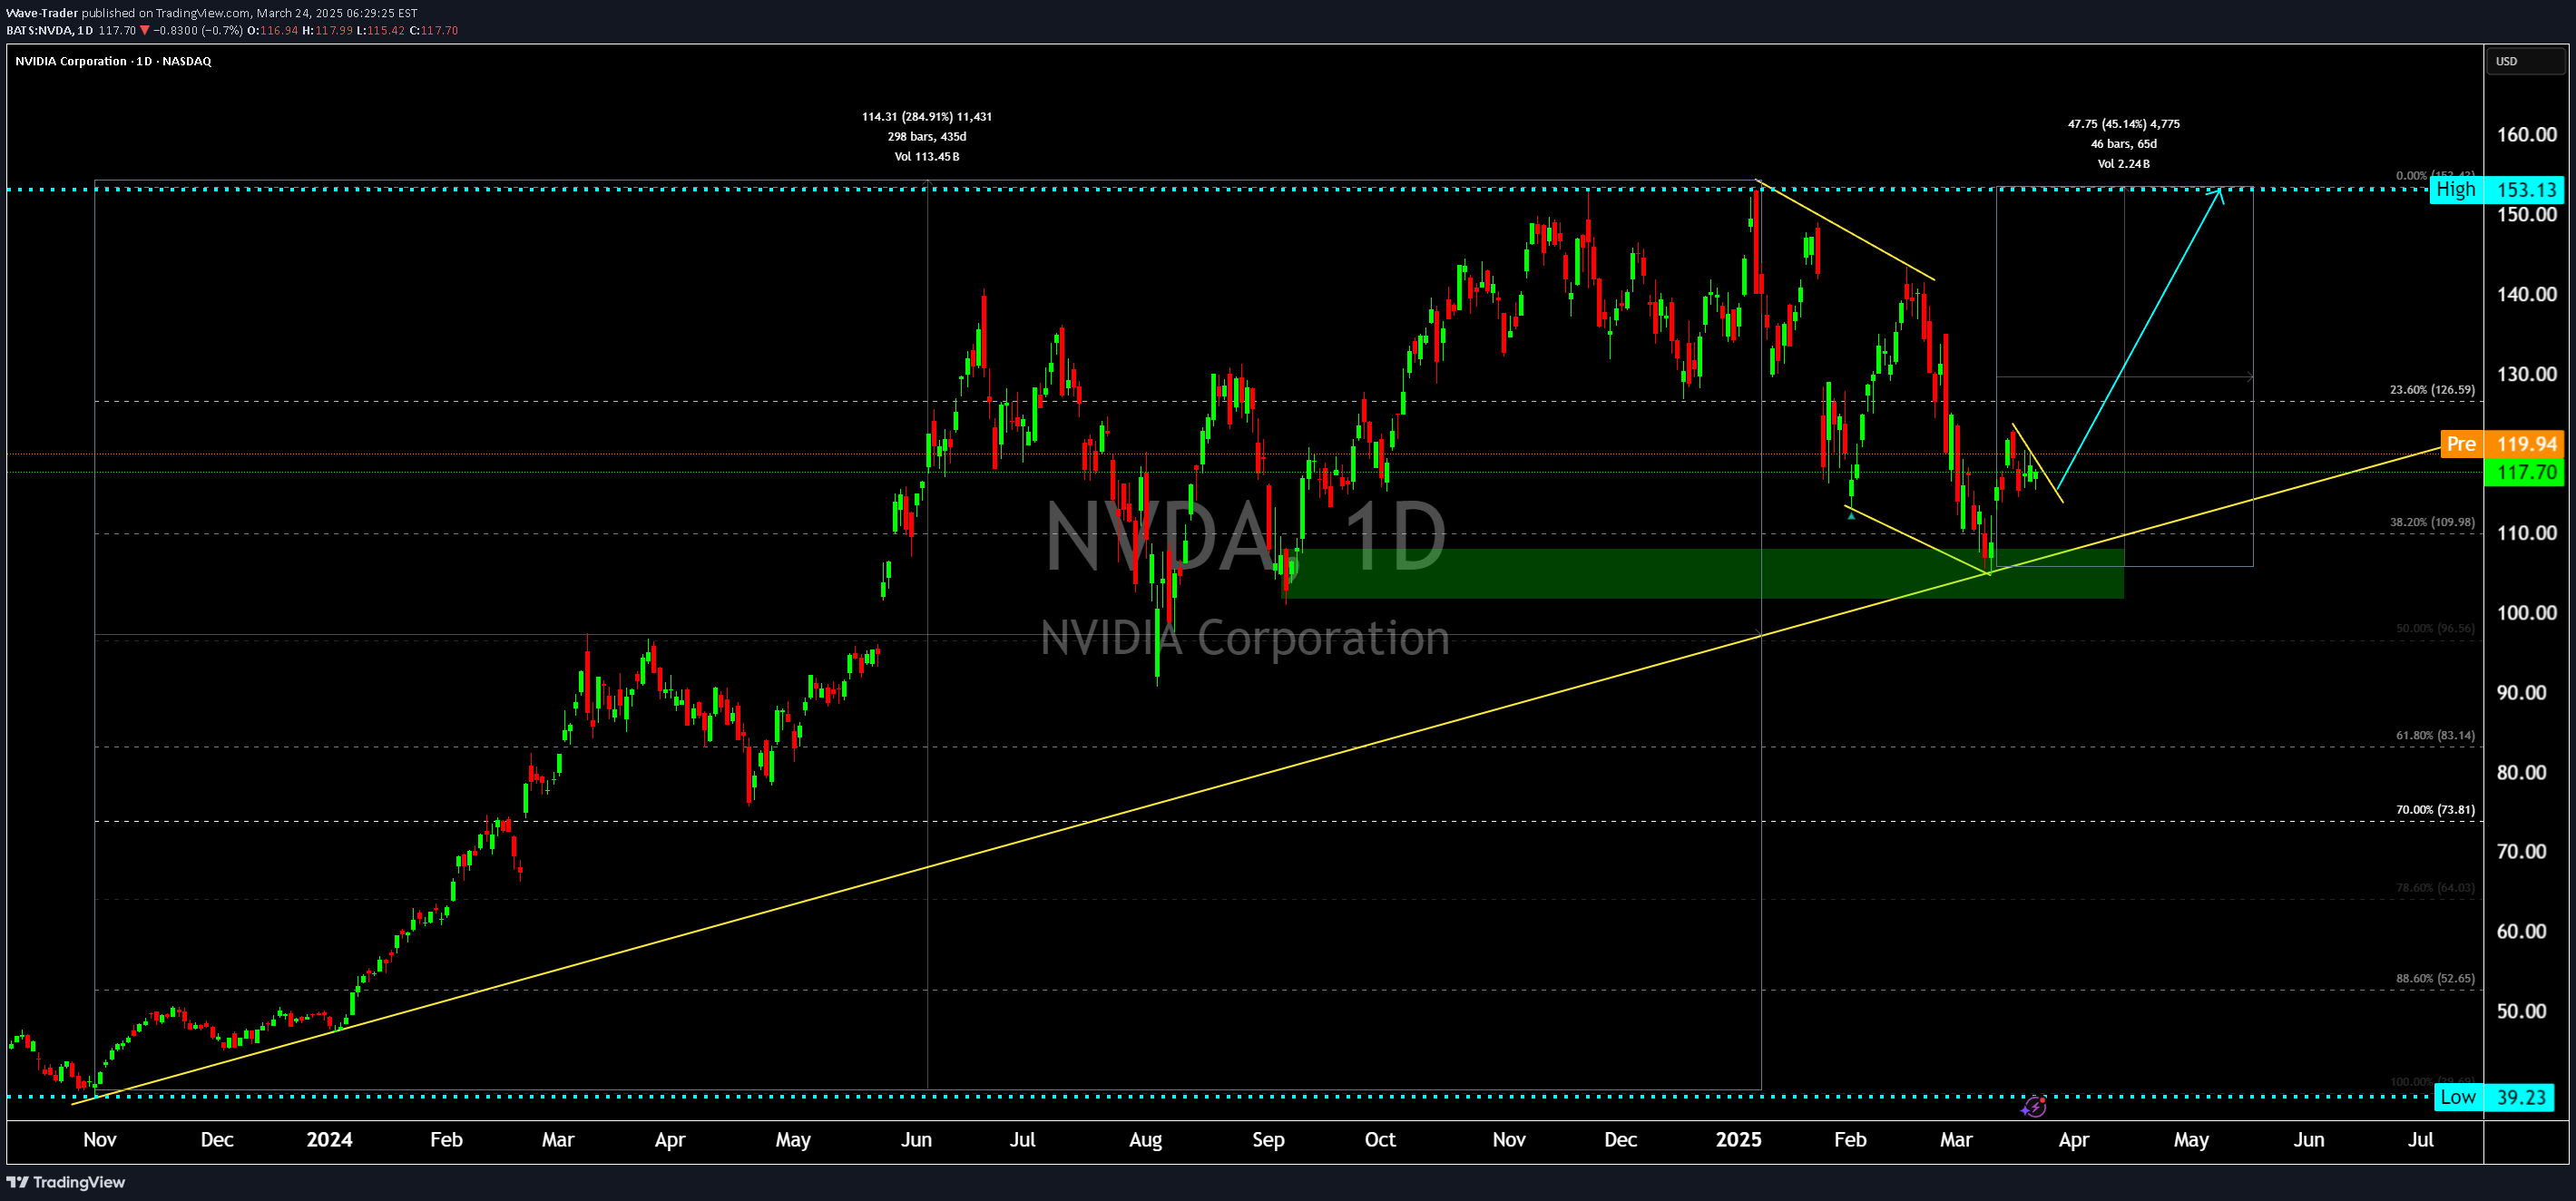
This chart presents a bullish setup for NVIDIA Corporation (NVDA) on the 1D (daily) timeframe. The setup is based on multiple technical analysis tools, which indicate a potential upward movement. Let's break it down: 1. Trendlines & Support Zone Ascending Trendline (Yellow): A long-term uptrend support line connects previous price lows, indicating an overall bullish trend. Green Support Zone: The price recently touched this demand area, showing that buyers are stepping in to push the price higher. This trendline support + demand zone combination strengthens the case for a reversal. 2. Falling Wedge Pattern (Bullish Reversal) The price formed a falling wedge (marked by two converging yellow trendlines). A falling wedge is a classic bullish reversal pattern, meaning that once the price breaks above the wedge, an upward rally is expected. The price broke out of the wedge and started moving higher, confirming a potential reversal. 3. Fibonacci Retracement Levels The chart shows a Fibonacci retracement overlay, with key levels: 38.2% level (~$109.98): This acted as support. 23.6% level (~$126.59): A potential first target. The price is currently rebounding from the 38.2% retracement, a strong area where buyers often enter. 4. Projected Price Target (Bullish Move) Blue Arrow Projection: The blue line indicates the expected price path. Target: $153.13 (High) – The price could aim for previous highs after confirmation of the breakout. 5. Volume Confirmation A volume increase at the breakout suggests strong buying interest, further confirming the bullish bias. Conclusion: Why This Is a Buy Setup? ✅ Strong Trendline Support → Buyers defending this area. ✅ Falling Wedge Breakout → Bullish reversal pattern confirmed. ✅ Fibonacci 38.2% Support → Key retracement level holding. ✅ Target Projection to $153.13 → High probability move. This setup suggests that NVIDIA could continue moving upwards in the coming weeks if it maintains above support levels.
Chart Overview (BTC/USDT, 2-Day Timeframe)
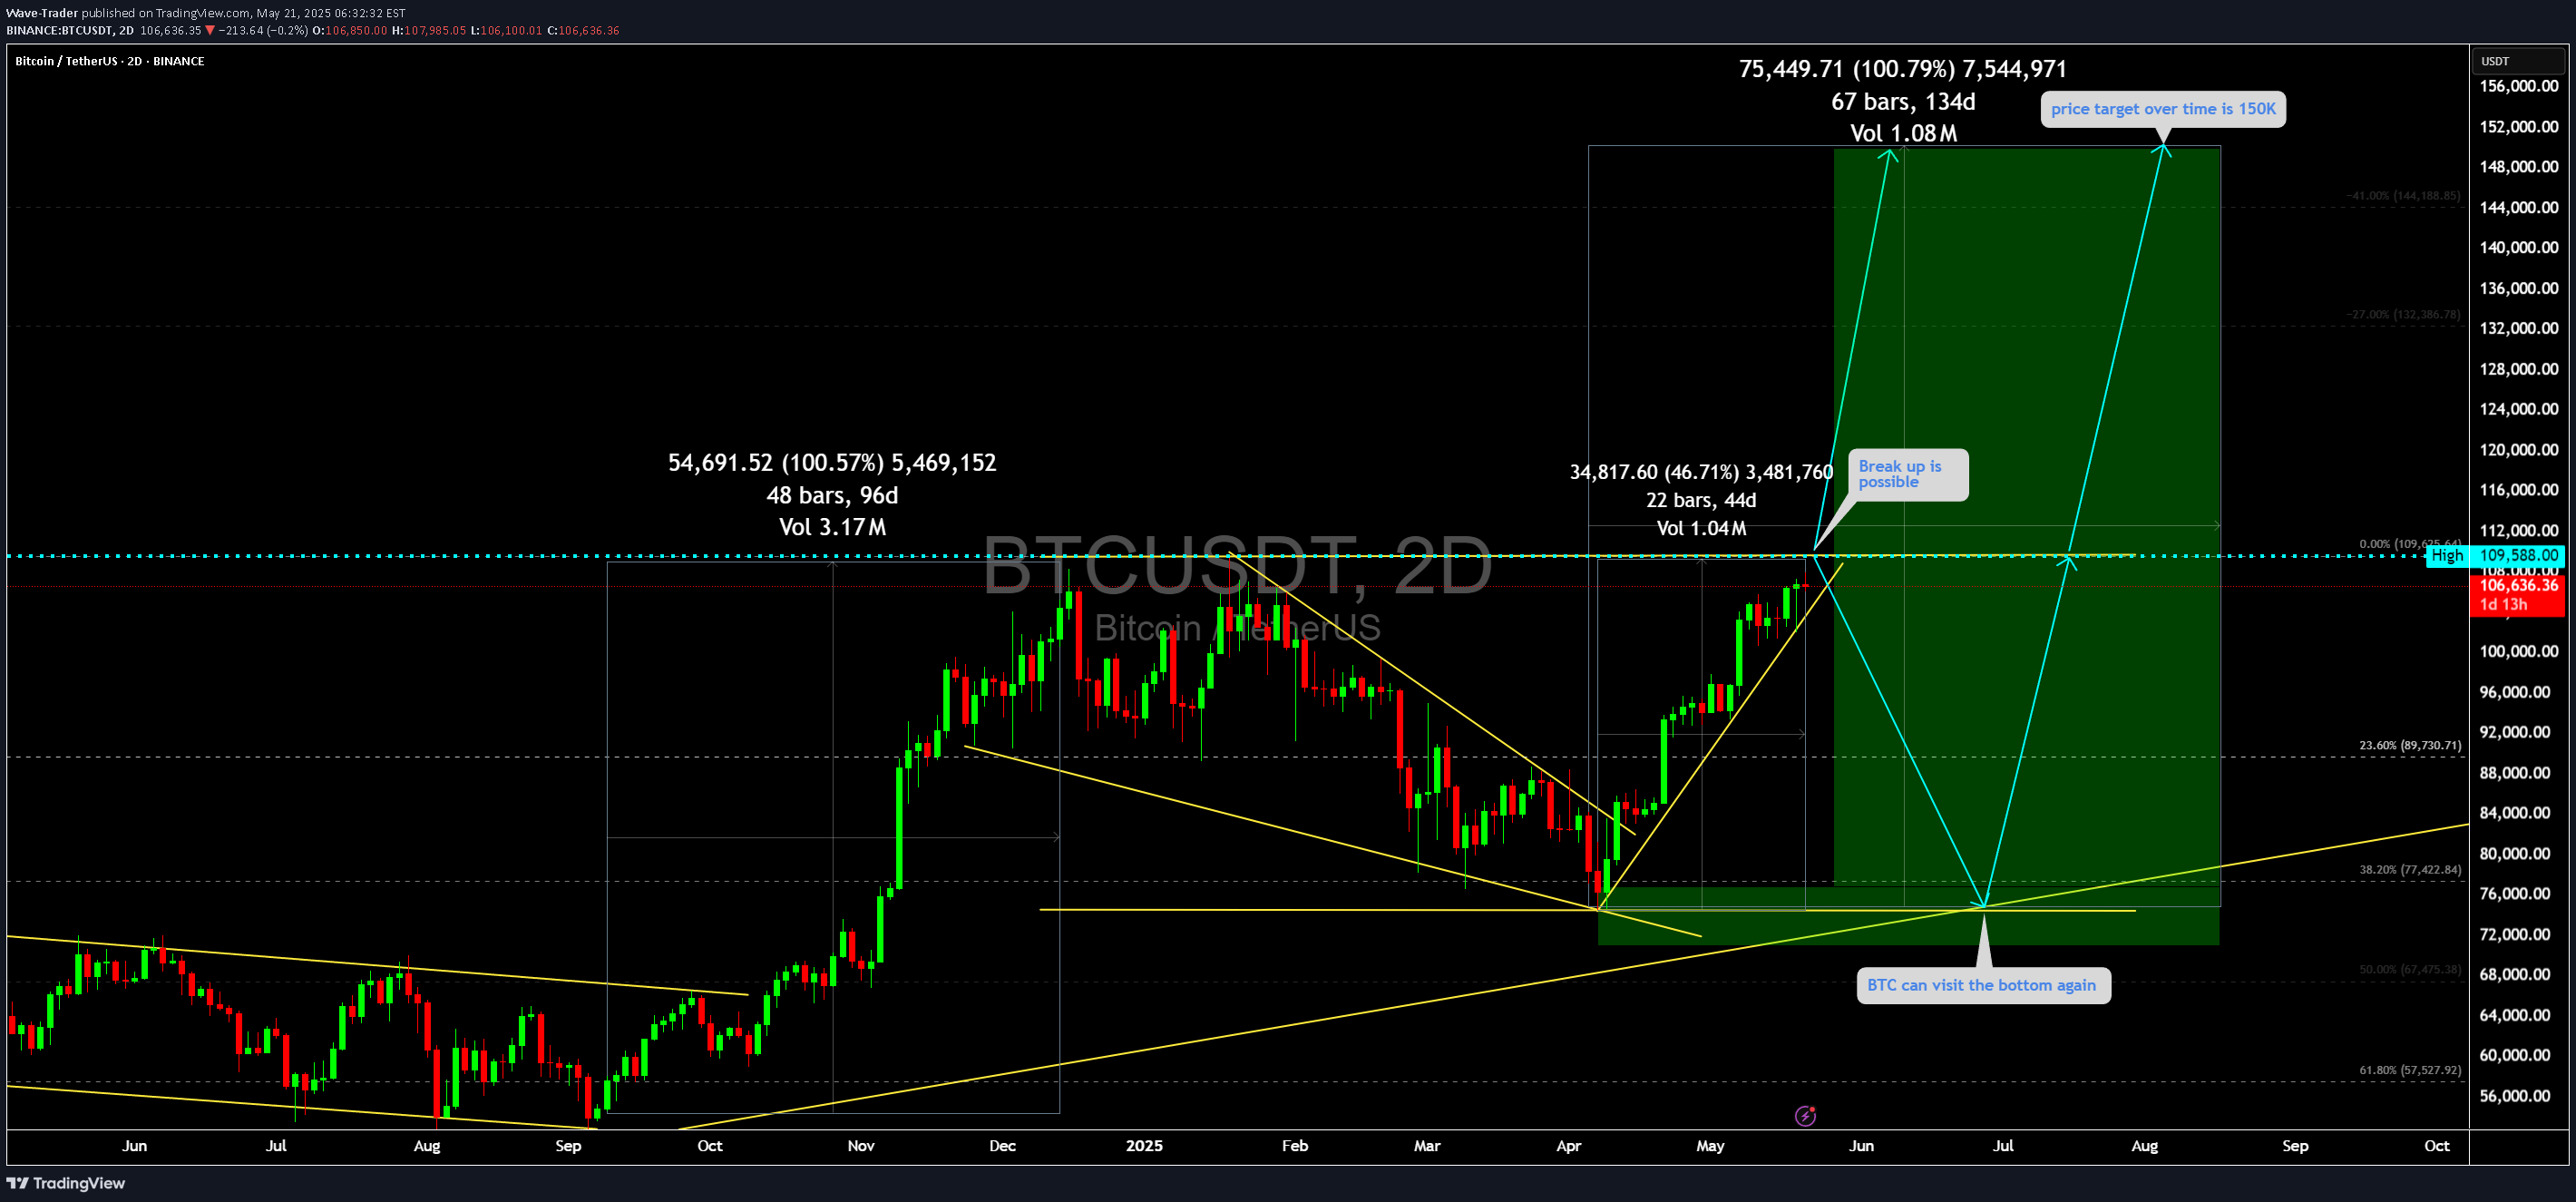
BTC/USDT Multi-Stage Analysis (Daily & 2-Day Charts Combined)Validated Projection: BTC Rallied from 82K to $109KOur previous analysis (dated March 14) accurately:Identified the falling wedge breakoutProjected a rally to $109KUsed Fibonacci zones and measured move targetsShowed a clean 38.2% retracement bounce from $75.2K before the impulsive riseThis historical precision validates our current bullish outlook, strengthening confidence in the extended projection toward $132K–$150K. Latest 2-Day Chart Setup: Potential Paths From $109KScenario A: Bullish Continuation to $150KStructure: Currently consolidating beneath $109K resistanceSymmetry Setup: Mirrors the prior 100% rally over ~97 daysProjected Move: $109K ➝ $150K (~71% gain) over ~108 daysBullish Confirmation:Momentum continuation post-breakoutStrong demand zones holdingLong-term trendline still respectedScenario B: Bearish Retest to $75K Before ResumptionPotential pullback zone: $75K–$78KFibonacci support: 38.2% at ~$77K, 50% at ~67KWould mimic the prior correction phase from March–May 2024Offers a solid reaccumulation zone before another leg upBearish Risks Include:Overheated sentimentRegulatory headwindsGlobal macroeconomic shifts🎯 Long-Term Target Projection: $150,000+Wave structure and historical patterns support continuation to $132K–$150KFibonacci extensions align with:100% measured move = $132K1.618 extension = ~$150K+Backed by our previously accurate wedge breakout projection, this target range becomes highly plausible. Consolidated Technical SummaryTypeLevel/TargetNotesSupport 1$89,924 (23.6%)Minor retracementSupport 2$77,422 (38.2%)Strong historical bounce zoneSupport 3$67,475 (50%)Deeper correction, still bullishResistance 1$109,588Key breakout levelTarget 1$132,590100% move projectionTarget 2$150,000+1.618 Fibonacci extension🧠 Analyst Note (Strategy Recommendation):Already Long from 82K? A trailing stop near 98K–$101K may help lock in profits.Looking to Enter Fresh?A break and close above $110K confirms bullish continuation.A pullback to $75K–$77K offers a high-probability reentry zone.
Bitcoin Bullish Breakout: Potential Rally to 109K and Beyond

This BTC/USDT (Bitcoin to Tether) daily chart presents a bullish setup, forecasting a significant move to the upside. Below is a detailed breakdown of the tools applied and how they contribute to this buy setup.1. Breakout from Descending Channel (Bullish Reversal)The chart previously formed a descending channel (yellow trendlines), which is a bullish continuation pattern in an uptrend.BTC has broken out of this channel, confirming a trend reversal to the upside.2. Strong Demand Zone (Green Box)The green zone represents a strong support area where buyers are stepping in.The price has bounced from this zone, indicating that BTC found strong demand.3. Fibonacci Retracement Levels as SupportFibonacci retracement is applied, and the 38.2% level (around 77,626 USDT) is acting as a strong support.The 23.6% level (around 89,994 USDT) is a key target before BTC reaches new highs.4. Trendline Support (Long-Term Bullish Trend)A yellow ascending trendline acts as long-term support, confirming BTC remains in an uptrend.The price recently tested this trendline and bounced, reinforcing the bullish bias.5. Projected Bullish Move (Blue Arrows)The blue arrows indicate a potential parabolic price increase, targeting new all-time highs.BTC is expected to rise towards 109,588 USDT as the next resistance level.The projection suggests a potential 71.96% gain in 108 days.6. Volume ConfirmationThe chart displays increasing volume on the breakout, confirming the strength of the bullish move.Previous breakouts with high volume have led to significant price surges (as seen in the historical pattern on the left).7. Key Levels to WatchSupport Zone: 77,000 - 82,000 USDT (Green Box)Next Resistance: 89,994 USDT (23.6% Fibonacci)Major Target: 109,588 USDT (Projected High)Long-Term High Projection: 130,000 USDT+ConclusionThis bullish setup indicates that Bitcoin has completed a correction and is now ready for a major upward move. The combination of: ✔️ Breakout from the descending channel✔️ Fibonacci support levels✔️ Demand zone bounce✔️ Increasing volume✔️ Long-term trendline supportsuggests a high-probability buy opportunity targeting a move above 100K USDT.Traders may look to enter long positions around 80,000-82,000 USDT, with stop-loss protection below the trendline (around 75,000 USDT), and potential take-profit targets at 109,000 USDT and beyond.
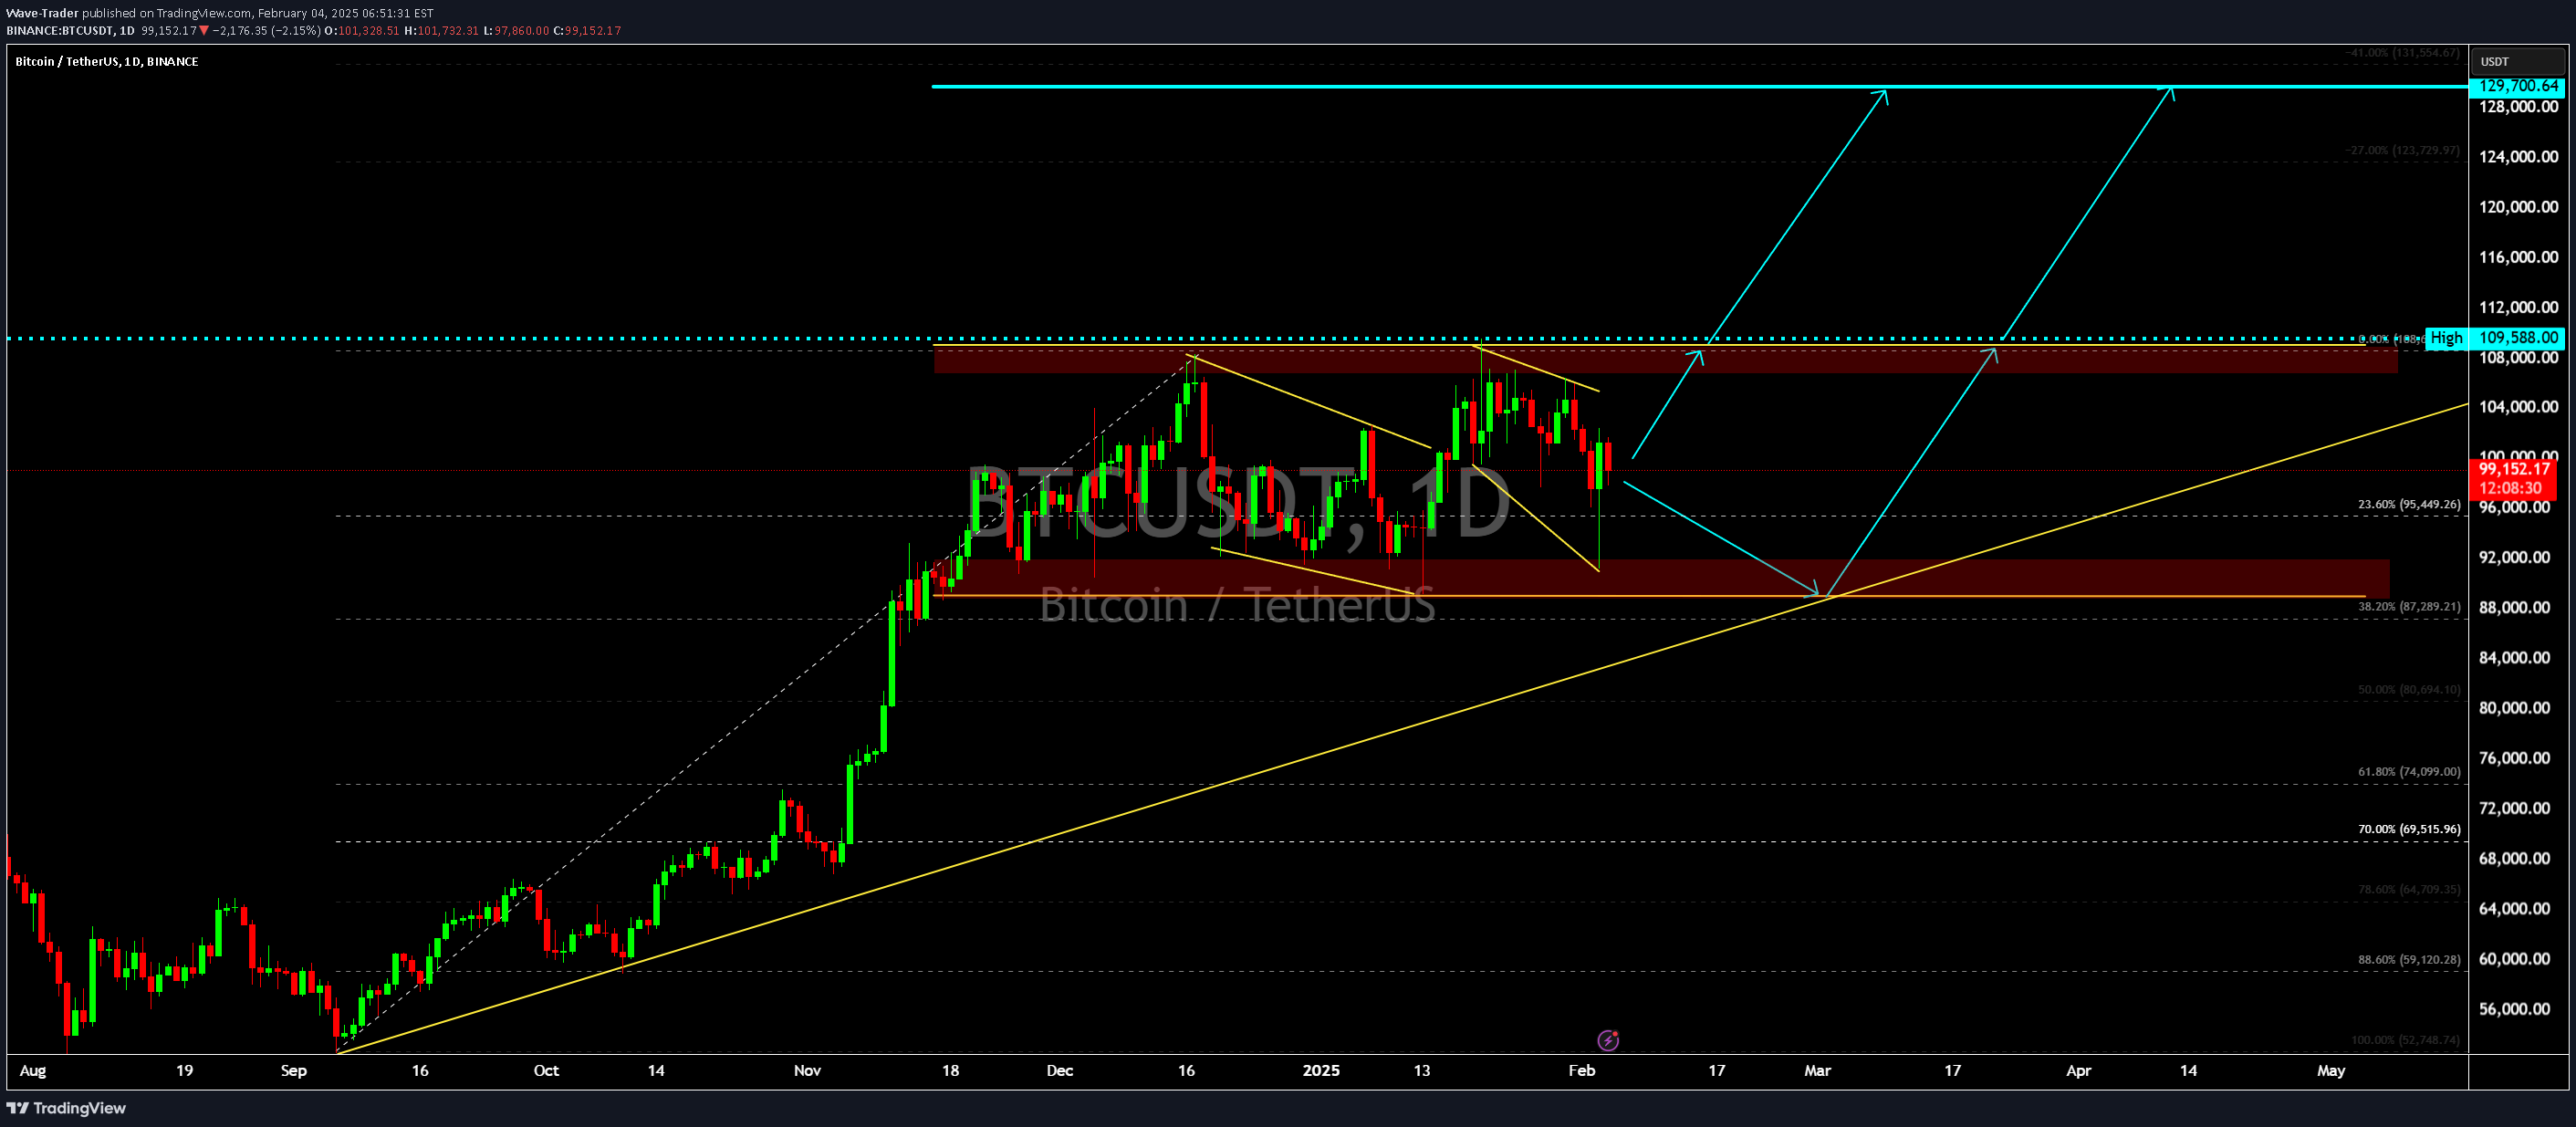
Revised BTC/USDT Buy Setup (Support Entry at $88,000)Support Buy Setup (~$88,000 - $90,000 Zone)🔹 Entry:Buy near $88,000 - $90,000 (strong support + 38.2% Fibonacci level).Wait for bullish confirmation, such as a wick rejection, bullish engulfing candle, or RSI divergence.🎯 Targets:Target 1: $99,000 - $100,000 (psychological level & recent resistance).Target 2: $108,000 - $110,000 (major breakout zone).Target 3: $123,000+ (extension rally).📉 Stop-Loss:Below $86,500 to protect against a deeper drop.📌 Risk Management:Risk/reward ratio: 1:3 or better.Position sizing should account for volatility.Additional Confirmation Factors:✅ Watch BTC price reaction at 88K for reversal signals.✅ Look for higher lows on lower timeframes (4H/1H).✅ If BTC breaks below 87K, wait for a re-entry lower.
WAVESUSD Watch price action for long
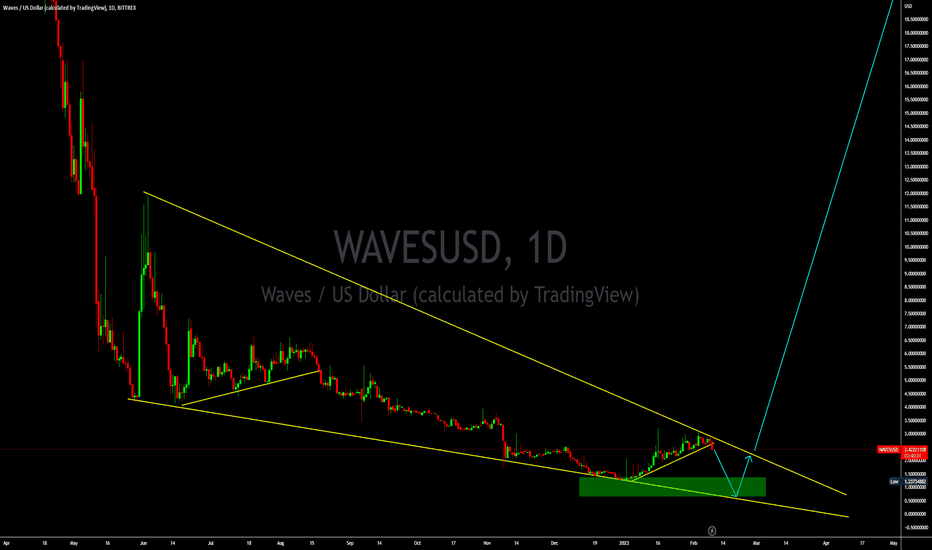
WAVESUSD is setting up for buy setup.Watch price action at bottom and look for long.Good Luck
IOTUSD Watch price action for long

Hi there , IOTUSD is setting up for long. Watch price action at current price and look for lower time frame breakup. If price visit the bottom buy more. Good Luck
AVAXUSDT Watch price action for long

AVAXUSDT Watch price action for long AVAXUSDT is setting up for buy setup. Watch price action at bottom and look for long. Good LuckComment:
Disclaimer
Any content and materials included in Sahmeto's website and official communication channels are a compilation of personal opinions and analyses and are not binding. They do not constitute any recommendation for buying, selling, entering or exiting the stock market and cryptocurrency market. Also, all news and analyses included in the website and channels are merely republished information from official and unofficial domestic and foreign sources, and it is obvious that users of the said content are responsible for following up and ensuring the authenticity and accuracy of the materials. Therefore, while disclaiming responsibility, it is declared that the responsibility for any decision-making, action, and potential profit and loss in the capital market and cryptocurrency market lies with the trader.
