Technical analysis by Wave-Trader about Symbol BTC on 3/14/2025

Wave-Trader
Chart Overview (BTC/USDT, 2-Day Timeframe)
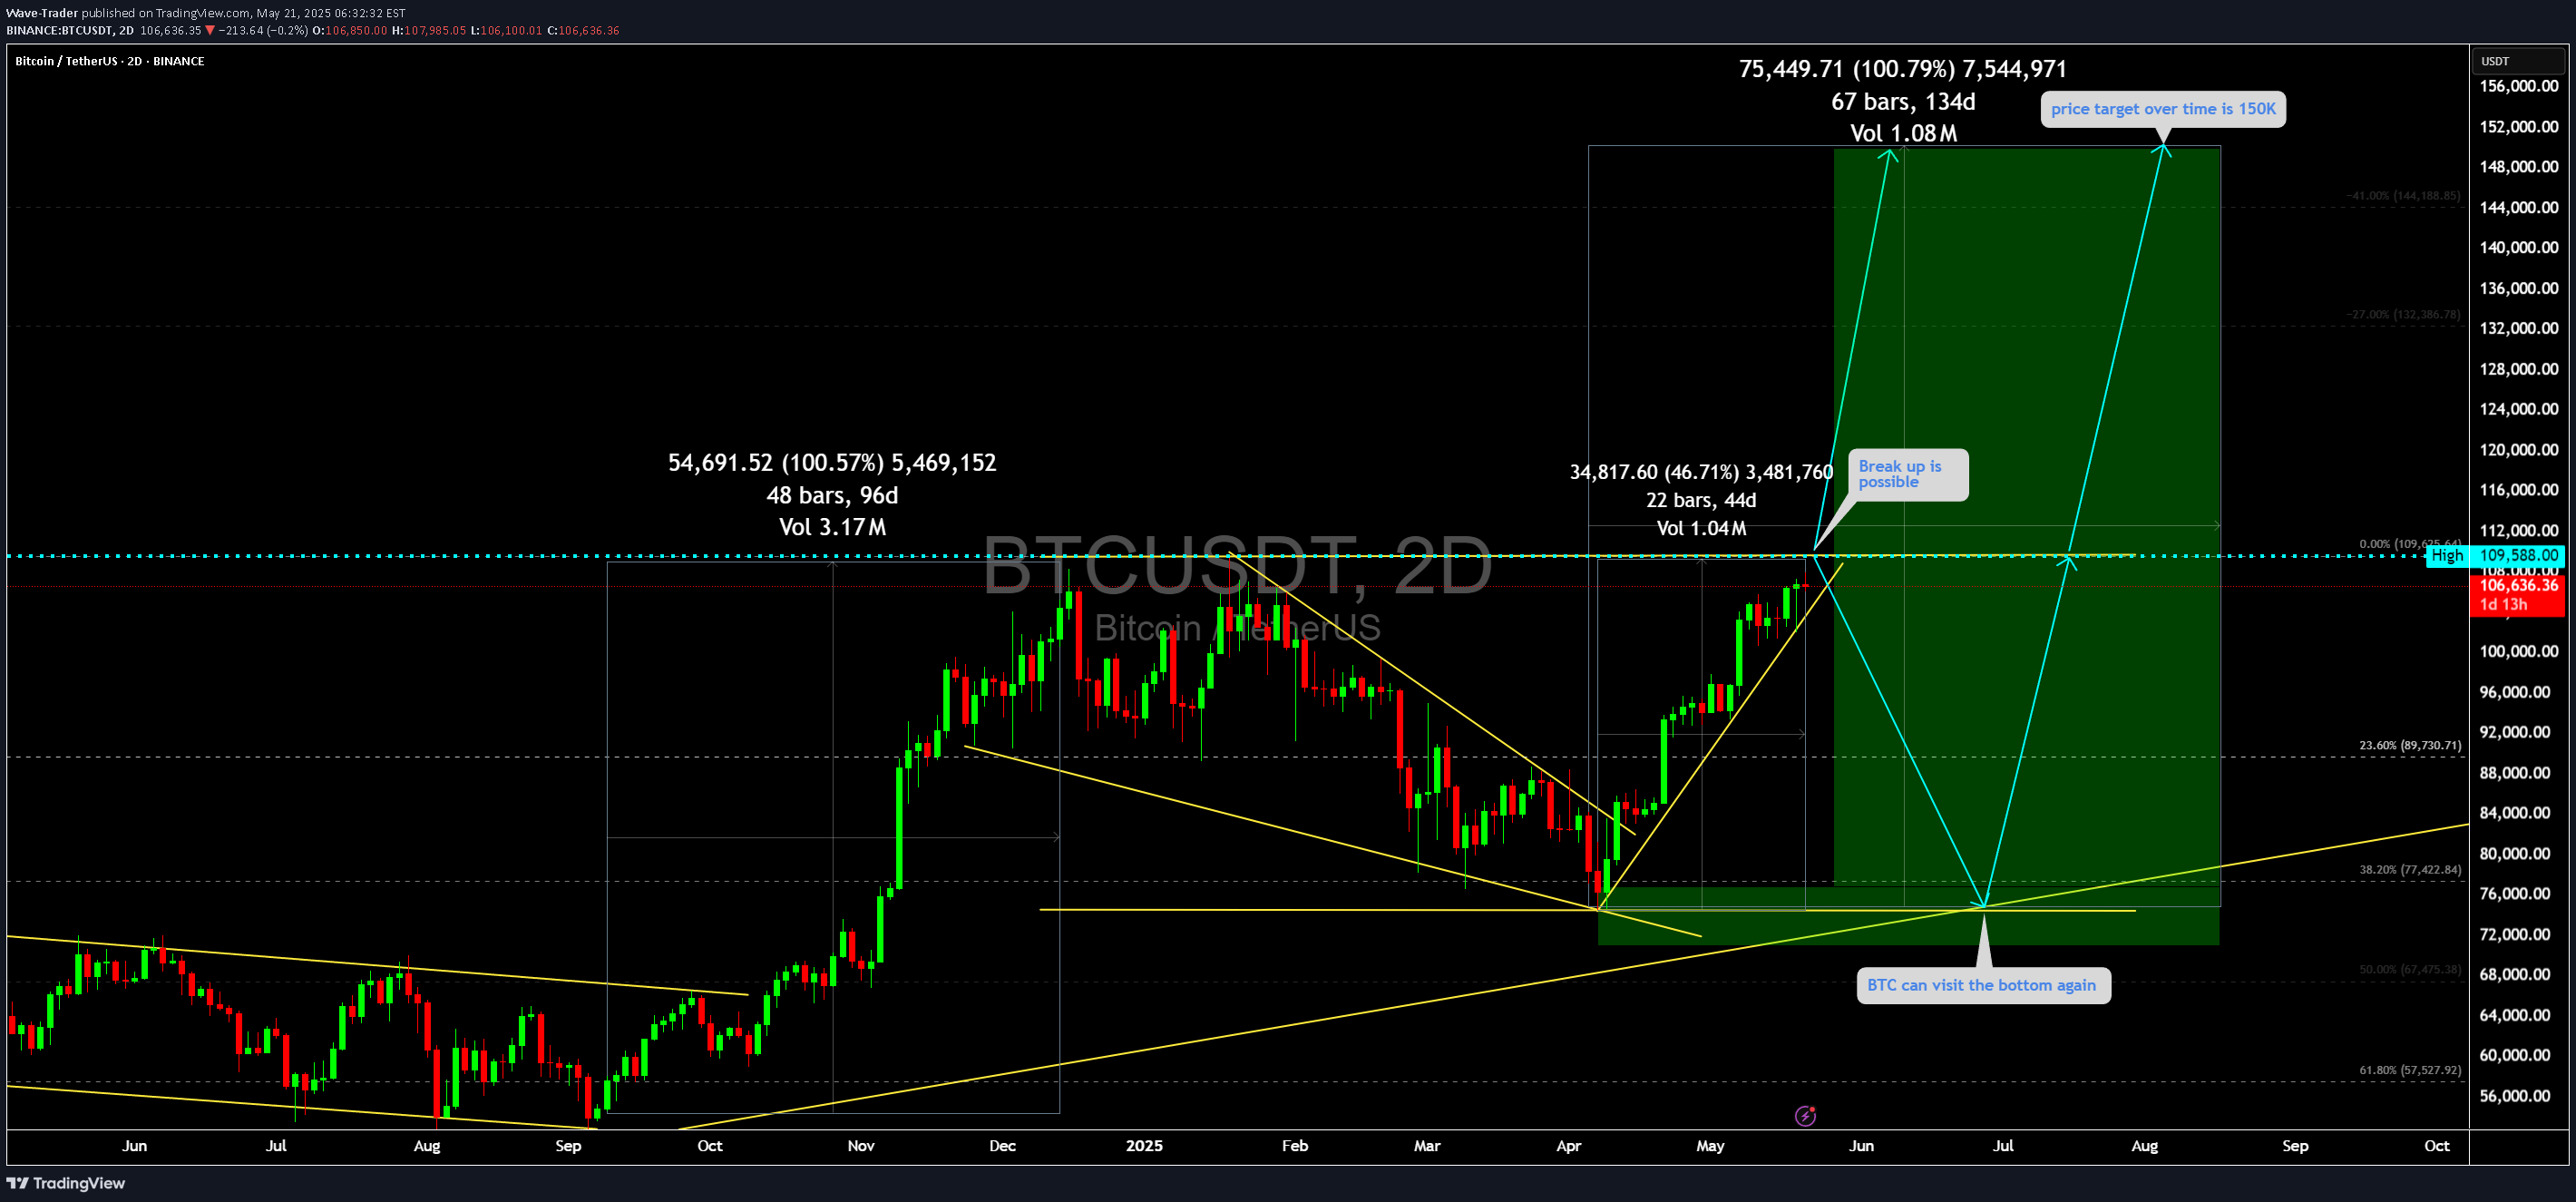
BTC/USDT Multi-Stage Analysis (Daily & 2-Day Charts Combined)Validated Projection: BTC Rallied from 82K to $109KOur previous analysis (dated March 14) accurately:Identified the falling wedge breakoutProjected a rally to $109KUsed Fibonacci zones and measured move targetsShowed a clean 38.2% retracement bounce from $75.2K before the impulsive riseThis historical precision validates our current bullish outlook, strengthening confidence in the extended projection toward $132K–$150K. Latest 2-Day Chart Setup: Potential Paths From $109KScenario A: Bullish Continuation to $150KStructure: Currently consolidating beneath $109K resistanceSymmetry Setup: Mirrors the prior 100% rally over ~97 daysProjected Move: $109K ➝ $150K (~71% gain) over ~108 daysBullish Confirmation:Momentum continuation post-breakoutStrong demand zones holdingLong-term trendline still respectedScenario B: Bearish Retest to $75K Before ResumptionPotential pullback zone: $75K–$78KFibonacci support: 38.2% at ~$77K, 50% at ~67KWould mimic the prior correction phase from March–May 2024Offers a solid reaccumulation zone before another leg upBearish Risks Include:Overheated sentimentRegulatory headwindsGlobal macroeconomic shifts🎯 Long-Term Target Projection: $150,000+Wave structure and historical patterns support continuation to $132K–$150KFibonacci extensions align with:100% measured move = $132K1.618 extension = ~$150K+Backed by our previously accurate wedge breakout projection, this target range becomes highly plausible. Consolidated Technical SummaryTypeLevel/TargetNotesSupport 1$89,924 (23.6%)Minor retracementSupport 2$77,422 (38.2%)Strong historical bounce zoneSupport 3$67,475 (50%)Deeper correction, still bullishResistance 1$109,588Key breakout levelTarget 1$132,590100% move projectionTarget 2$150,000+1.618 Fibonacci extension🧠 Analyst Note (Strategy Recommendation):Already Long from 82K? A trailing stop near 98K–$101K may help lock in profits.Looking to Enter Fresh?A break and close above $110K confirms bullish continuation.A pullback to $75K–$77K offers a high-probability reentry zone.