Technical analysis by Wave-Trader about Symbol BTC on 7/7/2025

Wave-Trader
Analysis of BTC/USDT 2D Chart (July 7, 2025)
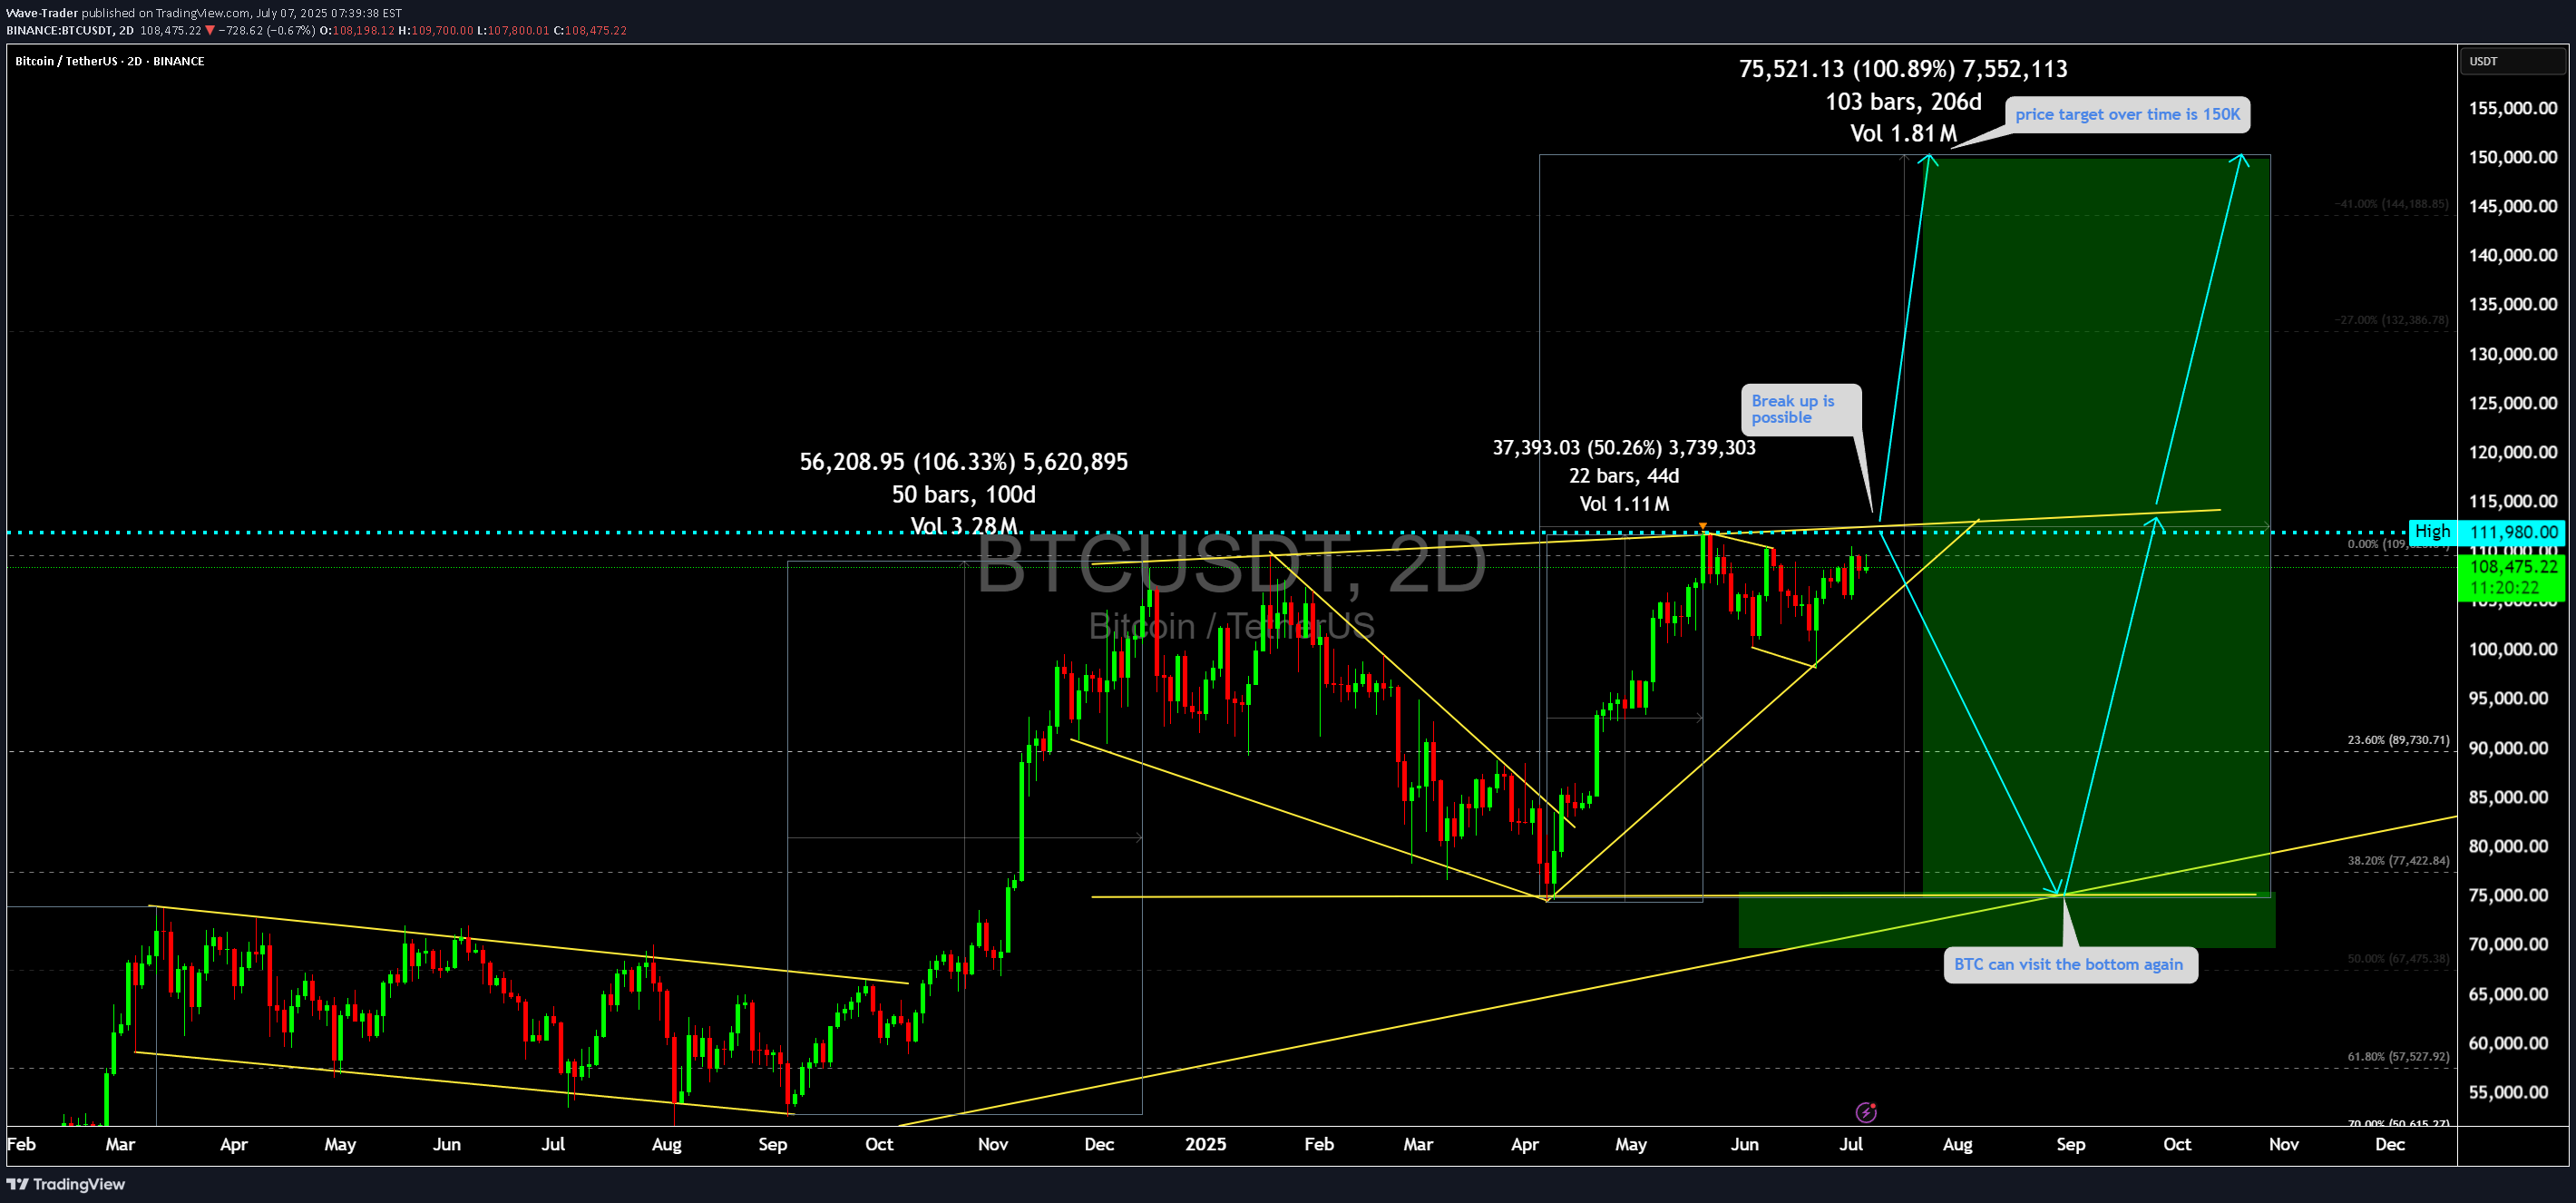
This updated chart for BTC/USDT continues to support a macro bullish structure, offering two main paths from the $109K zone. Below is a consolidated technical and strategic breakdown of the chart you just uploaded, with refined annotations and updated trade logic:📊 Chart Summary – Two Key Scenarios🔹 Current Price: ~$108,450🔹 Resistance: $111,980🔹 Support Zone: $75,000–$77,500🟢 Scenario A: Bullish Breakout to $150,000Structure:BTC is currently consolidating just below $111,980 resistance.Forming a bullish continuation triangle (compressed range into resistance).Breakout Potential: Symmetry projection shows a ~100% rally in ~103–108 days—similar to prior cycles.Target Zones:Target 1: $132,000 (previous 100% measured move)Target 2: $150,000 (1.618 Fib extension)Volume Behaviour:Increasing volume near breakoutVolatility compression before expansion (classic of breakout setups)📈 Signal to Enter: Break and daily close above $112K confirms breakout — initiating aggressive long setups targeting $132K–$150K.🔻 Scenario B: Bearish Pullback to $75K–$77K Before Next Leg UpStructure:Price could reject the $111K zone and revisit previous demand base around $75K.This would mirror the past March–May correction (50% drop → recovery).Converges with:38.2% retracement = $77,42250% retracement = $67,475Bullish long-term trendline supportImplication:This would be a healthy correction rather than trend reversalReaccumulating opportunity for long-term traders📉 Signal to Enter: Pullback and bullish structure confirmation around $75K–$77K. Look for volume spike, price rejection wicks, or bullish engulfing candles.📐 Technical Levels RecapTypeLevelSignificanceResistance$111,980Major breakout triggerSupport 1$89,730Shallow retracement zone (23.6%)Support 2$77,422Strong historical bounce zone (38.2%)Support 3$67,475Deep reaccumulating zone (50%)Target 1$132,000100% symmetrical moveTarget 2$150,000+1.618 Fib extension – full euphoric top🧠 Strategy Notes📍 Already Long from ~$82K?Use trailing stop around $98K–$101KLet the position run into strength but be protected against the pullback scenario📍 Looking to Enter Fresh?Wait for clean breakout above $112K — confirms continuationOR, enter near $75K–$77K on corrective retest with bullish confirmation signals🔄 Chart Pattern Comparison:PeriodRally SizeDurationResultSep–Dec 2024+106%~100 daysHit $109KJul–Nov 2025*+100% est.~103 daysProjected $150K✅ Final Thought:This reanalysis confirms that BTC remains in a macro bullish structure, either rallying to $150K directly or after a controlled retest of $75K. Both offer trade setups, and risk can be tightly managed by using key fib levels and support zones.