
UA_CAPITAL
@t_UA_CAPITAL

What symbols does the trader recommend buying?
Purchase History
پیام های تریدر
Filter
UA_CAPITAL
پیشبینی هفته اول ۲۰۲۶: آیا صعود QQQ ادامه مییابد یا سقوط در راه است؟

QQQ Weekly Outlook – Week 1 of 2026 Technical Look: Price moved exactly as planned in my December 21 Weekly QQQ outlook (you can check the linked idea). The market bottomed on December 17, as anticipated in my December 14 Weekly QQQ prediction, and then started to move higher. Price reached both of my targets and began retracing from those levels. (Please refer to the linked post for details) Currently, QQQ is retracing from the highs and appears to be seeking additional liquidity and energy before any continuation higher. This consolidation phase may take longer than initially expected. Scenarios – Prediction: Scenario 1: Bullish Scenario I am looking for price to break and close above the 614.5 level on the 4H timeframe. A confirmed 4H close above 614.5 would indicate that the bullish scenario is in play, and I would consider engaging on the long side. Potential upside targets for this scenario: 621.75 – 629.5 Scenario 2: Bearish Scenario If price fails to break above 614.5, I would consider that QQQ is shifting into a bearish flow and seeking lower prices. In that case, I would look to engage on the short side. Downside targets for this scenario: 610 – 606.25 – 600 – 588.5 The 588.5 level represents the most extended bearish scenario. If price breaks 600 aggressively , I would then expect a move toward 588.5. Position Management Notes: Each target level may trigger significant pullbacks or reversals. Personally, I take partial profits at these levels and keep the remaining position open toward the next targets, while trailing the stop loss to breakeven. This is how I manage my positions. I share deeper US Market breakdowns and weekly scenario updates on Substack. Link is in my profile. This analysis is for educational purposes only and reflects my personal opinion. It is not financial advice.The black scenario worked pretty well. As I mentioned, if QQQ breaks the put wall at 614.75, I would be buying calls, targeting 621.5 first and then 629 (all time highs). I am still holding part of my position toward 629
UA_CAPITAL
QQQ (NQ-US100) Weekly Prediction – Outlook (21 DEC)
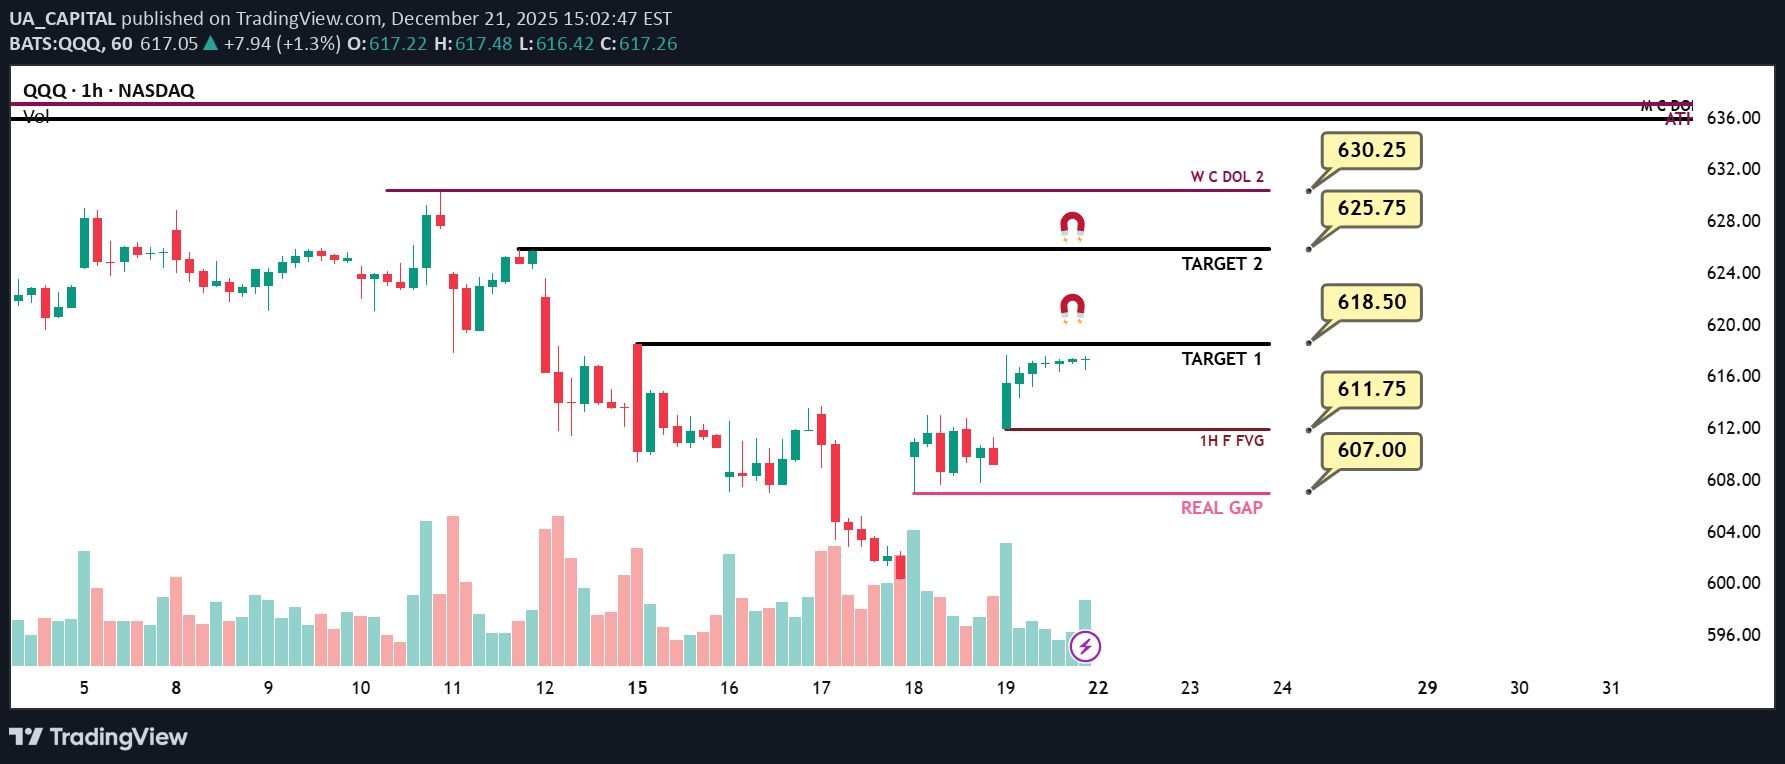
QQQ (NQ-US100) Weekly Prediction – Outlook (21 DEC) 📊 Market Sentiment Market sentiment turned fully bullish after the CPI data came in significantly lower than expected on Thursday. While the consensus expectation was 3.1%, the actual CPI print came at 2.7%, representing a meaningful downside surprise. This data does not directly determine the outcome of the January FED meeting, as another CPI report will be released on January 13, 2026, which will be far more critical for the FED’s decision making process. However, the current soft inflation trend increased the probability of another lower CPI reading in January, which positively impacted risk sentiment across markets. 📈 Technical Analysis Last week’s QQQ analysis played out perfectly. I hope you were able to capitalize on it. Price reversed precisely from the levels we anticipated following the CPI release. I am linking last week’s QQQ weekly analysis below for reference. After the CPI data, price transitioned back into a clean bullish structure on both the daily and weekly timeframes. On Friday, QQQ rallied impulsively and closed the week with strong bullish momentum. Overall, I think the market structure supports bullish continuation. 📌 Game Plan I think QQQ may directly test 618.5 (Target 1) early in the week, followed by a move toward 625.75. These are the two bullish targets I expect to be reached within this week. Price may also move toward these targets without any meaningful retracement. I plan to close one third of my call options at 618.5 and the remaining portion at 625.75 from the positions I am holding since Thursday. If price pulls back to 611.75 or 607 before reaching 625.75 and prints strong 1H or 4H bullish candle closes, I will look to add new call option positions targeting 625.75. In the event of a developing bearish structure, I will provide updates. However, at this stage, I do not see any clear bearish signals. 💬 For deeper sentiment and strategy insights, subscribe to my Substack free access available. This analysis is for educational purposes only and does not constitute financial advice. Always conduct your own research before trading or investing.Target 1 was perfectly hit at the open. I sold 1/3 of my call positions at 618.5, as I stated earlier. Im now waiting to see whether we get a retracement and a bounce to add more calls, targeting 625.75. However QQQ is the weaker instrument here so SPY is the better choice for call positions.We slightly missed the 625.75 level due to the contract expiry. However, we did run the swing high that I mentioned. Therefore, I closed my calls at the 625.10 level. All of my targets for this week were hit. The position is now fully closed.
UA_CAPITAL
BITCOIN PREDICTION – GAME PLAN
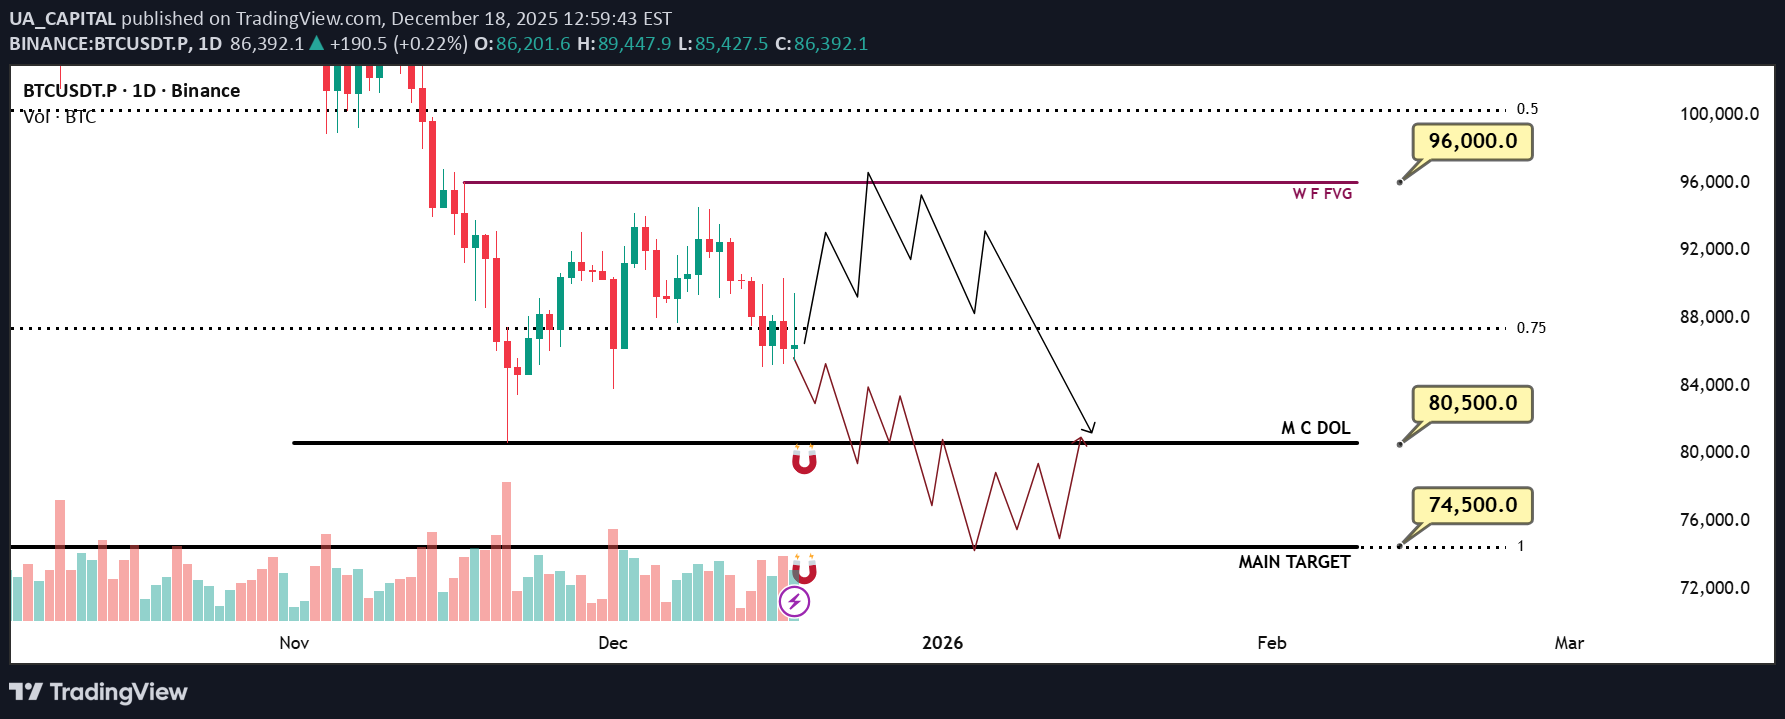
📊 Market Sentiment Market sentiment is currently extremely bearish. We continue to see consistent outflows from Bitcoin ETFs. In addition, the Fear & Greed Index is sitting at 22 (Fear zone) and has remained there for some time. Bitcoin has largely decoupled from the S&P 500 (US markets), and capital does not appear to be flowing into crypto at the moment. Unless a new and strong narrative emerges, I do not expect the market direction to change. Today’s CPI data came in at 2.7% versus a 3.1% expectation, which could act as a positive catalyst for risk assets. We saw this effect clearly in U.S. equities; however, Bitcoin and the broader crypto market remained unresponsive. This further confirms my view that sentiment remains aggressively bearish. 📈 Technical Analysis Price has been in a clear downtrend for some time. Over the past month, Bitcoin has been consolidating within a tight range. In my opinion, this consolidation is more likely to resolve to the downside. While risk assets such as US100 continue to push higher, Bitcoin’s inability to follow reflects clear relative weakness. 📌 Game Plan – Prediction I am monitoring two main scenarios: Scenario 1 (Red Line – More Likely) I expect price to decline toward $80,500, where we may see a short term bounce. However, I believe this bounce will fade, with the primary downside target at $74,500. After price runs $74,500, I will be looking for potential long/buy opportunities. Scenario 2 (Black Line) Price first moves up toward $96,000, gets rejected from that level, and then closes back below it. From there, I expect continuation to the downside toward $80,500 and potentially $74,500. 💬 For deeper sentiment and strategy insights, subscribe to my Substack free access available. This analysis is for educational purposes only and does not constitute financial advice. Always conduct your own research before trading or investing.
UA_CAPITAL
WEEKLY QQQ (NQ-US100-USTECH) Outlook - Prediction (14 DEC)
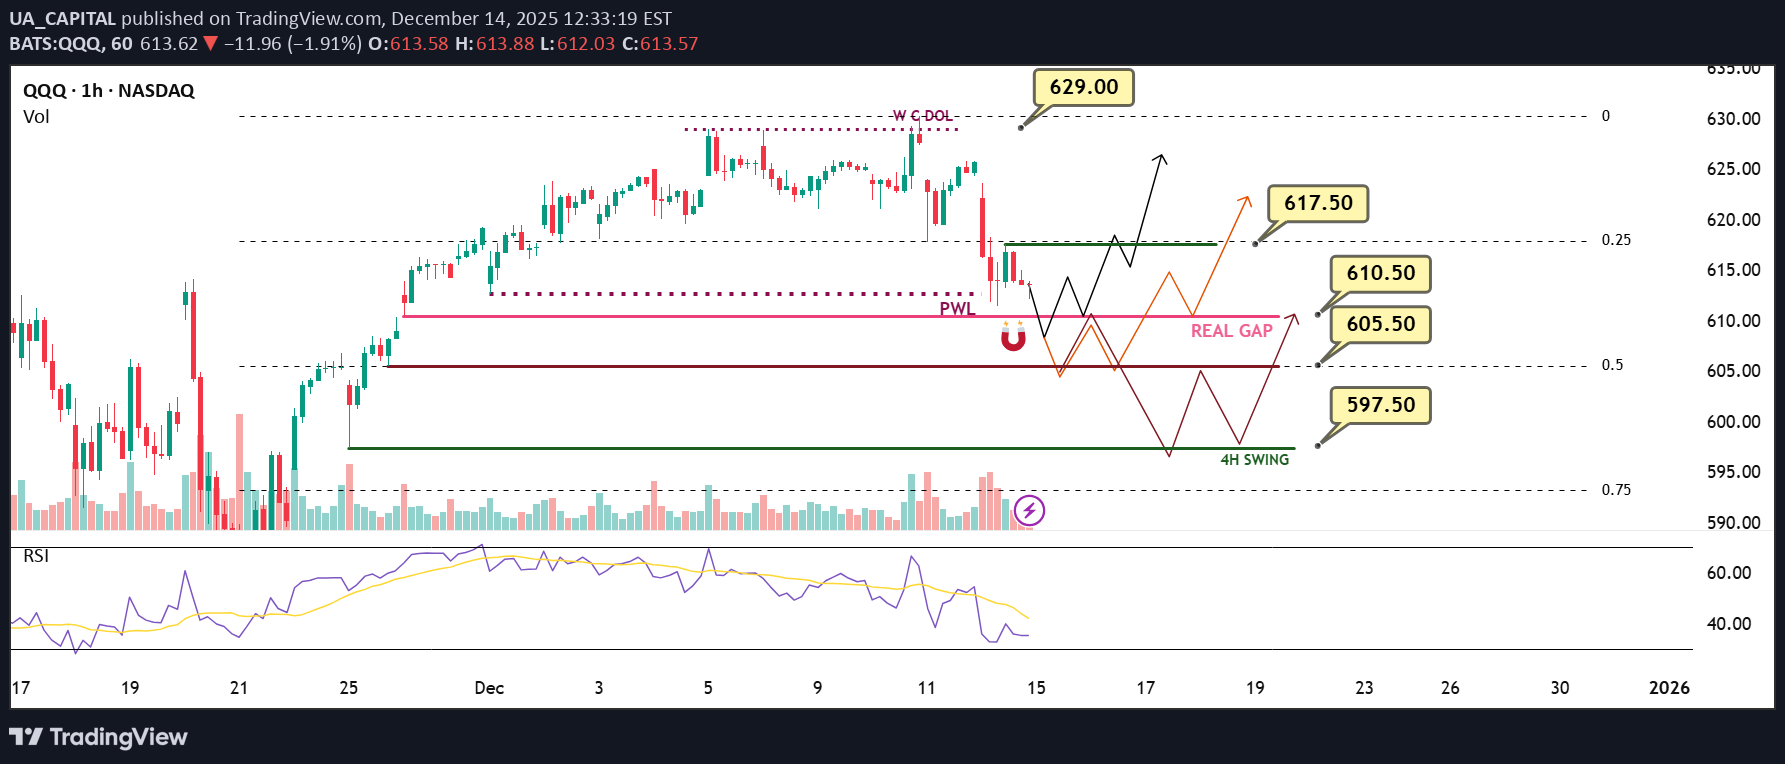
WEEKLY QQQ (NQ-US100-USTECH) Outlook - Prediction (14 DEC) 📊 Market Sentiment Market sentiment has turned slightly bullish again following the FED’s rate cut decision. We saw the market react quickly after Powell’s speech. QE has restarted, and the FED stated it will buy $40 billion of Treasury bills over the next 30 days. This narrative supports the bullish case; however, $40B is relatively small compared to the overall size of the U.S. market. At the same time, the bearish narrative is strengthening. Powell stated that “rates are now in a plausible range of neutral,” and the FED emphasized that it will assess incoming data until the January meeting. No decision has been made for January yet. This keeps the market in a state of uncertainty and when the market lacks a clear narrative, it often turns bearish. Keep this in mind. 📈 Technical Analysis QQQ hit the 629 level, as I pointed out last week. I am linking last week’s QQQ prediction below for reference. Price ran the 629 level but could not close above it. After that, we saw selling pressure due to SPY and YM hitting all time highs and getting rejected. QQQ was the weaker index last week, which explains why we did not expand as much as SPY and why QQQ failed to reach all time highs. I believe the expansion higher will resume, but first price needs to gather more energy before continuing upward. 📌 Prediction – Outlook I am tracking three different scenarios: Scenario 1 (Black Line) – Bullish: Price runs the 610.5 level and closes above it. If this occurs, I will be buying calls, targeting 617.5 first, with a runner for higher levels. Scenario 2 (Orange Line): Price retraces to 610.5 and closes below, creating a deeper pullback. Price then reaches 605.5 and closes back above it. This would likely initiate bullish momentum. In this case, I would be buying calls, targeting 610.5 first and 617.5 as the second target. Scenario 3 (Red Line) – Bearish: Price retraces to 610.5 and aggressively closes below. Price then continues lower toward 597.5 without showing strength. If price later closes back above 597.5, I will look to buy calls. Initial profit targets would be 605.5 and 610.5. 💬 For detailed insights and broader market context, please check my Substack link in profile. For educational purposes only. This is not financial advice.The unemployment rate came in lower than expected: Bullish for risk assets. Employment change came in higher than expected: Bearish for risk assets. QQQ became more bullish after the data. It closed just above the 610.5 level, which is a bullish indication for me. Also, NQ closed with a bullish reversal pattern on the daily chart. However, I’m still cautious about calls, as CPI data will be released on Thursday, which will be the real indicator for clarifying the FED’s targets and overall market direction. Scalps on tech stocks (such as TSLA, META, and NVDA) can work well in the short term until the CPI release. After that, we should have a clearer bias, and based on it, I’ll build short- to mid-term positions.Scenario 2 (orange line) played out perfectly as expected. Price targeted 610 first, then 605, exactly as I pointed out. After that, we bought calls and targeted 617. It doesn’t get better than this.
UA_CAPITAL
QQQ (US100 – USTECH – NQ) WEEKLY PREDICTION - (08 DEC)
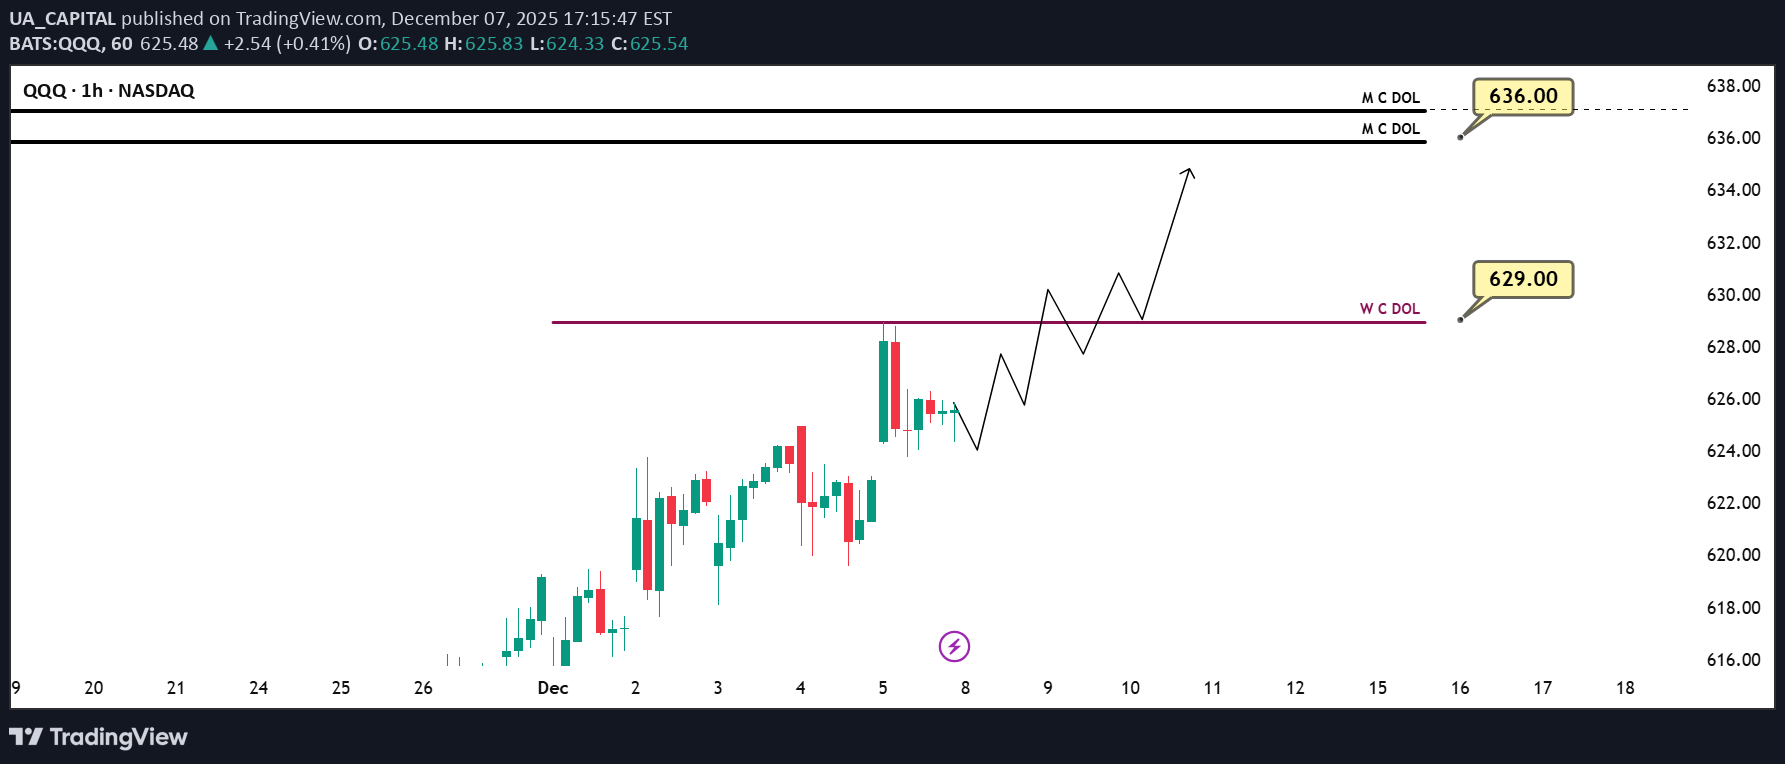
QQQ (US100 – USTECH – NQ) WEEKLY PREDICTION 📊 Market Sentiment Market sentiment remains bullish, supported by expectations of a potential FED rate cut in December. Additionally, Trump’s likely nominee for the next FED Chair Kevin Hassett, a strong advocate of aggressive rate cuts has strengthened this bullish outlook. Markets have already begun pricing in the possibility of earlier and more aggressive cuts throughout 2026, fueling continued upside momentum. 📈 Technical Analysis QQQ is strongly bullish at the moment. In my opinion, as long as SPY continues pushing toward all time highs, QQQ is unlikely to experience any meaningful retracement. 📌 Game Plan – Prediction I expect QQQ to reach 629 this week at minimum. A strong move may occur right after the market opens however, since the FED decision will be released on Wednesday, the early part of the week may show some choppy or ranging price action. 💬 For deeper sentiment and strategy insights, subscribe to my Substack free access available. ⚠️This analysis is for educational purposes only and does not constitute financial advice. Always conduct your own research before trading or investing.The 629 target was hit perfectly, just as I mentioned. Ahead of the FED’s decision on Wednesday, we saw low volatility conditions with accumulation and ranging behavior.
UA_CAPITAL
APPL (APPLE) BUY IDEA
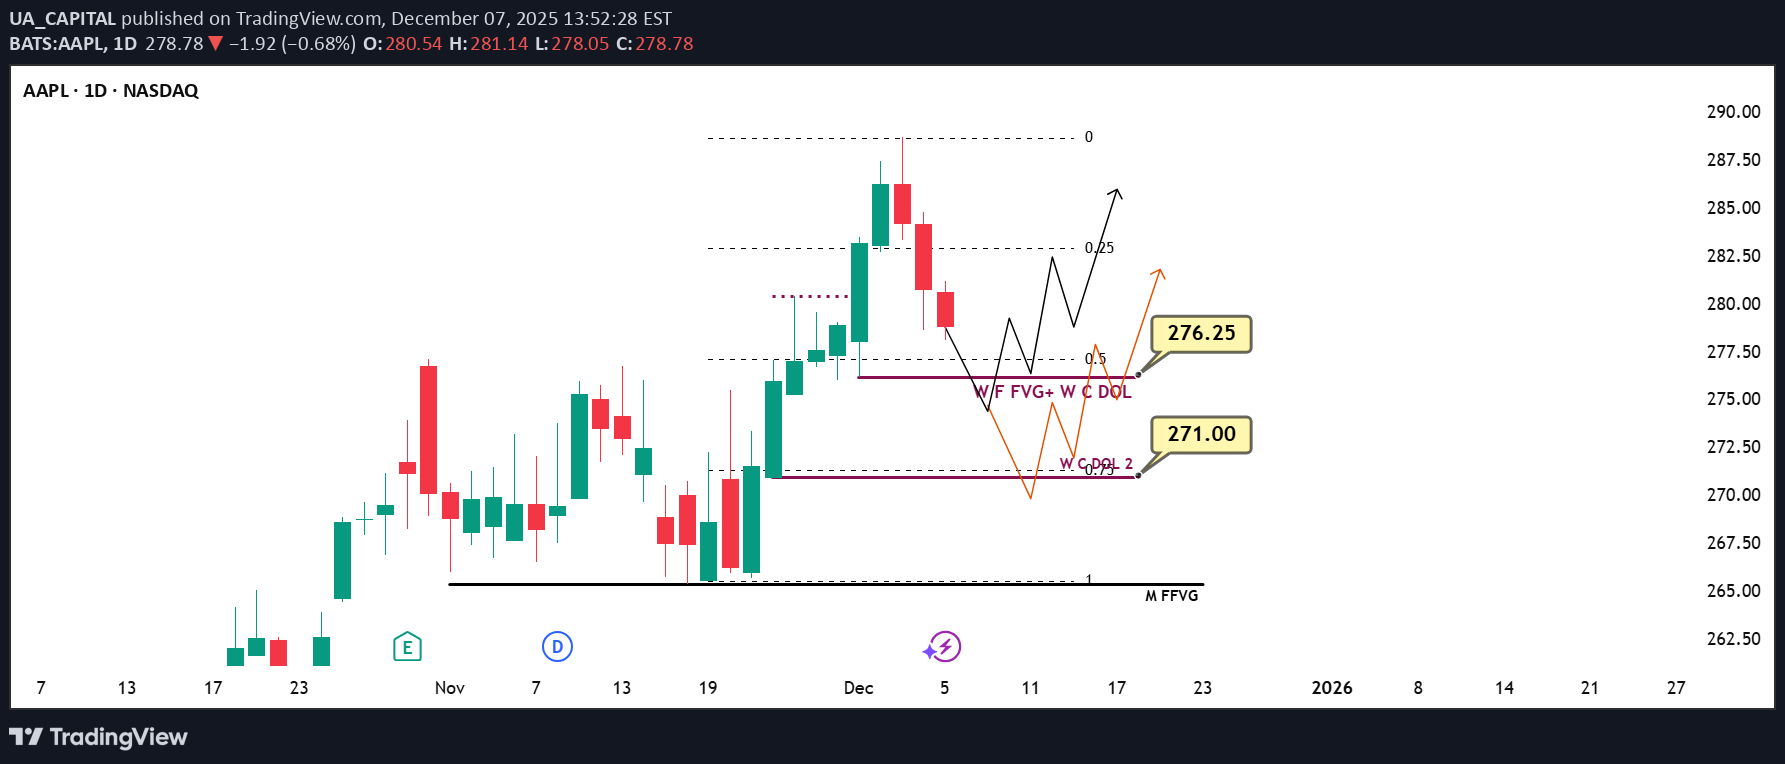
APPL (APPLE) BUY IDEA 📊 Market Sentiment Market sentiment is bullish, driven by expectations of the FED’s potential rate cut in December. In addition, Trump’s likely nominee for the new FED Chair is Kevin Hassett a strong supporter of aggressive rate cuts. This possibility has pushed markets higher as participants began pricing in earlier and more aggressive cuts for 2026. 📈 Technical Analysis AAPL remains one of the most bullish stocks in the U.S. market. All higher timeframes are strongly bullish. We are currently seeing a retracement from recent all time highs, which in my opinion is simply a healthy pullback to build momentum for higher prices. 📌 Game Plan I have two key Points of Interest for potential long entries. Both support a bullish continuation thesis, and I do not expect a major bearish shift for AAPL anytime soon. Scenario 1: Price taps 276.25 and bounces. I will wait for a daily bullish close to confirm the continuation. Scenario 2: Price dips into 271 and bounces. I will again look for a daily bullish close as confirmation. Note: The FED’s rate decision will be released on Wednesday at 2 PM. Until then, I expect price to potentially move into an accumulation or range phase. If I see strong movement earlier in the week, I won’t hesitate to take a long position. 💬 For deeper sentiment and strategy insights, subscribe to my Substack free access available. ⚠️ This analysis is for educational purposes only and does not constitute financial advice. Always conduct your own research before trading or investing.The $271 level is holding the price for now. I bought the stock at that level. I will be taking profits at 276, 278, and 280, and I will hold the remaining position toward all-time highs. The first target is 276. Once that target is hit, I will move my stop loss to breakeven.
UA_CAPITAL
پیشبینی روزانه نزدک (QQQ): مسیر صعودی یا اصلاح در انتظار ۱۹ آبان؟
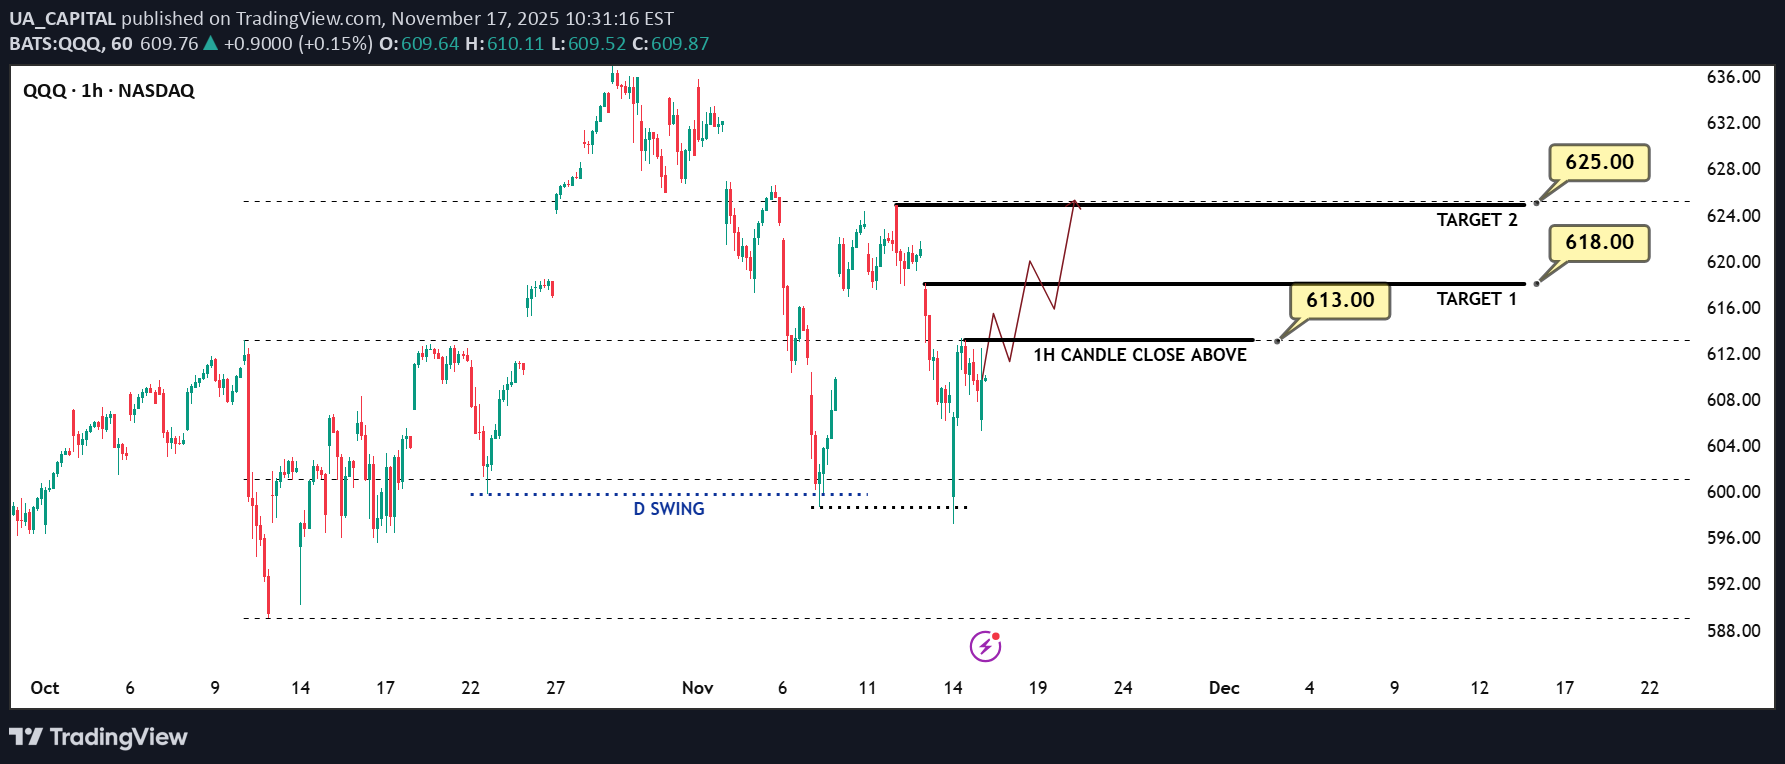
Daily QQQ (US100-NQ) Outlook - Prediction (17 NOV) 📊 Market Sentiment Market sentiment appears bearish right now, in my opinion. The FED may pause rate cuts in December, which has contributed to recent selling pressure and possible hedging flows. However, with the U.S. government reopening last week, we will start receiving updated economic data again. If employment data weakens and CPI comes in low or stable, it could trigger renewed bullish momentum. NVDA will report earnings this Wednesday after market close. I will be watching closely in my view, if NVDA were to miss expectations, both QQQ and SPY could see a strong retracement. However, I think this is unlikely. I expect solid earnings growth and believe the ongoing AI cycle continues to support upside. Additionally, U.S. Treasury Secretary Scott Bessent stated that the Trump administration aims to finalize its trade agreement with China by Thanksgiving (November 27). This could bring further bullish sentiment into the market. 📈 Technical Analysis The market showed a strong bounce on Friday after tapping the 599 level. RSI has also reset, meaning price is no longer overbought. We remain inside the weekly range, and price has now touched the 0.75 max discount zone for the second time. 📌 Game Plan – Prediction A 1H candle close above 613 on QQQ will confirm bullish momentum, setting the next target at 618. If we get a clean 1H close above 613, I will be buying calls. After hitting 618, price may pull back slightly before eventually pushing toward 625 and potentially all-time highs around 637. 💬For detailed insights and broader market context, please check my Substack link in profile. ⚠️ For educational purposes only. This is not financial advice.
UA_CAPITAL
پیشبینی هفتگی QQQ (نزدک 100): سناریوی صعودی یا سقوط سنگین در هفته آینده؟
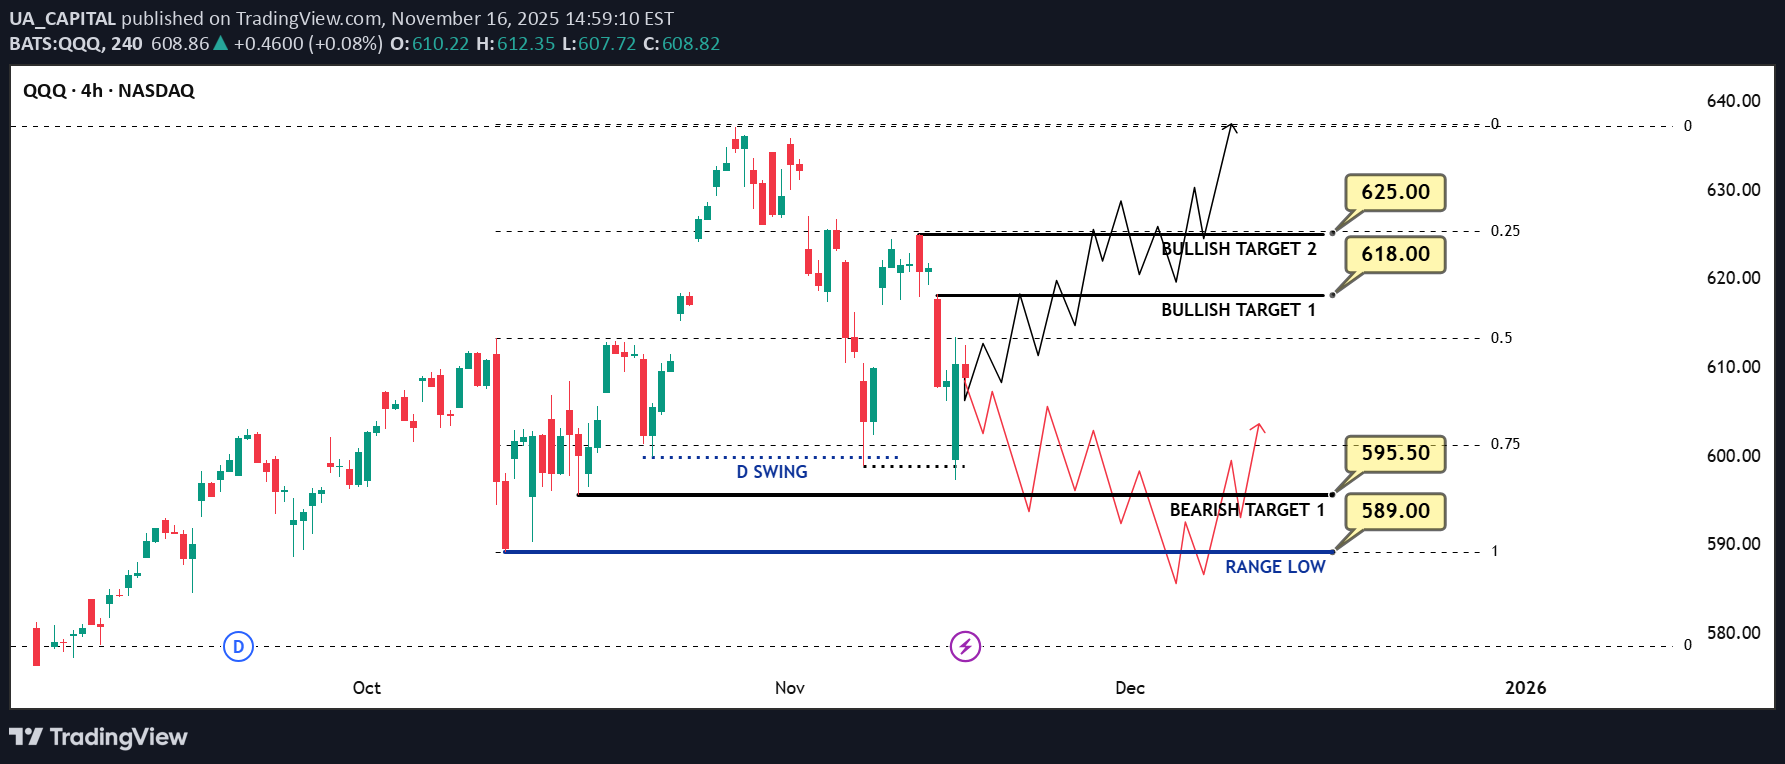
Weekly QQQ (US100-NQ) Outlook - Prediction (16 NOV) 📊 Market Sentiment Market sentiment appears bearish right now, in my opinion. The FED may pause rate cuts in December, which has contributed to recent selling pressure and possible hedging flows. However, with the U.S. government reopening last week, we will start receiving updated economic data again. If employment data weakens and CPI comes in low or stable, it could trigger a renewed bullish momentum. NVDA will report earnings this Wednesday after market close. I will be watching closely in my view, if NVDA were to miss expectations, QQQ and SPY could see a strong retracement. However, I think this is unlikely. I expect solid earnings growth and believe the AI cycle continues to support upside. Additionally, U.S. Treasury Secretary Scott Bessent stated that the Trump administration aims to finalize its trade agreement with China by Thanksgiving (November 27). This could add further bullish sentiment to the market. 📈 Technical Analysis The market showed a strong bounce on Friday after tapping the 599 level. RSI has also reset, meaning price is no longer overbought. We remain inside the weekly range, and price has reached the 0.75 max discount zone for the second time. 📌 Game Plan – Prediction Bullish Scenario (Black Line): I think this scenario is more likely. I want to see price close a 4H candle above 613. If that happens, I will be targeting 618 next. Price may run 618, pull back slightly, then eventually push toward 625 and potentially all-time highs around 637. Bearish Scenario (Red Line): If we see strong selling on Monday, I will assume price may follow the bearish path. In that case, I expect a move toward 595.5 and then the range low at 589. From there, we could see a bounce and a reclaim of 595.5. 💬For detailed insights and broader market context, please check my Substack link in profile. ⚠️ For educational purposes only. This is not financial advice.
UA_CAPITAL
پیشبینی امروز QQQ (نزدک): حرکت صعودی ادامه دارد؟ (تحلیل 14 نوامبر)
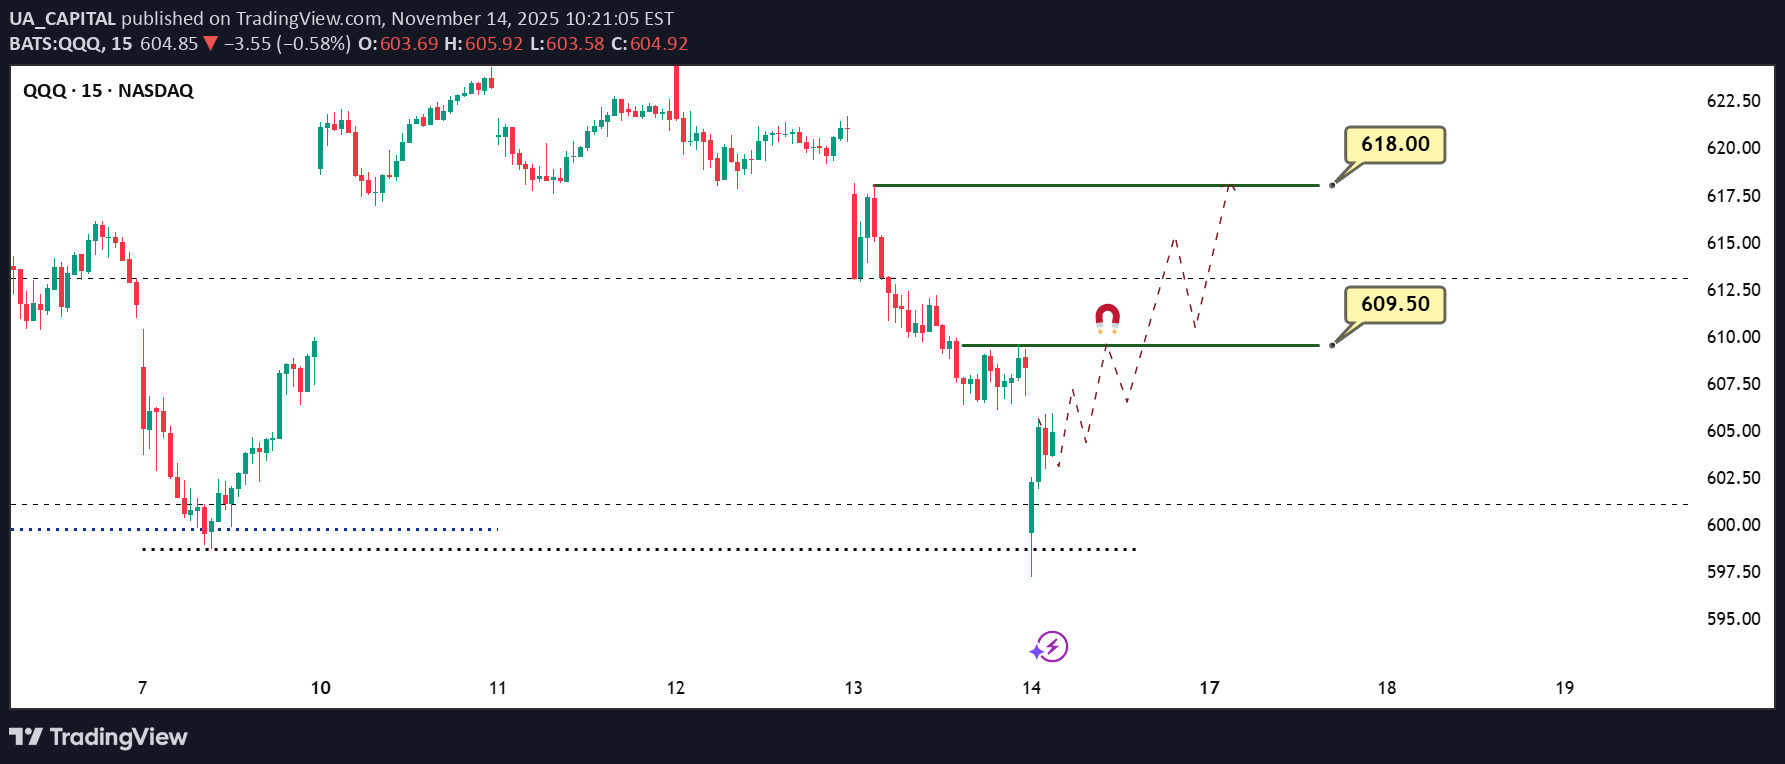
Daily QQQ (US100-NQ) Outlook - Prediction (14 NOV) 📊 Market Sentiment Market sentiment appears neutral, in my opinion. The U.S. government is expected to reopen soon; however, officials have decided not to release previous economic data. This creates uncertainty for traders without key data, it becomes difficult to anticipate the FED’s next policy decisions. 📈 Technical Analysis QQQ tapped the weekly swing low at 687 and was rejected from that level. SPY retested the 637 zone, which is the range low for me, and reacted with a strong bounce. At the moment, price is showing clear upward momentum, suggesting that a stronger move may develop into the afternoon session. NVDA and AAPL are currently leading the market higher. 📌 Game Plan I bought calls around 601, and I expect to see 609.5 first, and if we get a strong continuation, possibly the 618 level. At 609.5, I will close half of my position, trail my stop-loss to breakeven, and target 618 for the remainder. 💬For detailed insights and broader market context, please check my Substack link in profile. ⚠️ For educational purposes only. This is not financial advice.First target hit! I took half profit here and I'm carrying the rest toward 618. Stop is at breakeven. Profits locked.
UA_CAPITAL
پیشبینی روزانه QQQ (نزدک): استراتژی معاملاتی امروز ۱۳ آبان!
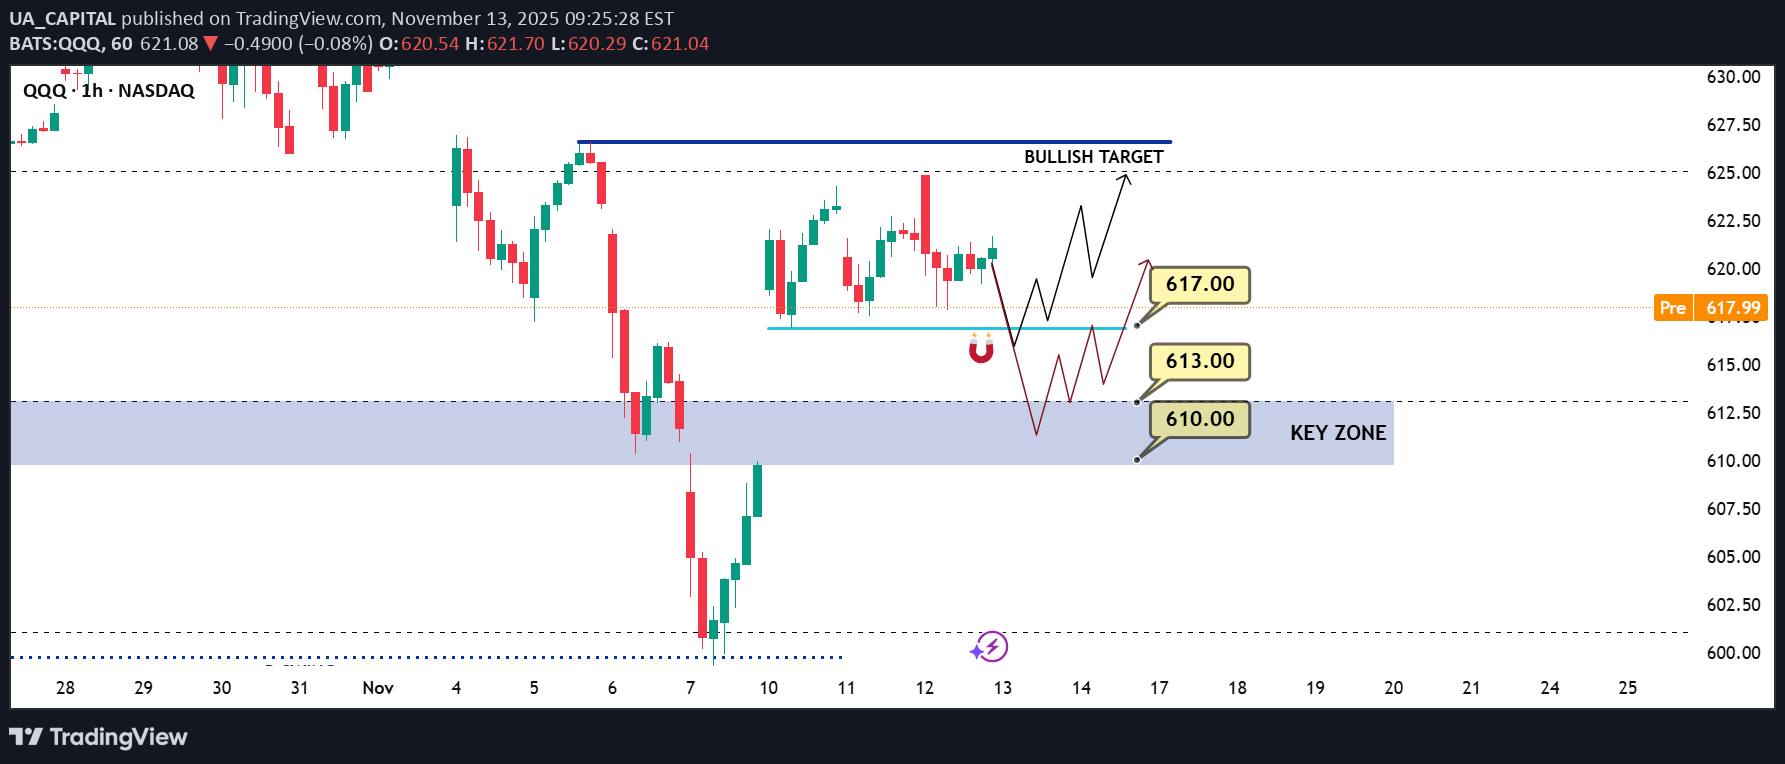
Daily QQQ (US100-NQ) Outlook - Prediction (13 NOV) 📊 Market Sentiment Market sentiment appears neutral, in my opinion. The U.S. government is expected to reopen soon; however, officials have decided not to release previous economic data. This creates uncertainty for traders without key data, it becomes difficult to anticipate the FED’s next policy decision. 📈 Technical Analysis QQQ experienced a range-bound session yesterday, while the Dow Jones carried most of the market’s momentum. Compared to SPY, QQQ showed more weakness throughout the session. However, the higher-timeframe structure remains bullish, and I will continue following that bias. 📌 Game Plan Scenario 1: Price may dip to the 616–617 zone and bounce from there, returning to the 621–623 range. Scenario 2: If price breaks 617 aggressively, it may retrace toward 613 before bouncing back into the 620–625 zone. In my opinion, calls may work better on SPY today, while puts could perform better on QQQ. 💬 For detailed insights and broader market context, please check my Substack link in profile. ⚠️ For educational purposes only. This is not financial advice.It went perfectly as planned. Tapped 613 and returned to the 617 range the whole move played out in just 45 minutes.
Disclaimer
Any content and materials included in Sahmeto's website and official communication channels are a compilation of personal opinions and analyses and are not binding. They do not constitute any recommendation for buying, selling, entering or exiting the stock market and cryptocurrency market. Also, all news and analyses included in the website and channels are merely republished information from official and unofficial domestic and foreign sources, and it is obvious that users of the said content are responsible for following up and ensuring the authenticity and accuracy of the materials. Therefore, while disclaiming responsibility, it is declared that the responsibility for any decision-making, action, and potential profit and loss in the capital market and cryptocurrency market lies with the trader.