
TrendShot
@t_TrendShot

What symbols does the trader recommend buying?
Purchase History
پیام های تریدر
Filter
TrendShot
LINKUSD – Bullish Impulse Toward D-Point Target

LINKUSDT: Title: LINKUSD – Bullish Impulse Toward D-Point Target Price action has completed a corrective ABC structure, finding strong support at point C. The current breakout above mid-structure resistance confirms bullish momentum, aiming toward the D-point completion. Risk is managed below the breakout zone, with potential for trend continuation if price sustains above local support. Risk Management Notes: – Entry aligned with breakout confirmation – Stop-loss below structural support (C-area) – Take-profit near projected D-point completion
TrendShot
Reversal from Channel Bottom or a Real Breakdown? Identifying th

🎯 BTCUSDT - Analysis 🔹 Analysis Date: 1 August 2025 📉BTCUSDT: Price is currently moving inside an ascending channel and has touched the bottom of the channel again, offering a potential buy opportunity. However, for those seeking a low-risk entry, the zone around 118,000 could be ideal—if price returns to the channel and confirms support. Although it seems the channel’s lower boundary might break, this could be a fake break to mislead traders before a rebound. The support at 110,000 is a crucial short-term level; if it fails, a deeper correction toward 98,090 or even 94,000 is likely. Our targets remain at the upper boundary of the channel. ⚠️ Risk Management Tip: Wait for confirmation near 118,000 if unsure, and always size positions based on overall volatility.
TrendShot
Time to Peel Some Gains — BananaUSDT Ripening at the Midline
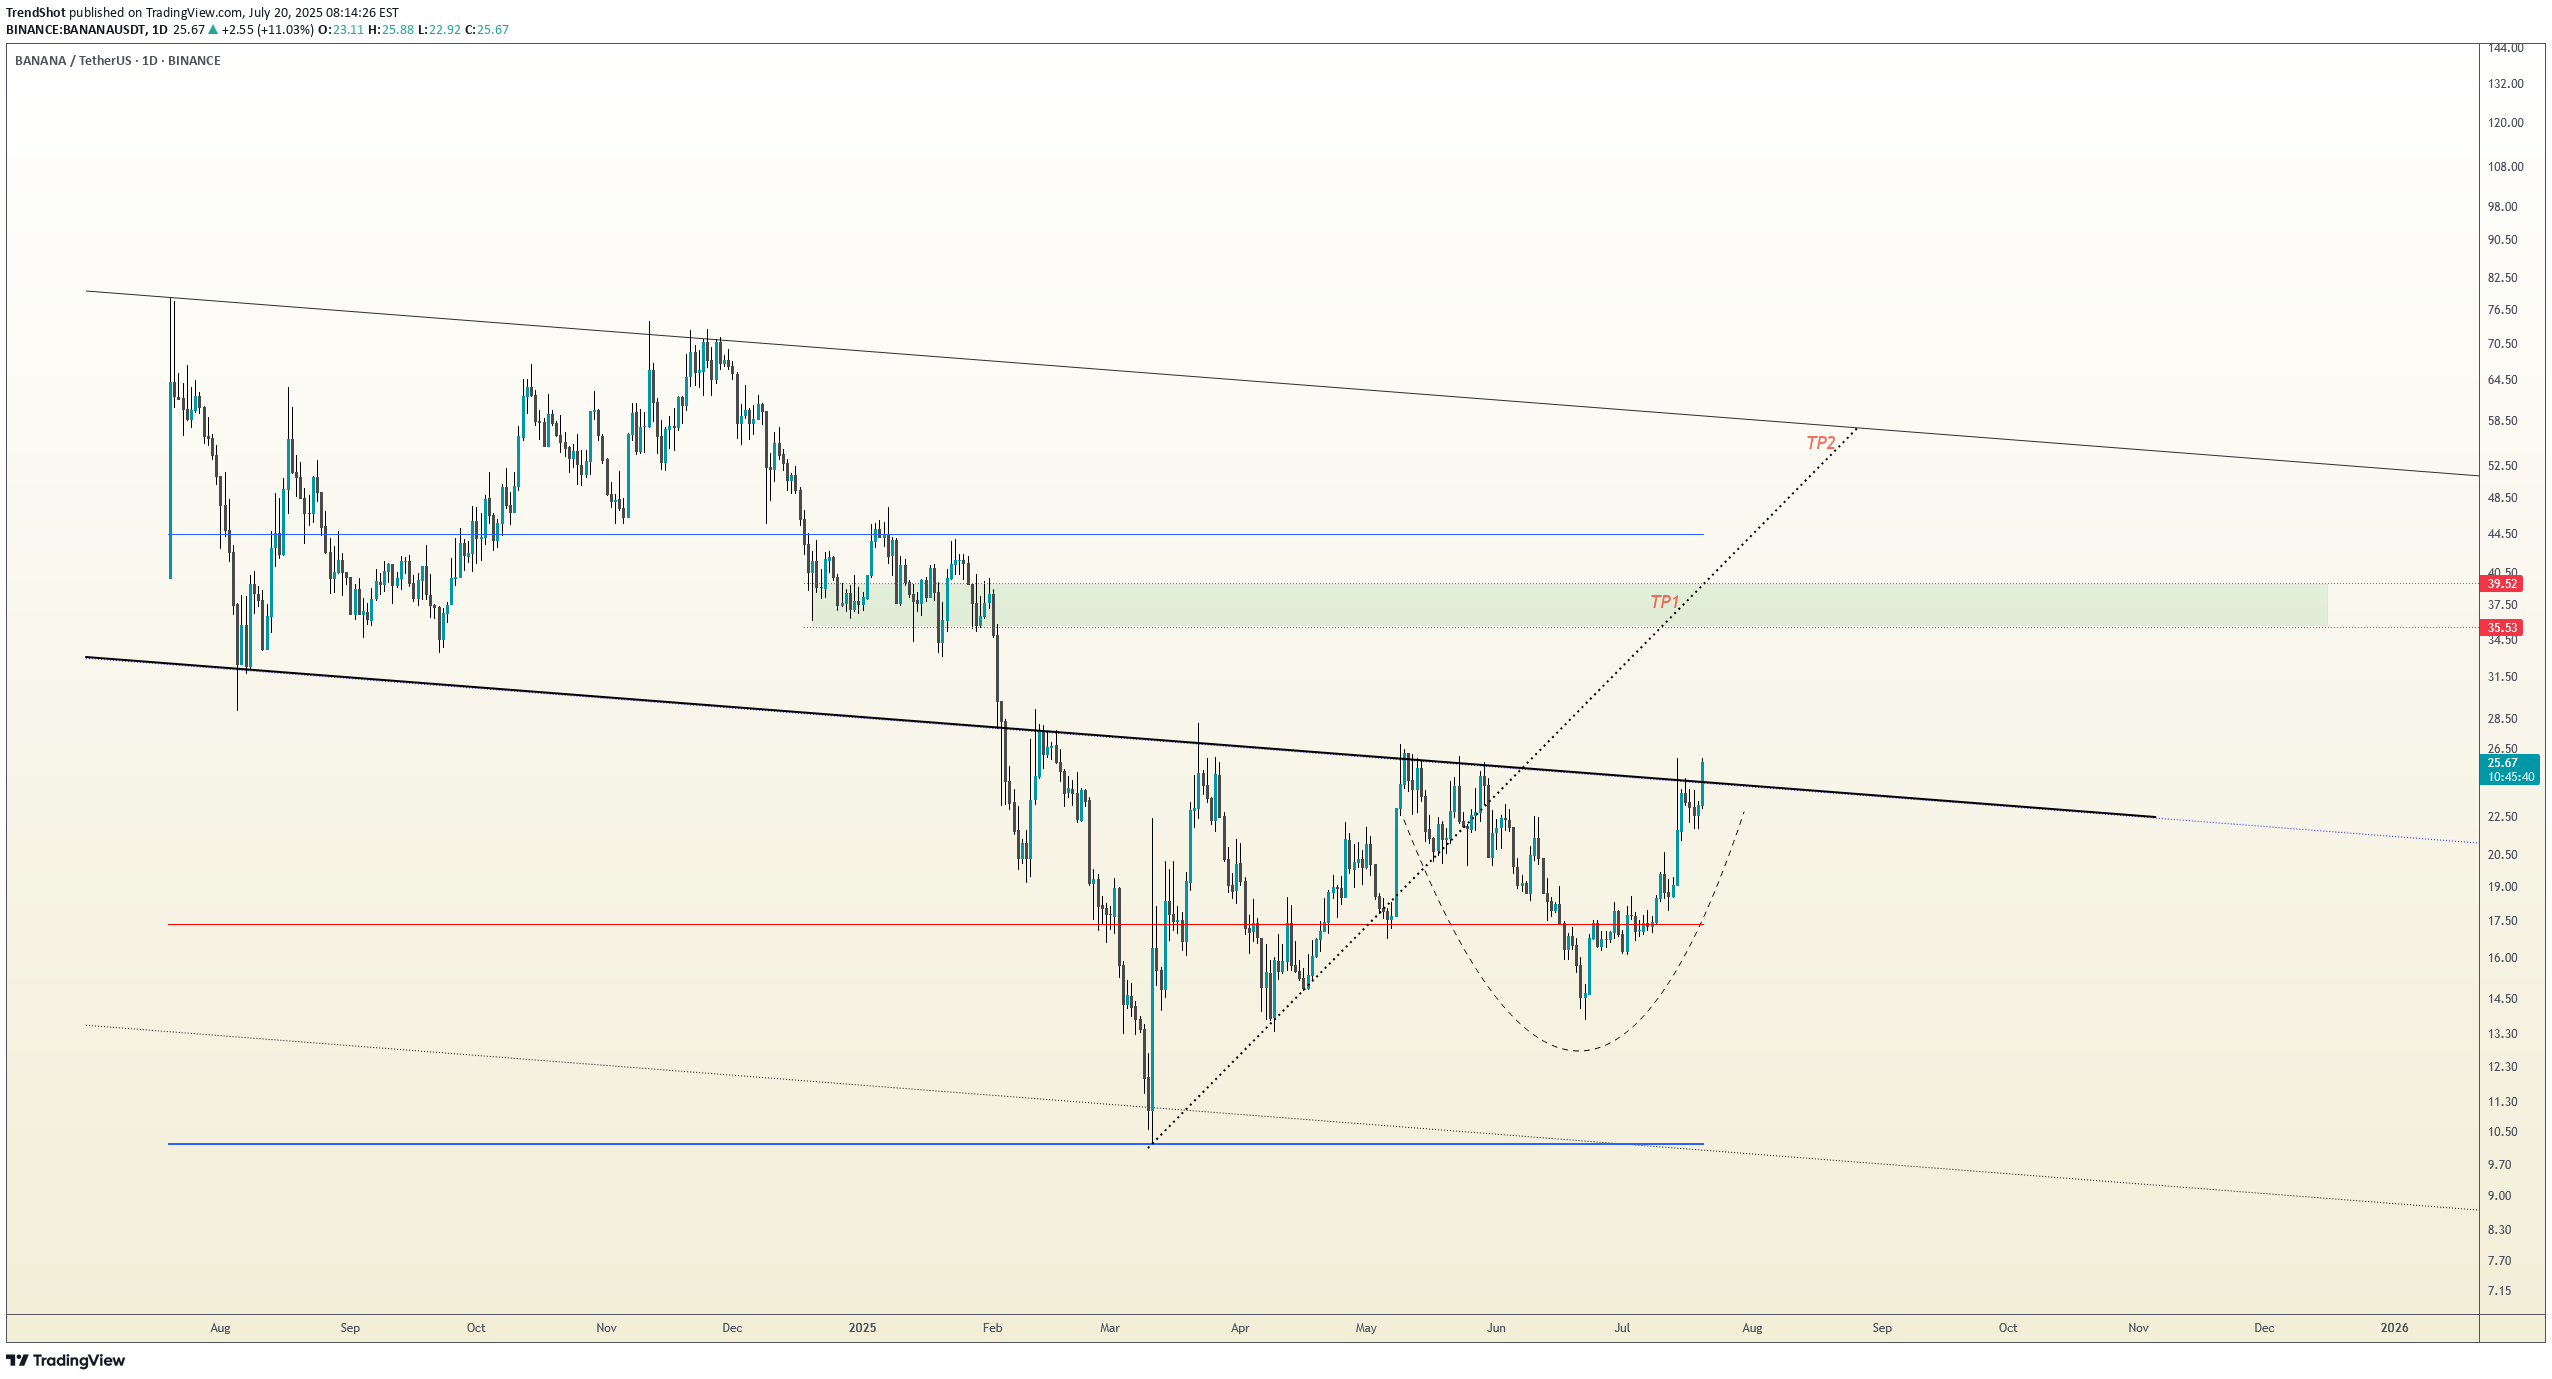
📈 Technical Overview: BananaUSDT is currently testing the midline of the descending channel. A confirmed breakout above this level could trigger a bullish move toward the top of the channel, which aligns with our secondary target. Until the breakout is validated, the price may continue to range within the current structure. 🔸 Watchlist Status: Setup is not confirmed yet — keep this on your watchlist and wait for a clear breakout above the midline. 📍 Next resistance: Top of the channel 📍 Invalidation: Rejection at midline or breakdown below recent support 📉 Risk Management: Enter only after confirmation, and risk no more than 1% of your capital. Always define your stop-loss.
TrendShot
Notcoin and the Butterfly Effect
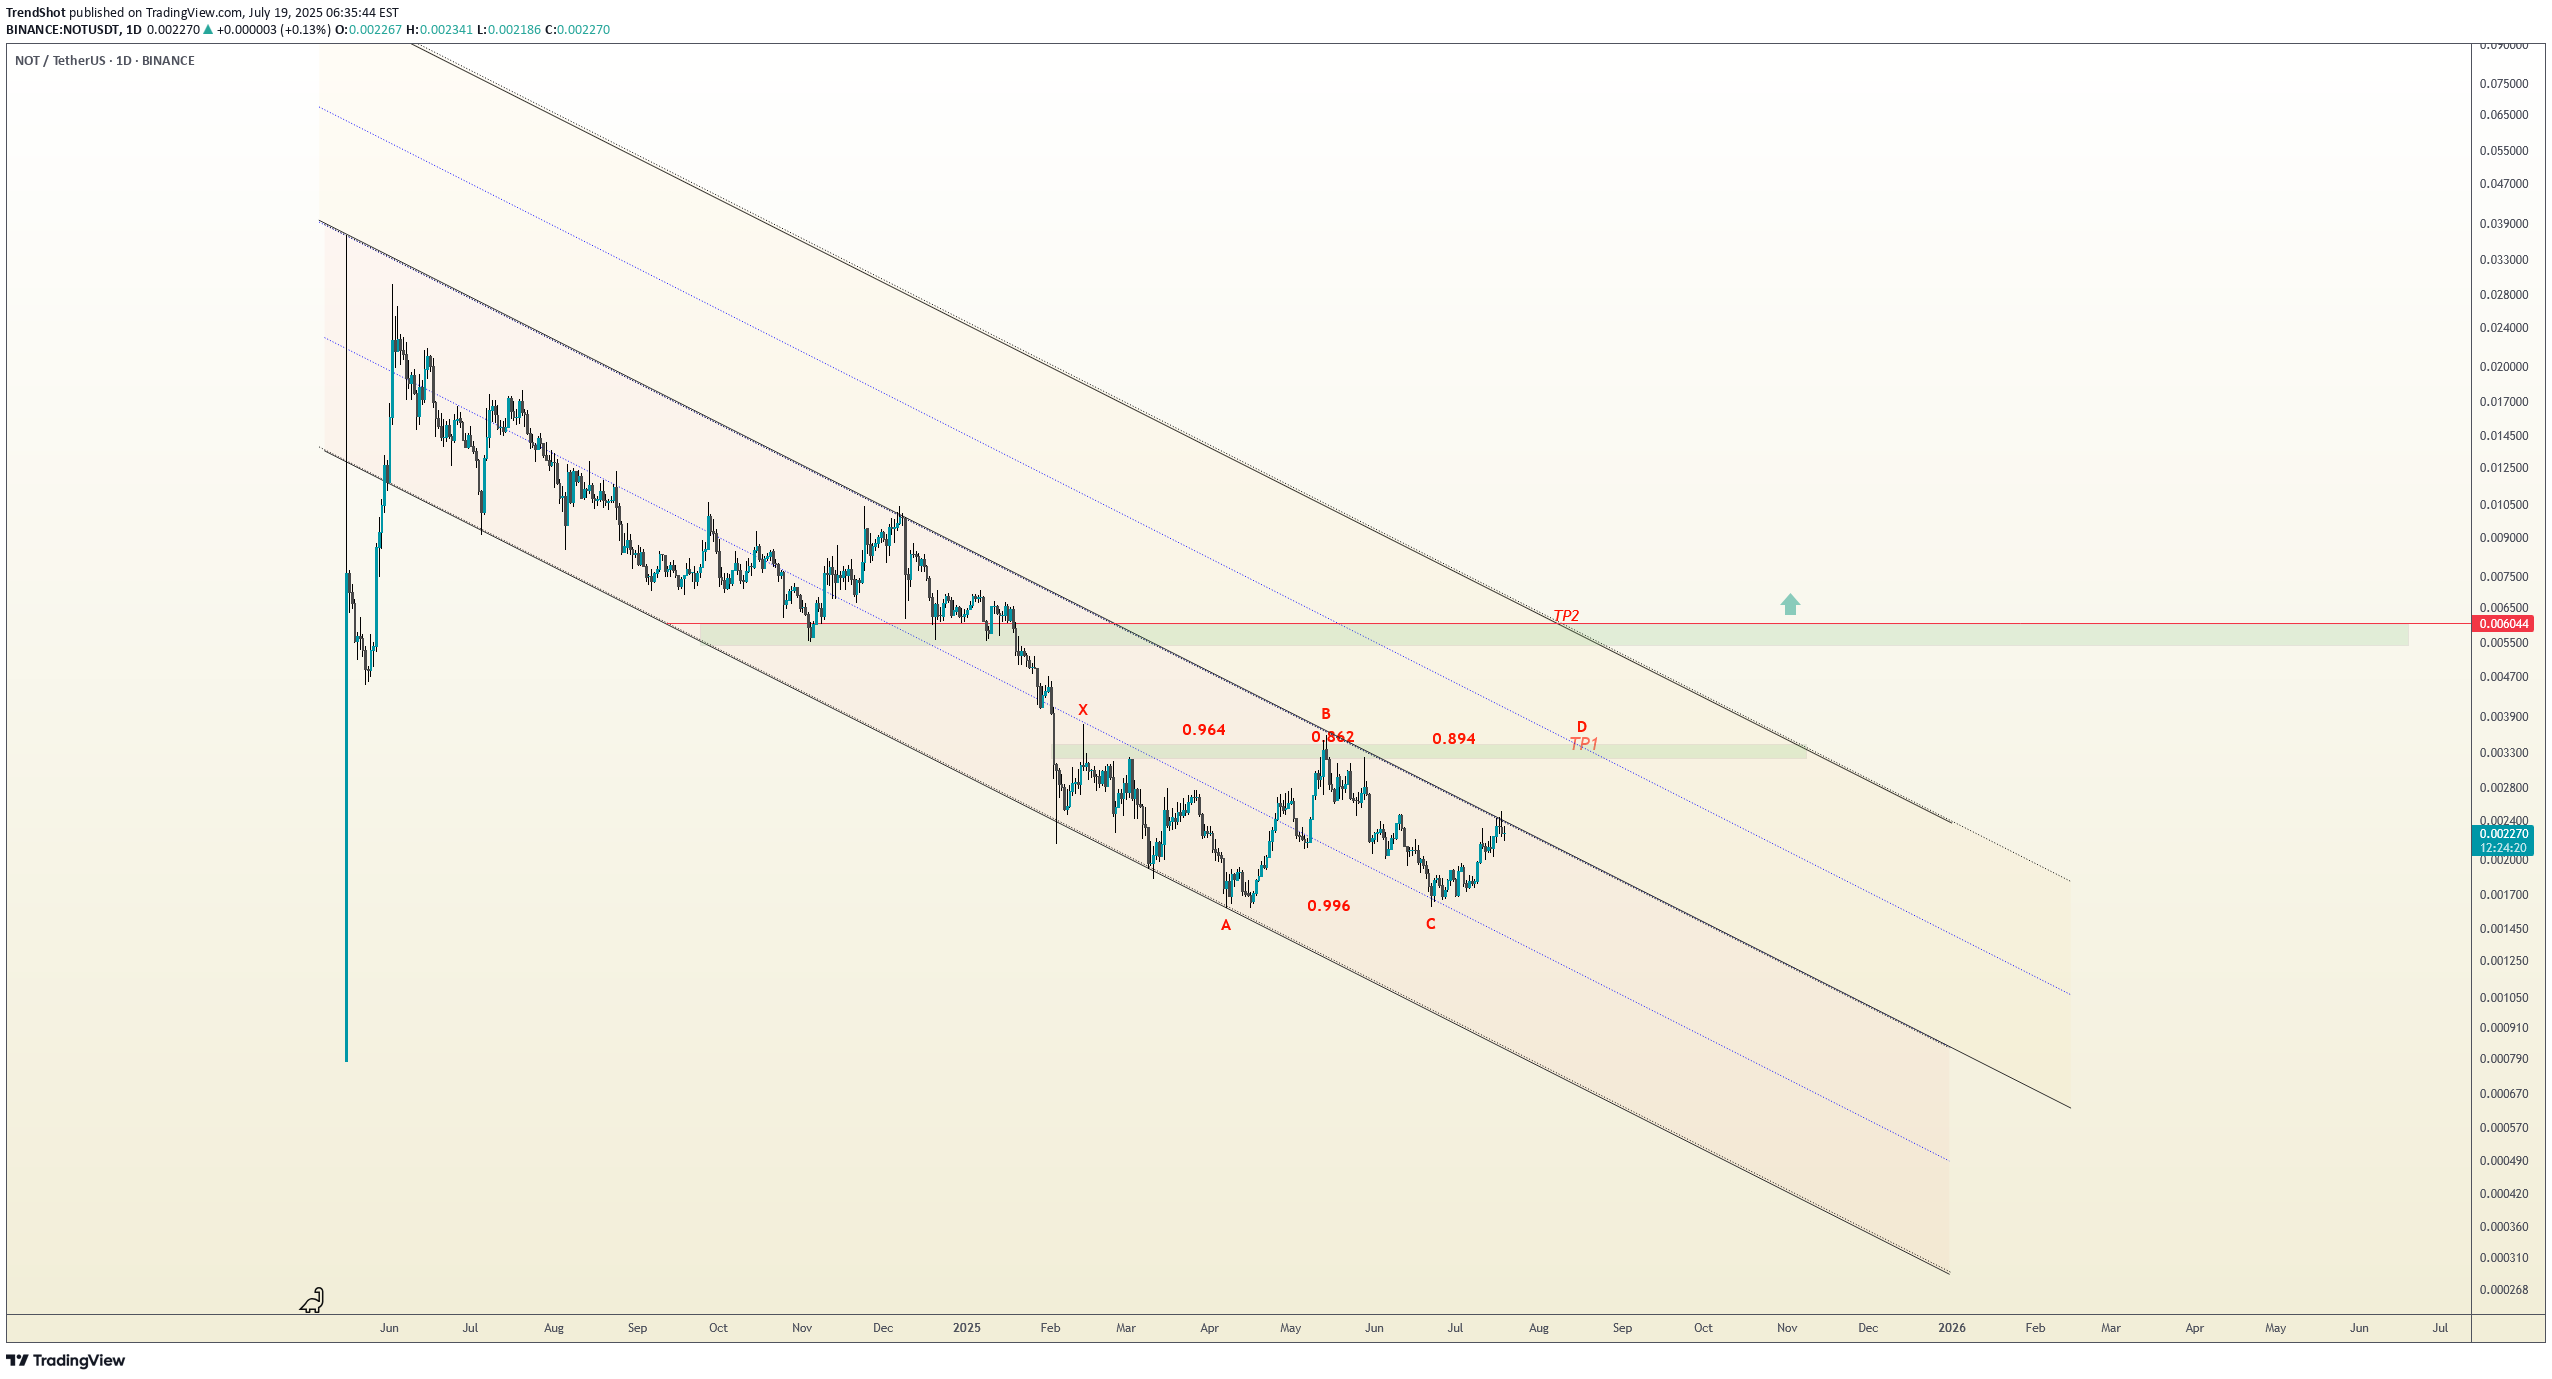
🦋 Bullish Butterfly Pattern Forming | NOTUSDT Analysis A potential Bullish Butterfly is unfolding on NOTUSDT: X to A: initial decline A to B: ~94.3% retracement B to C: higher low at ~99.6% C to D: projected bullish leg toward 0.00327 (127.8% Fib), aligning with midline of the yellow descending channel The price is currently testing the top of the red descending channel. If bullish momentum holds and this upper boundary breaks, we anticipate a continuation toward point D, and potentially toward 0.006044, the upper yellow channel — a highly critical resistance. A breakout and close above this level may trigger the beginning of a major bullish trend. 🔸 Risk Management: • Consider partial profit-taking near the midline of the yellow channel • Trail stop-loss as the price nears point D • Use only 1% of capital per position ⚠️ Key Note: • If price breaks below point C, this bullish butterfly setup becomes invalidThe chart should be checked — the move might start from here.
TrendShot
Perfect Sync: V Reversal Meets Bull Flag
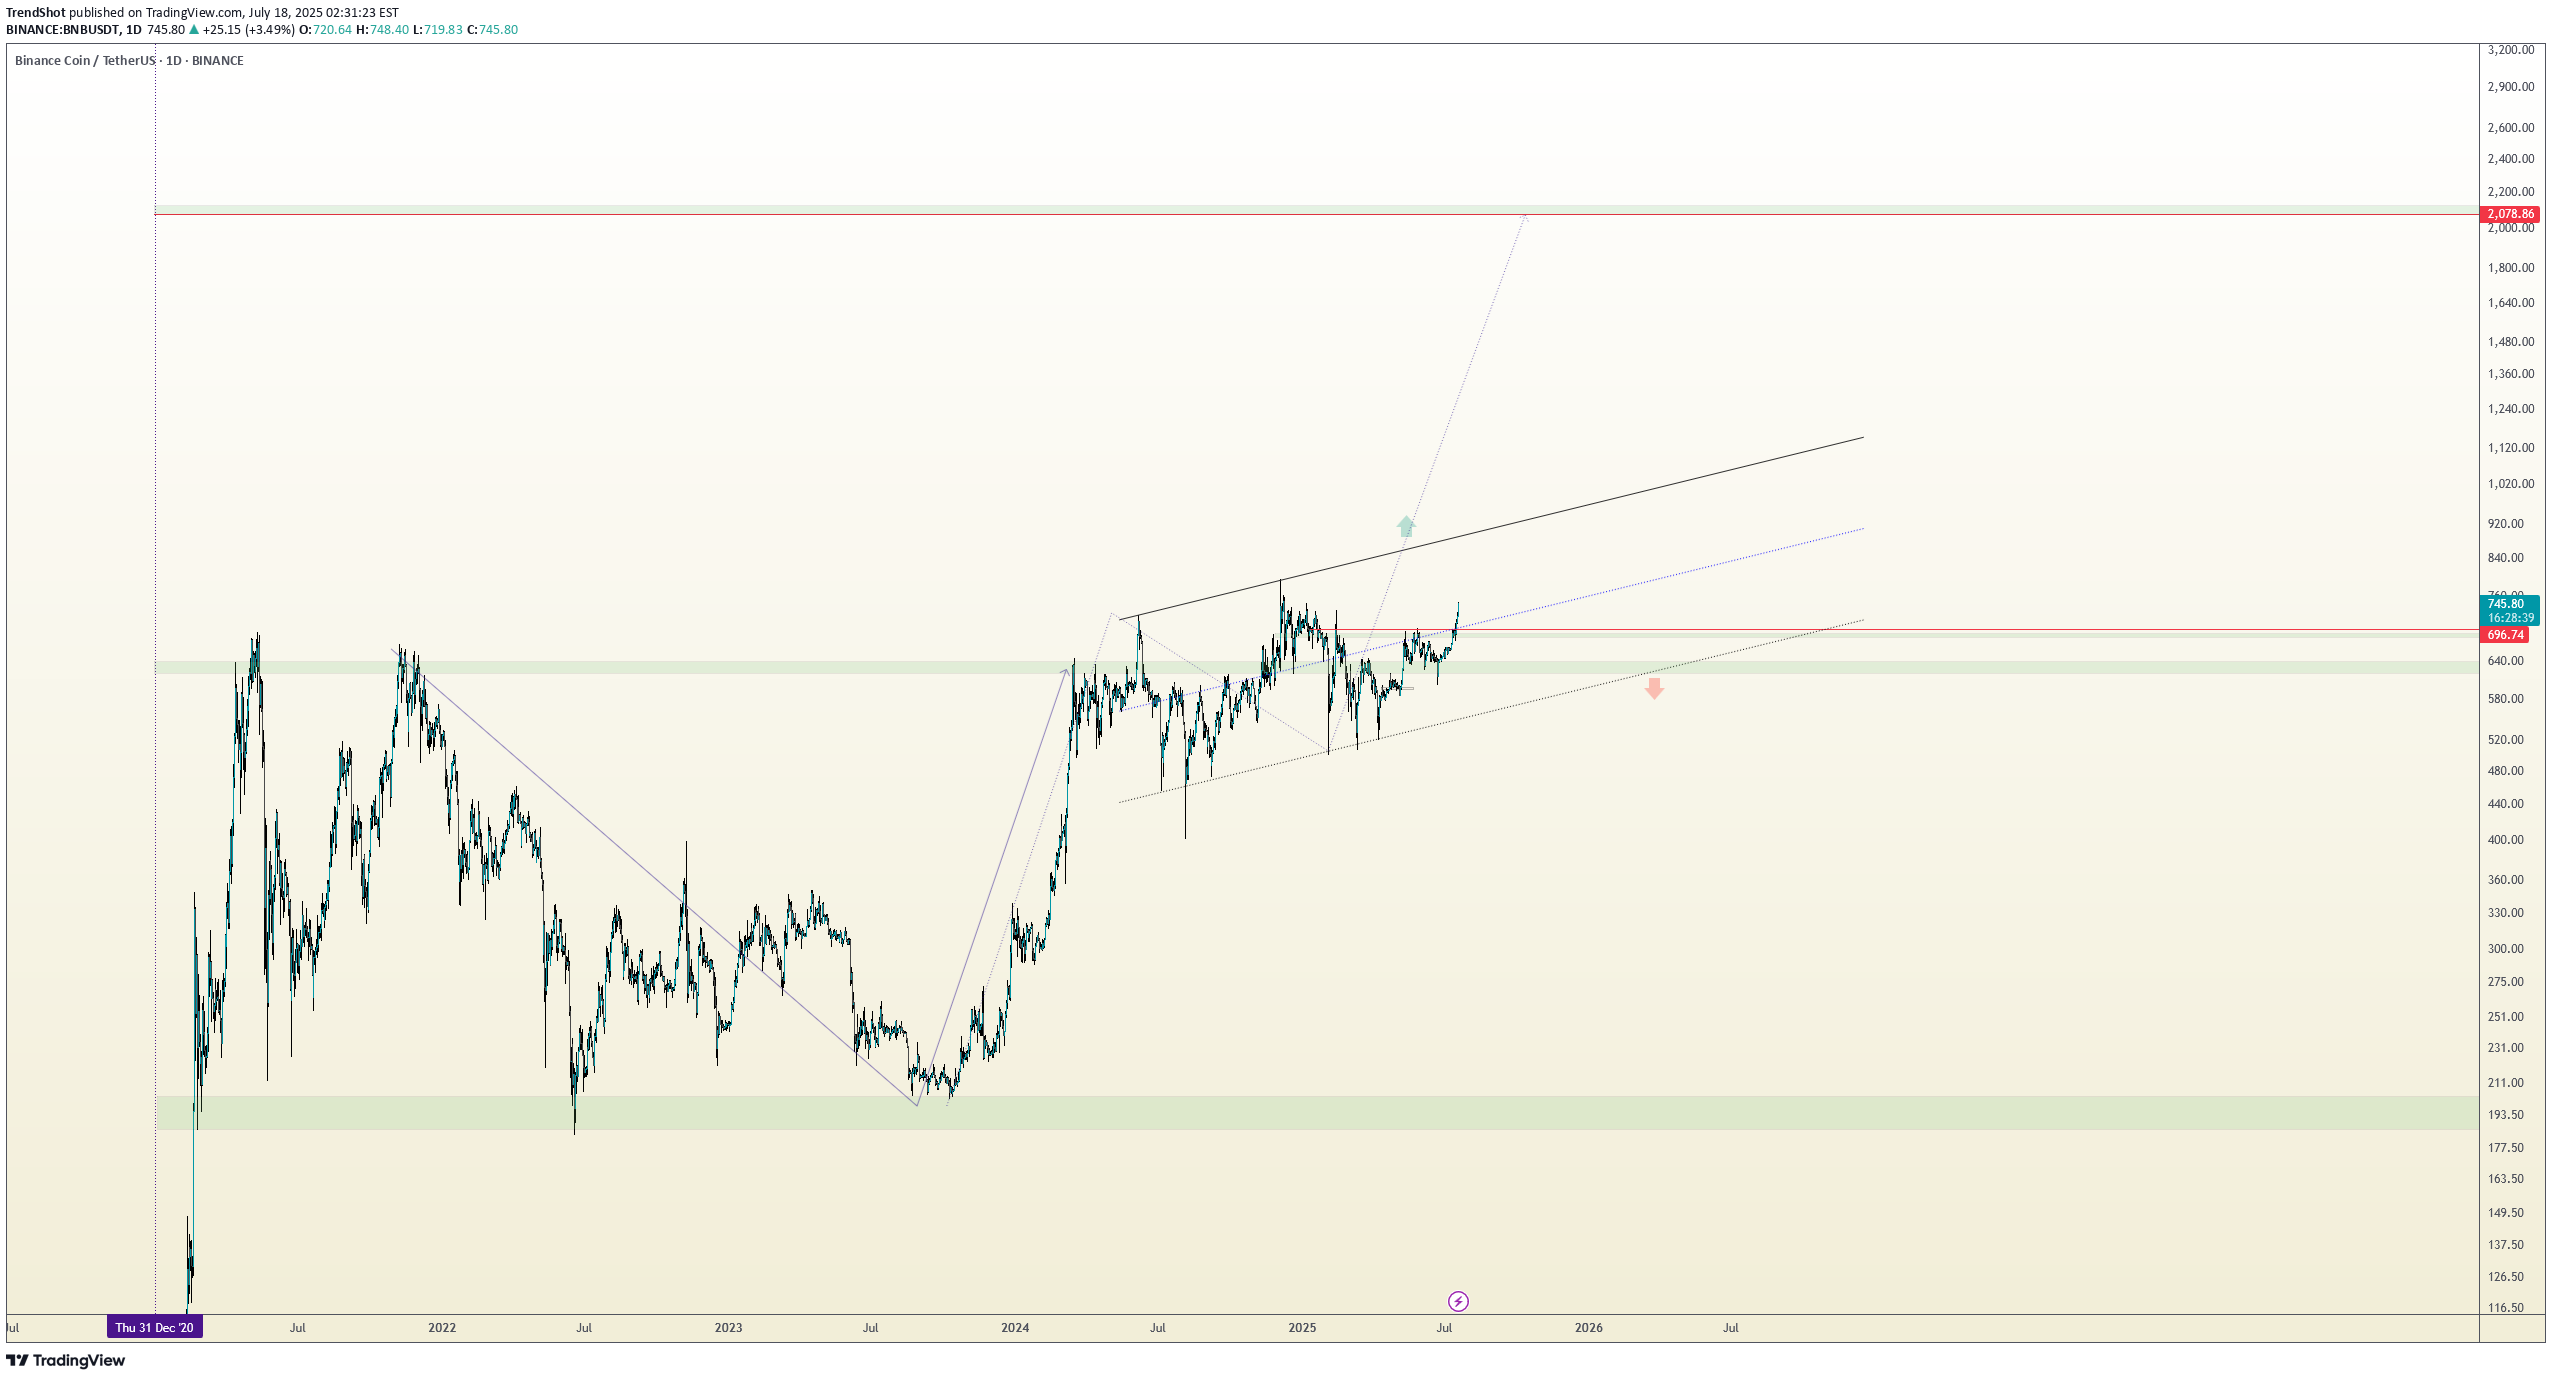
Two clean and classic technical structures: ✅ V-Reversal Formation ✅ Bull Flag – still active and building pressure After a sharp reversal, the price entered a bullish continuation phase. Currently moving within the flag structure toward its upper edge. If we see a breakout to the upside, the move could match the flagpole length, which aligns well with the target from the V-reversal pattern. 📍 Bullish scenario remains valid as long as we stay within structure. 📉 Breakdown below $570 invalidates this setup. 🧠 Important Reminder: Enter only after a confirmed breakout. ✅ Apply strict risk management ✅ Never risk more than 1% of your capital on a single position. Everything’s clear. No noise. Just wait for confirmation — let the market come to you.📍 We’re currently at the top of the channel, This is a key decision point — we can: Secure partial profits at resistance Trail the stop-loss below recent structure Withdraw initial capital and let the profits ride It’s all about managing risk while locking in gains.
TrendShot
The Loudmouth Pattern: It Yells, We Trade!
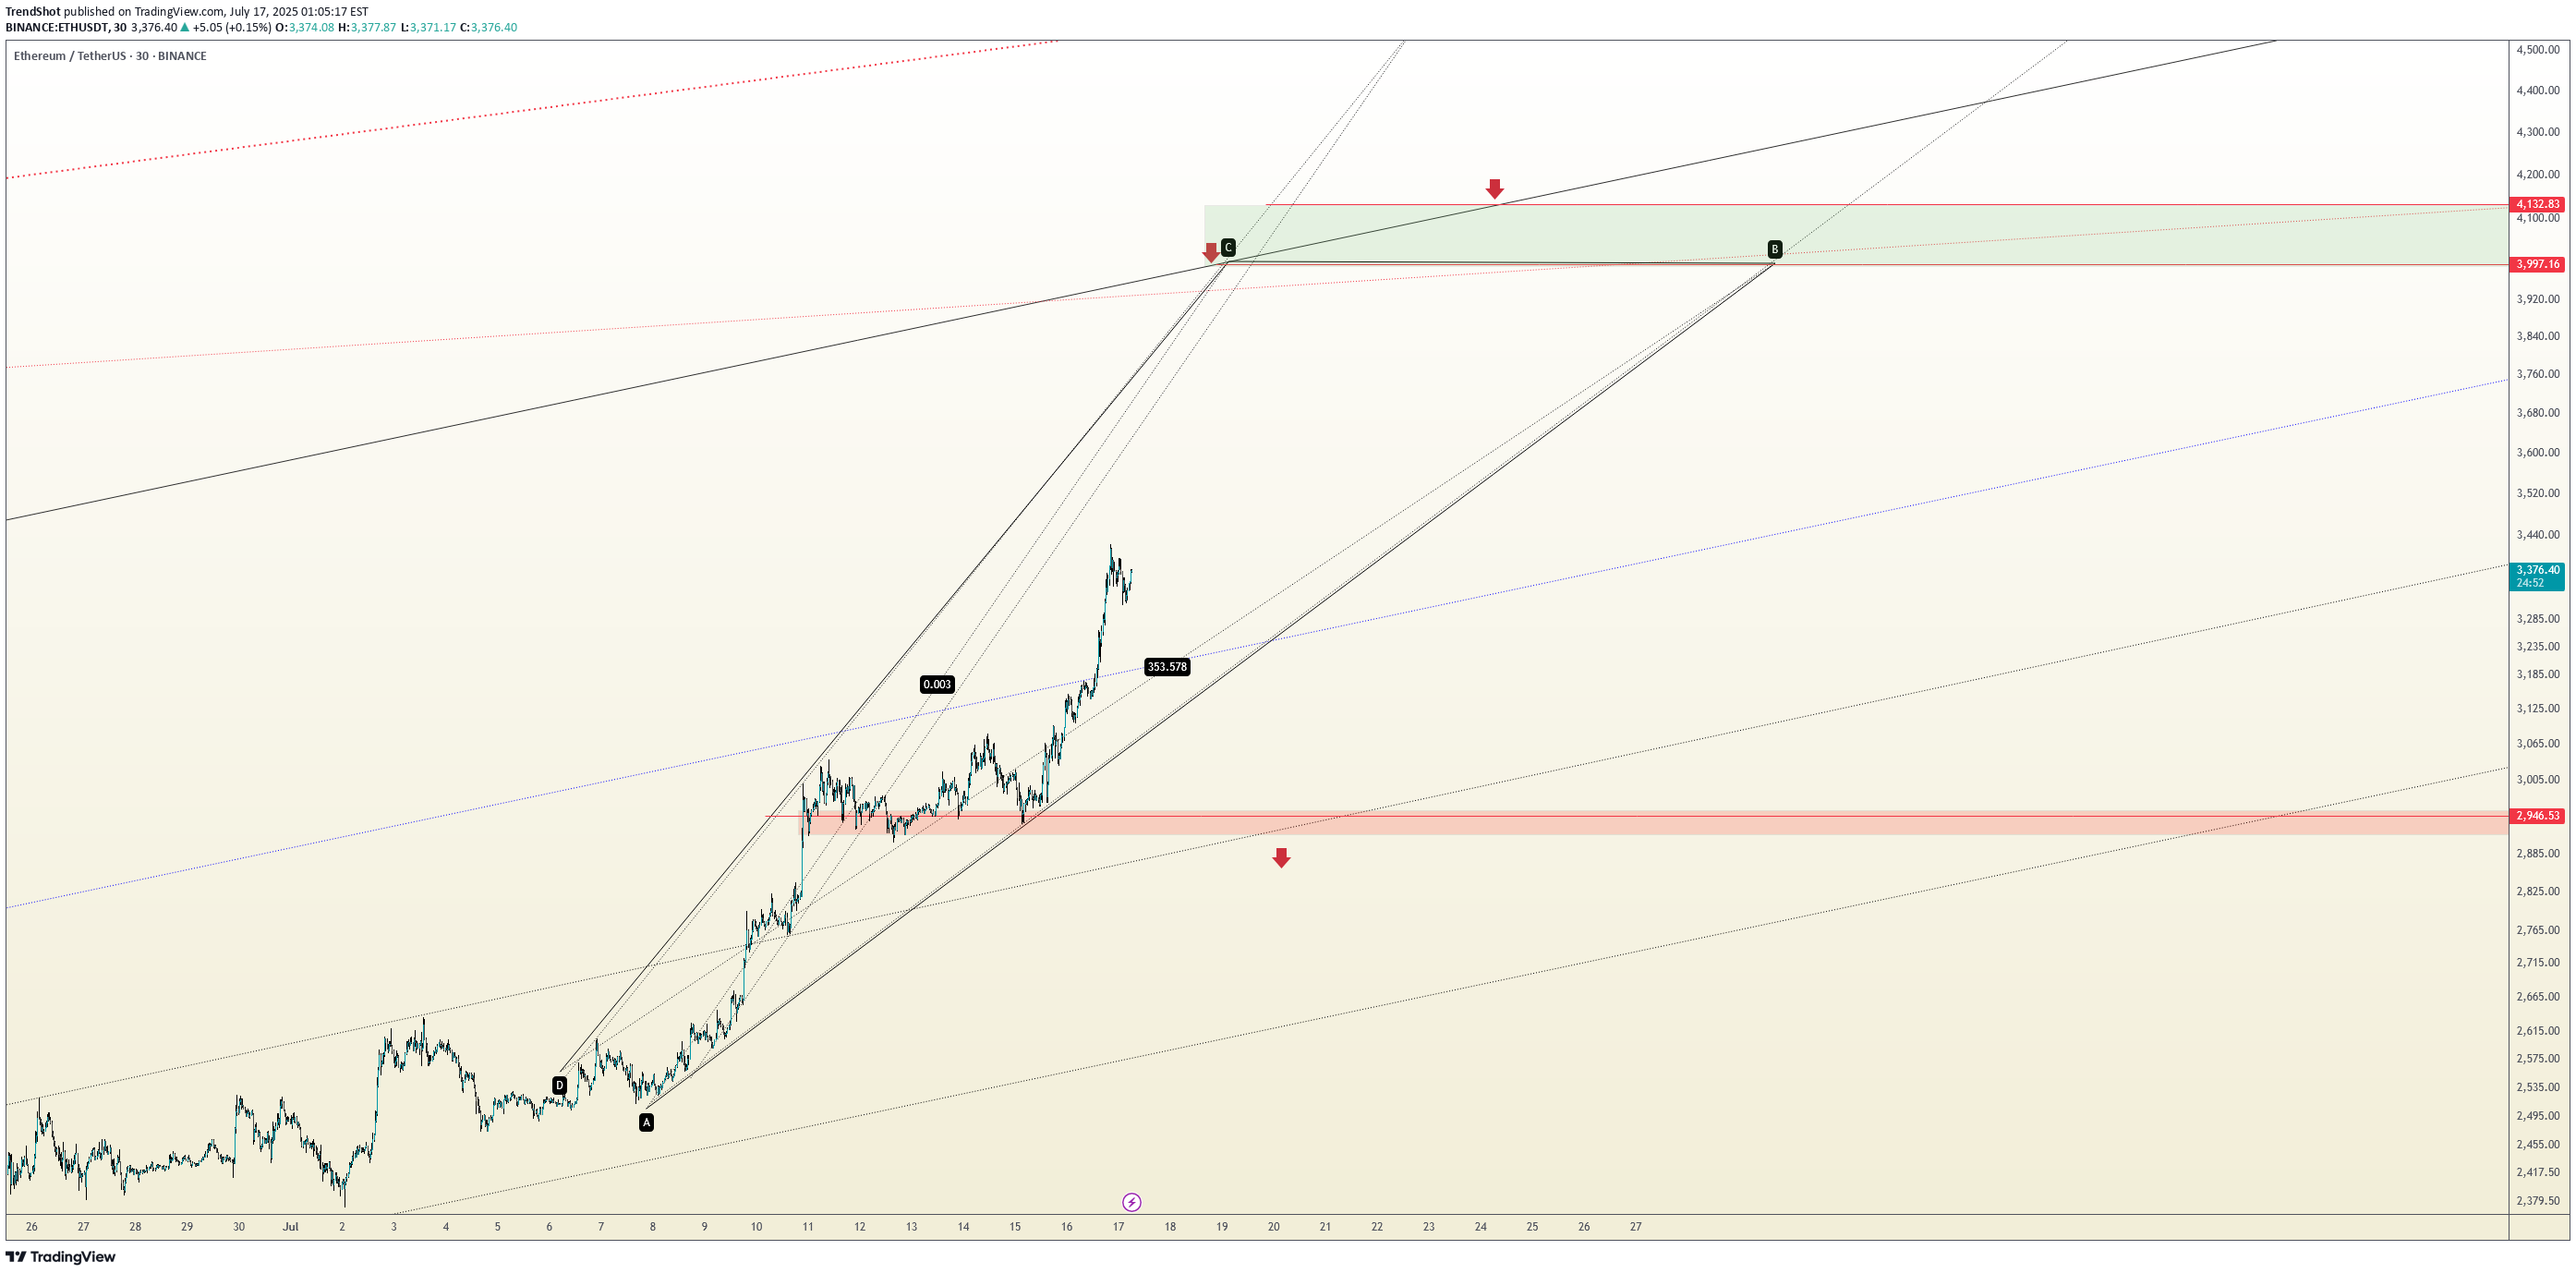
On the 30-minute chart, ETH is forming a classic Broadening Formation – or as some traders like to call it, “The Big Mouth Pattern” 😄. It’s noisy, unpredictable at first glance, but when it speaks, you’d better listen. Right now, price is moving through the bullish leg of this setup, and if momentum holds, we’re eyeing the $4,000 psychological level, followed by the $4,120 – $4,170 supply zone. 🔹 Bullish Scenario (our expected outlook): 🎯 Target 1: $4,000 🟩 Main Resistance: $4,120 – $4,170 ❌ Invalidation: Confirmed close below $2,946 If price breaks and holds below that red support zone, this setup gets thrown out the window. 📊 Risk Management: Scale in on pullbacks – if structure remains valid No chasing without confirmation Keep risk under 1% of total capital 📈 The market’s big mouth is open – and until it closes below $2,946, we’re listening for bullish signals. 🤑Take partial or full profits, Secure gains by trailing your stop-loss, Or simply lock in your current profits and let the rest ride toward higher targets.
TrendShot
SOL/USDT Technical Outlook – Breakout Holding, Eyes on 175+

Solana has successfully broken above the key resistance zone at $155–157 and is currently testing it as new support. If the level holds, this breakout could extend toward the next major target around $175–178. 📌 Key Insights: Clean breakout followed by a potential SR flip Watch for confirmation of support before continuation Target aligns with previous swing high Invalidated on breakdown below reclaimed level 🟢 Bias remains bullish as long as price holds above the breakout zone. A confirmed retest could provide a high-probability long setup.👉 If you're not highly risk-tolerant, this could be a good area to start securing profits. You may consider partially closing your position or at least trailing your stop-loss upward to lock in gains while keeping exposure to further upside.
TrendShot
Wings of Opportunity: LINK’s Harmonic Setup Unfolding

🦋 Title: A Butterfly on the Edge – But Only with Confirmation On the 2H timeframe, a Bullish Butterfly Harmonic Pattern is unfolding. The wave structure (X → A → B → C → D) aligns closely with harmonic principles, and point D lies above X, within the 1.27 to 1.618 Fibonacci extension of XA — reinforcing the pattern’s validity. 📌 No entry has been triggered yet. We are currently waiting for price to break and hold above the key resistance at 13.60 to confirm the bullish scenario. 🔹 Bullish Scenario (our primary and preferred outlook): Given the strong reaction around the 12.74 demand zone and the harmonic structure completion, we are primarily focused on a long opportunity, if and only if confirmation is achieved above 13.60. 📥 Entry Zone: 13.05 – 13.65 🎯 Target 1: 17.94 🎯 Target 2: 18.76 🛑 Stop-Loss: Below 12.74 (structural invalidation) 🔻 Alternative Bearish Scenario: If price fails to break 13.60 and instead loses the 12.74 support, the bullish setup becomes invalid, and the market could enter a deeper correction phase. Potential downside targets in that case: 📉 11.80 📉 10.90 – 10.30 (if bearish momentum continues) 📊 Risk Management Notes: Position sizing should not exceed 1% of total capital Avoid early entries before confirmation Prefer partial entries after breakout and retest Stick to the invalidation level strictly 📈 While both scenarios are on the table, we are currently favoring the bullish setup, as long as price action supports it. Discipline and patience are key — confirmation first, trade second.👉 LINK is playing out as anticipated and the Butterfly pattern is completing beautifully. At this stage, if you're not comfortable with higher risk, you can: Take partial or full profits, Secure gains by trailing your stop-loss, Or simply lock in your current profits and let the rest ride toward higher targets. This is a key decision zone — manage your position according to your risk profile. 📊✅
TrendShot
The Critical Blue Line – Will Bitcoin Soar or Sink

🔹 Bitcoin Technical Analysis – Key Blue Line, Bear Trap Possibility & Long-Term Scenario On the Bitcoin chart, the blue horizontal level has acted multiple times as both support and resistance. The price has broken it several times but failed to sustain above, indicating high-volume decision-making zones by institutions and large players. 📉 Why this pattern keeps repeating: Strong supply and demand concentration at this level. Inability to break and hold shows market indecision. Repeated fakeouts are likely used to shake out weak hands. 🔍 Important hidden scenario: Bear Trap Potential If the price dips below the blue line but quickly reclaims it, it may form a bear trap, tricking short sellers into entering prematurely. This move could ignite strong bullish momentum from trapped sellers and renewed buyers. 🔮 If price holds above the blue line: Signals market strength and potential bullish structure shift. Targets: 109,800 117,200 120,000+ (Long-term) 📛 If support fails again: Retracement toward the lower channel near 101,000 or lower is possible. 📊 Conclusion: This zone is one of the most critical decision points in the current market. Traders should combine volume, candlestick behavior, and confirmation signals to avoid getting trapped by fake breaks🧭 BTC Analysis – Key Support Held, Move to $117K Confirmed 🚀 BTC/USD – Daily Chart BTC respected the blue trendline support perfectly and followed through with a strong rally up to $117K, exactly as anticipated in our previous analysis. This move validates the bullish structure and confirms that buyers are still in control. Now we're watching how price behaves around current levels and preparing for the next potential leg. 📌 If you're already in a position, here are your main options: Secure partial profits at this level Adjust your stop-loss upward to protect gains Or leave your profits in the position to stay exposed to further upside if momentum continues Price action remains bullish — manage your risk accordingly and stay alert. ✅
TrendShot
TRX Approaching Cup Breakout – Market Decision Imminent

TRX/USDT – Daily Chart Analysis TRX is shaping a textbook Cup Pattern on the daily timeframe — a strong bullish continuation signal if confirmed. Price has gradually curved upward, and we are now testing the key resistance area at 0.29–0.30. 📌 Key Scenarios: 🔹 Bullish Breakout Scenario: A confirmed breakout and daily close above 0.30 would validate the cup formation and set the stage for a rally toward the next target zones at 0.35 and 0.45 — measured based on the cup’s depth. 🔹 Bearish Rejection Scenario: If the resistance holds, expect a pullback toward the midline (~0.24) for potential accumulation and base-building before the next move. 💡 Volume confirmation and breakout momentum are critical to watch here. The market is approaching a decision point. 🟢 Our directional bias remains bullish — we anticipate the breakout to occur, leading to an upward continuation. However, we’ll wait for confirmation of the breakout and completion of the pattern before entering a long position.👉 TRX has now broken through the resistance zone — the setup played out nicely. We're currently waiting for a clean pullback to the breakout level to look for a low-risk entry and ride the next bullish leg.tp 1
Disclaimer
Any content and materials included in Sahmeto's website and official communication channels are a compilation of personal opinions and analyses and are not binding. They do not constitute any recommendation for buying, selling, entering or exiting the stock market and cryptocurrency market. Also, all news and analyses included in the website and channels are merely republished information from official and unofficial domestic and foreign sources, and it is obvious that users of the said content are responsible for following up and ensuring the authenticity and accuracy of the materials. Therefore, while disclaiming responsibility, it is declared that the responsibility for any decision-making, action, and potential profit and loss in the capital market and cryptocurrency market lies with the trader.