
Trading-Addicts
@t_Trading-Addicts

What symbols does the trader recommend buying?
Purchase History
پیام های تریدر
Filter
Trading-Addicts
btcusd
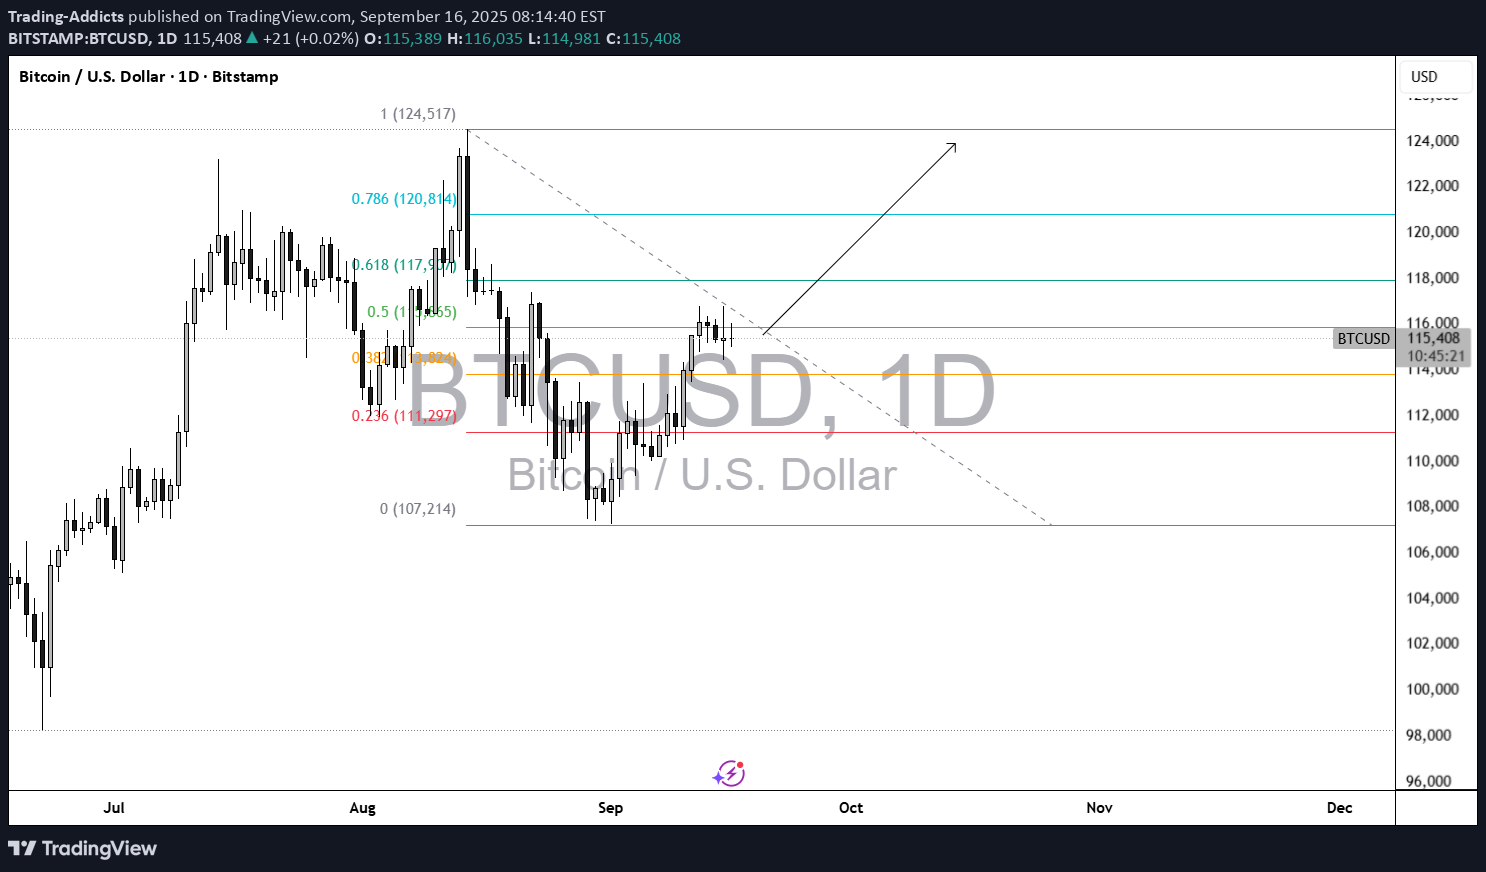
📌 Current Prices & Context BTC is trading around US$115,000-116,000 territory. 🔍 Momentum & Indicator Signals Price is holding above its EMA50 in short-/medium-term charts (4H), giving dynamic support. Economies.com +1 Some indicators are showing overbought or weakening momentum (e.g. RSI in overbought zones, some bearish divergence). Economies.com +2 DailyForex +2 The overall structure still has bullish lean, with higher lows being formed and certain demand zones being respected. TradingView +2 Babypips.com +2 🟢 Bullish Case for Longs If you’re thinking about a long trade, here’s what favors it: Price holds above $114,000-$115,000 support. That zone seems to have reliably held demand. A clear break above resistance near $117,000-$118,000 with good volume would likely open the way toward ~$120,000+ targets. The dynamic support from moving averages (EMA50, etc.) can serve as trailing stops or zones to watch for bounce entries. ⚠️ Risks / Bearish Case Things that could stop or reverse upside: If BTC drops and closes below the ~$114,000 zone, it may test lower supports near $110,000-$107,000. That would weaken the bullish structure. Resistance near $117,000-118,000 is rather strong; repeated rejections could lead to range-bound or small pullbacks. Broader macro risks: interest rate decisions, ETF flow reversals, regulatory headwinds could also impact upside. 🎯 Potential Trade Plan for Long Here’s a possible setup if you want to go long, framed as risk-reward: Entry: near support around $114,500-115,500 (if bullish signal / bounce occurs) Stop Loss: slightly below the low of the support zone, e.g. $113,000 or $112,500 depending on timeframe Take Profit / Target: near the resistance area around $118,000-120,000 (if breakout)
Trading-Addicts
BTCUSD
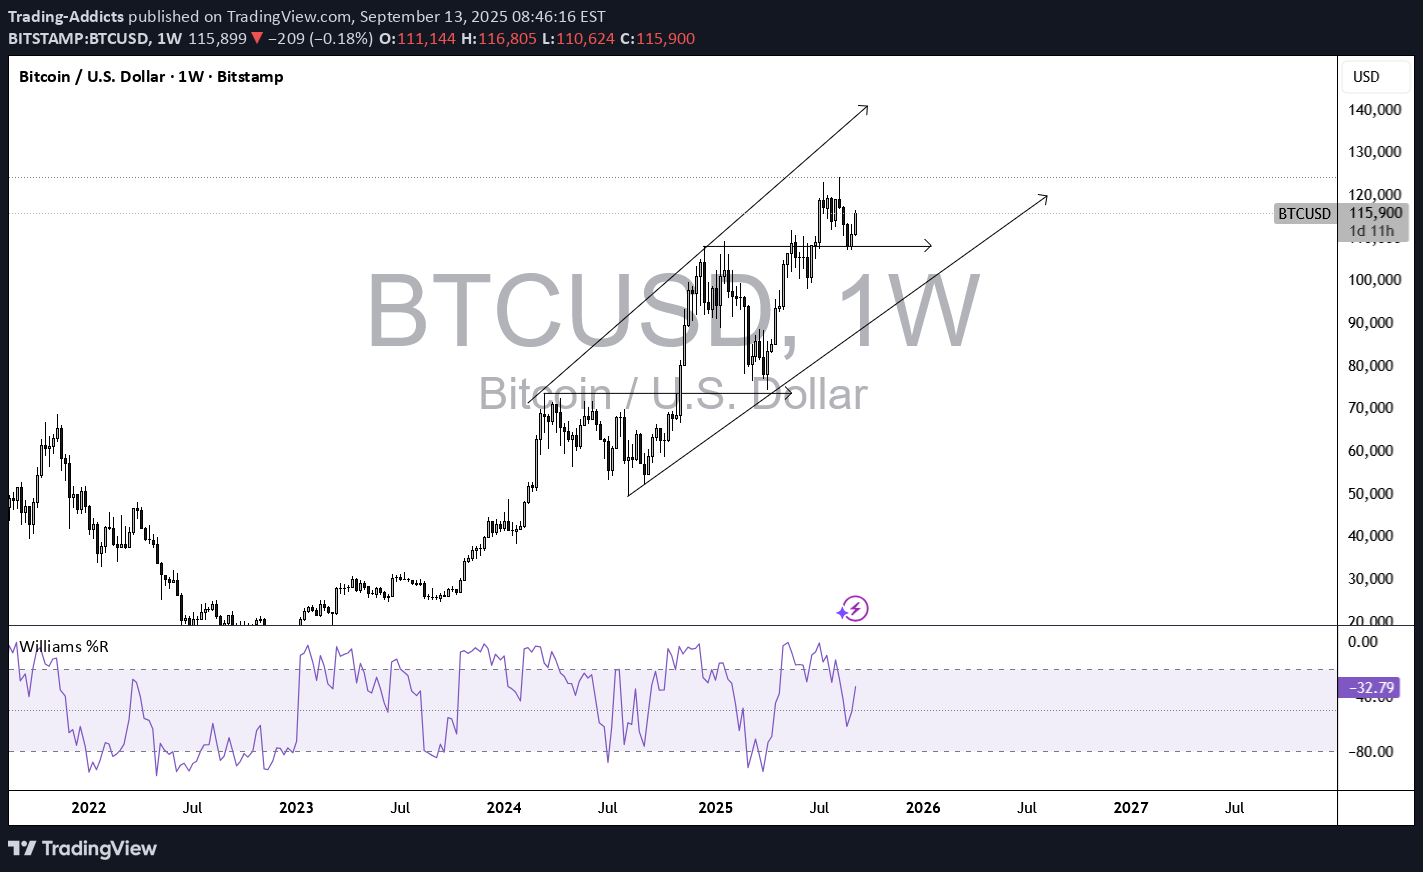
Bullish Arguments for BTC/USD Institutional adoption Bitcoin ETFs and regulated investment vehicles are attracting steady inflows, creating consistent demand. Large asset managers are gradually increasing allocations, giving BTC legitimacy in traditional finance. Macro backdrop (monetary policy) Expectations of Fed rate cuts weaken the dollar and lower bond yields, which tends to benefit alternative assets like BTC. In a low-yield environment, investors search for higher-beta assets, and BTC often rallies. Supply dynamics The halving event earlier this year reduced new supply issuance by 50%. Historically, halvings are followed by multi-month to multi-year bullish cycles, as supply shrinks while demand continues. Digital gold narrative BTC increasingly behaves as a hedge against inflation, fiscal deficits, and currency debasement. Growing central bank debt and fiat skepticism fuel interest in scarce assets. Technical structure BTC remains in a long-term uptrend with higher lows forming. Key resistance levels near recent highs are being tested; a breakout could open the way to new all-time highs. ❌ Bearish Arguments for BTC/USD Regulatory risks Governments could tighten rules on exchanges, wallets, or crypto transactions. Legal or compliance issues around stablecoins, DeFi, or taxation could weigh on sentiment. Liquidity / risk appetite In risk-off markets (stock selloffs, flight to safety), BTC often drops alongside equities. If global risk sentiment deteriorates, BTC may struggle despite long-term fundamentals. Stronger USD / higher yields If US inflation stays sticky and the Fed delays cuts, a stronger USD could hurt BTC. Rising bond yields reduce the appeal of speculative assets. Volatility & profit-taking BTC often sees sharp corrections after big rallies. Profit-taking from institutions and whales can trigger 20-30% retracements even in a bull trend. 🎯 Technical Zones to Watch Support: Around $58K–60K (short-term), deeper support near $52K–55K. Resistance: $68K–70K (recent highs); if broken, $75K+ could open as next psychological target. Trend: As long as BTC holds above $58K, the medium-term structure remains bullish. 📌 Summary Bull case: ETF inflows, halving supply shock, Fed easing expectations, and strong adoption narrative keep BTC in an upward bias. Bear case: Stronger USD, regulatory uncertainty, and profit-taking could trigger sharp but possibly temporary pullbacks. Trade approach: Buy dips into strong support zones, with stops below major swing lows. Upside targets include retests of highs and potential new all-time highs if momentum continues.
Trading-Addicts
xauusd
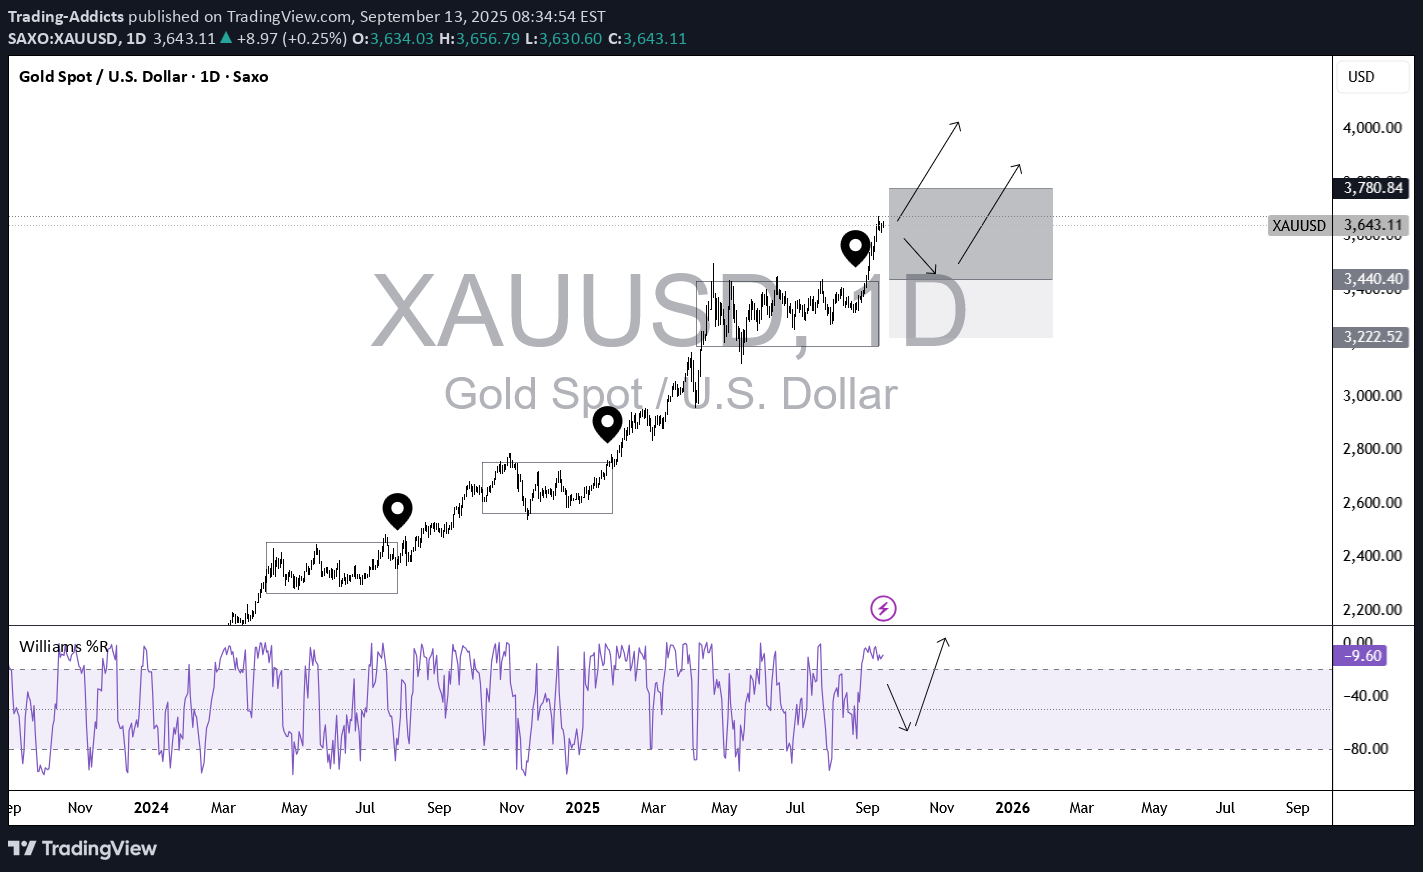
Reasons to Buy Gold: Fed policy & interest rates Markets expect the Federal Reserve to cut rates within the coming quarters. Lower rates weaken the dollar and reduce yields on US bonds, which makes gold more attractive. Even if cuts are not immediate, the anticipation alone supports gold buying as investors hedge against future USD weakness. Inflation & real yields Even with some moderation, inflation remains sticky in parts of the global economy. Gold is a classic inflation hedge. If real yields (yields adjusted for inflation) fall, gold tends to benefit because the opportunity cost of holding it decreases. Central bank demand Central banks around the world continue to add gold to their reserves as a way to diversify away from the dollar. This steady demand provides a structural tailwind for gold prices. Safe-haven appeal In times of geopolitical tension, economic uncertainty, or equity market volatility, investors often shift into gold. With risks around fiscal deficits, trade tensions, and global conflicts, safe-haven flows could intensify. Technical momentum Gold has broken above key resistance levels in recent months, signaling bullish momentum. Pullbacks have found strong support, suggesting buyers step in on dips. This reinforces the case for trend continuation to the upside. Weaker USD outlook If US data softens (e.g., slower jobs growth, weaker consumer spending), the dollar could weaken further. A softer dollar almost always supports gold since it becomes cheaper for non-USD buyers. ⚠ Risks to a Long Gold Position If US inflation unexpectedly spikes and the Fed turns more hawkish, the dollar could strengthen and gold could fall. Strong US economic growth could reduce demand for safe havens. A major risk-on environment (e.g., global equities surging) might drain flows out of gold. If gold fails to hold support levels after such a strong rally, it could trigger sharp profit-taking. 🎯 Trading Considerations Entry: Buying dips into support levels, rather than chasing highs, can improve risk-reward. Stop-loss: Place below recent swing lows or key support zones to protect against sudden drops. Targets: Near-term upside could retest recent highs; if momentum continues, longer-term targets can extend significantly higher. Catalysts to watch: US CPI/PPI, Fed meetings, global risk events, and central bank purchase data
Trading-Addicts
#bnbusd

sellers getting weak good rrr use it with your own riskeveryone questioned this trade but here we are
Trading-Addicts
#btcusd

-strong uptrend -deep pullback -good risk reward ratios24% mmm not bad haha
Trading-Addicts
#btcusd
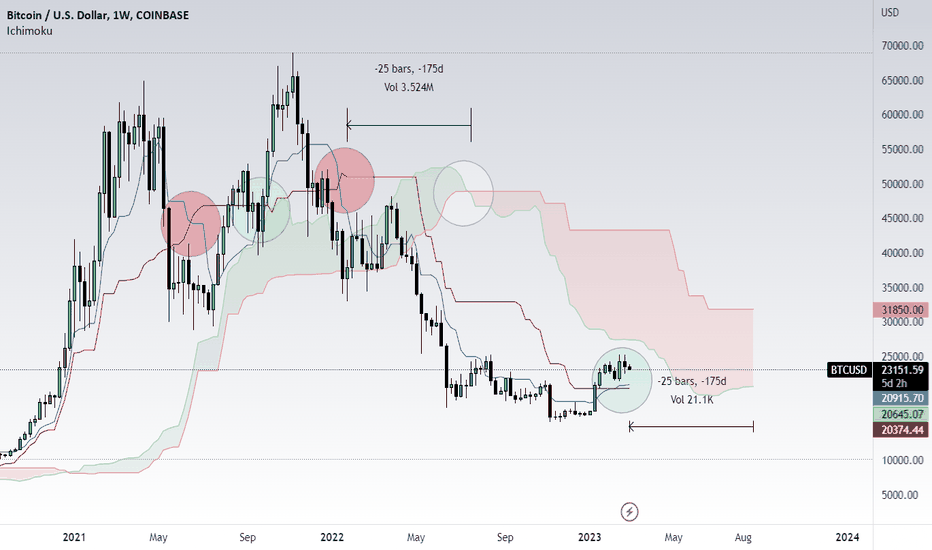
Ichimoku Cloud is a popular technical analysis tool used by traders to identify trends, support and resistance levels, and potential trading signals. There are several reasons why you might want to consider using Ichimoku Cloud as part of your technical analysis: -Provides a comprehensive view: Ichimoku Cloud incorporates multiple indicators and data points into one chart, which can provide a more comprehensive view of the market. This includes the current price, the average price, and the trend direction. -Easy to use: Ichimoku Cloud is relatively easy to use once you understand the different components. It's a visual tool that allows you to quickly see where the market is heading and identify potential trading opportunities. -Can be used on any timeframe: Ichimoku Cloud can be used on any timeframe, from one-minute charts to monthly charts. This makes it a versatile tool for traders of all levels. -Helps identify support and resistance levels: The Ichimoku Cloud can help you identify key support and resistance levels, which can be used to set stop-loss orders or profit targets. -Provides clear trading signals: The Ichimoku Cloud can generate clear trading signals when the price crosses the cloud or when the Tenkan-sen and Kijun-sen lines cross. This can help you identify potential entry and exit points for your trades. - Overall, Ichimoku Cloud is a powerful technical analysis tool that can help you make informed trading decisions. However, like any tool, it should be used in conjunction with other indicators and analysis techniques to confirm your trading signals.
Trading-Addicts
#btcusd

the price looking for lequidity so the probability is for long only
Trading-Addicts

Trading-Addicts

Disclaimer
Any content and materials included in Sahmeto's website and official communication channels are a compilation of personal opinions and analyses and are not binding. They do not constitute any recommendation for buying, selling, entering or exiting the stock market and cryptocurrency market. Also, all news and analyses included in the website and channels are merely republished information from official and unofficial domestic and foreign sources, and it is obvious that users of the said content are responsible for following up and ensuring the authenticity and accuracy of the materials. Therefore, while disclaiming responsibility, it is declared that the responsibility for any decision-making, action, and potential profit and loss in the capital market and cryptocurrency market lies with the trader.