
Tradeci
@t_Tradeci

What symbols does the trader recommend buying?
Purchase History
پیام های تریدر
Filter
Tradeci
بیت کوین در نقطه عطف: سیگنال صعود پنهان و تارگتهای هیجانانگیز!
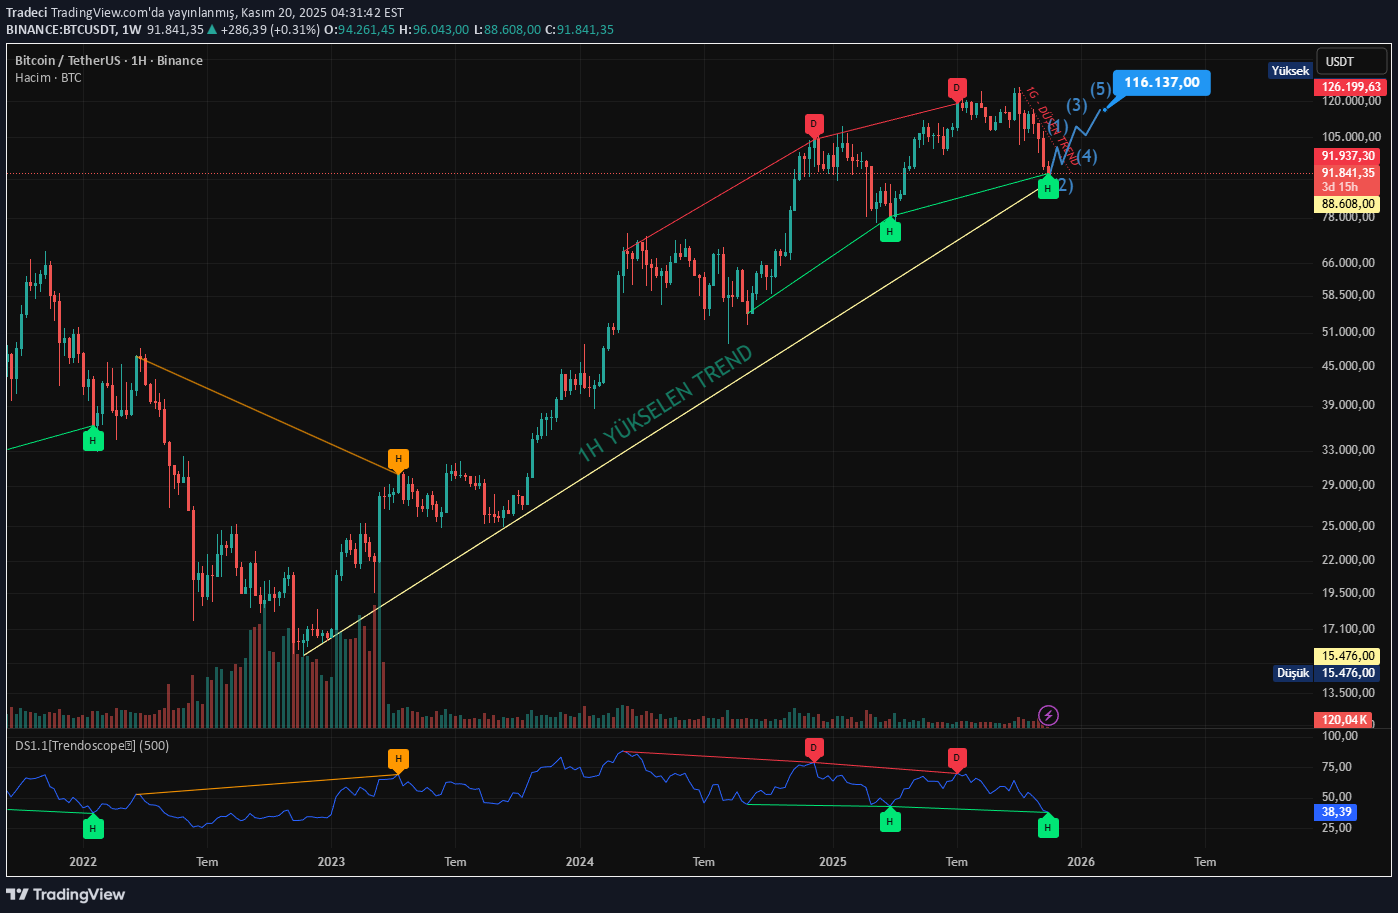
Btc tested the very tip of the long-term rising trend that it started from the 15k bottom on November 22 and received a reaction from that region, although not very strong. Additionally, Hidden positive divergence on the Weekly chart draws attention. It made the same hidden positive mismatch on March 25 and rose from 74k to 120k. There is also a hidden positive discrepancy in the current price. When the previous incompatibilities are examined in the graph, it is understood that it gives good results. We can think that the current price, both bouncing off the long-term rising trend and giving hidden positive divergence, is a bottom in the medium term and may start to rise after this point. The oscillators in the indicator used are not only RSI but also CCI, MACD, etc. It takes 8 indicators into consideration. Considering that the price returns from this region, its first target will be the 101k level of the daily falling trend. If the price breaks the daily falling trend, Btc it can rise to 116k level in a few weeks with the elliot wave theory, which I predict and hope will happen. Hoping it works.. IT ABSOLUTELY DOES NOT CONTAIN INVESTMENT ADVICE.
Tradeci
آپدیت مهم آپتوس (Aptos): آیا این ارز از دام ریزش نجات یافته و به ۱۷ دلار میرسد؟

Aptos 35 weeks seem to have survived the decline process. If the weekly closure is over 5 USD, it will be considered to be saved and her eyes will be upstairs. In the previous cycles, he made the same movement twice. It is expected to go to $ 17 in 2-3 months. Graphic sharing is for tracking, does not include advice.
Tradeci
CRV: راز صعود بزرگ بعدی در نمودار، هدف ۱۴۴ سنت کجاست؟

Curve Dao After the harsh rise in July, he entered the rest process and drew a bull flag pattern. The resistance curve has closed daily over 0.77 and is now in the re-test stage. Formation Objective 1.44 Hoping to work.
Tradeci
BİTCOİN DOLAR PARİTESİ 1G GRAFİKTE TOBO VE MEGAFON FORMASYONLARI

TOBO formation neckline 117.4k levels. The formation target for closures on this level is 126.9k levels. Closes above this level may trigger the megaphone formation. The target of this formation is 145K levels. In April, he took the liquids by violating the rising trend from the bottom of the 74k. US stock exchanges and gold ounces ATH levels. BTC He's been looking for folding with manipulation for 1-2 days. I think the rally starts 1-2 days. It does not include investment advice.
Tradeci
JTO USDT ÜÇGEN KIRILIMI

JTO /USDT parity has experienced a huge triangle breakout and retest. There is also a short-term ascending triangle. I think it is currently stuck at that resistance and when it breaks, its rise will accelerate. The formation target is 13,295 usdt -approximately 3.5x Does not contain investment advice.
Tradeci
LTO /USDT DEVASA ÇANAKLARI İLE PARİTESİ UÇUŞA HAZIRLANIYOR.

In the 1-day chart, it has formed a deep bowl since May 24, 2024. The neckline is 0.2300 usdt. It seems to have been broken now. It is necessary to look for day closings above this level for confirmation. If the formation works, it can go to 0.5586 usdt in series. Since this level coincides with the falling trend line after the 2021 bull, it seems to act as a strong resistance. In addition, there is a larger bowl formed between April 7, 2022 and March 26, 2024 in the big picture. It looks like a cup-handle formation, but the handle size is very deep. The target is the same in the Bowl and Cup-Handle formations. The neckline of this bowl formation targets 1.80 usdt in closings above 0.3093 usdt. I wish it works. I wish them a good flight. I made up this chart myself. It does not contain investment advice.
Tradeci

Tradeci
TAO/USDT Partitesinde Fincan Kulp Formasyonu

There is a huge cup handle and pennant formation on the daily chart of the artificial intelligence coin Bittensor TAO. The pennant formation breakout and re-test have occurred. It is currently at a full buy point. I predict that the first target will be 953 usdt and the second target will be 1176 usdt in the medium term when the neckline of the Cup Handle formation is above 681 usdt. I am sharing it for follow-up purposes. It does not contain investment advice.
Tradeci
GALA USDT RALLİ İÇİN HAZIR GİBİ GÖRÜNÜYOR

Flag formation in parity Gala Usdt in the 4-hour period, Adam Eve Formation draws attention in the weekly time frame. The Adam and Eve formation seems to have received its approval with today's decline. So the retest is complete. 0.058 usdt Unless there is a six-week close, their targets are 0.15 and 0.27. The 0.27 level is the 0.382 Fibonacci level of the major decline. This is a chart I made up for training and tracking purposes. Does not contain recommendations.Comment: The flag formation in the Gala Usdt parity was slightly disrupted by the sharp declines last week. But it works perfectly in BTC parity. In the next period, I will follow it with BTC parity. It returned from 79, which is a very good level. It has given a retest to the previous peak. The formation neckline was broken with 88 volumes. I will patiently wait for the formation target price to reach 150 sts. Current price makes +51% from 99. GRACE...
Tradeci
CHZ-USDT DEVASA BAYRAK FORMASYONU 💥💥

Chz Usdt There is a giant flag formation in the parity. The first falling trend was broken in the week. Flag formation line is 0.175. It wouldn't be a surprise to go to the x20 at the closes above this level. He had done much more in the last bull.
Disclaimer
Any content and materials included in Sahmeto's website and official communication channels are a compilation of personal opinions and analyses and are not binding. They do not constitute any recommendation for buying, selling, entering or exiting the stock market and cryptocurrency market. Also, all news and analyses included in the website and channels are merely republished information from official and unofficial domestic and foreign sources, and it is obvious that users of the said content are responsible for following up and ensuring the authenticity and accuracy of the materials. Therefore, while disclaiming responsibility, it is declared that the responsibility for any decision-making, action, and potential profit and loss in the capital market and cryptocurrency market lies with the trader.