Technical analysis by Tradeci about Symbol BTC: Buy recommendation (23 hour ago)

Tradeci
بیت کوین در نقطه عطف: سیگنال صعود پنهان و تارگتهای هیجانانگیز!
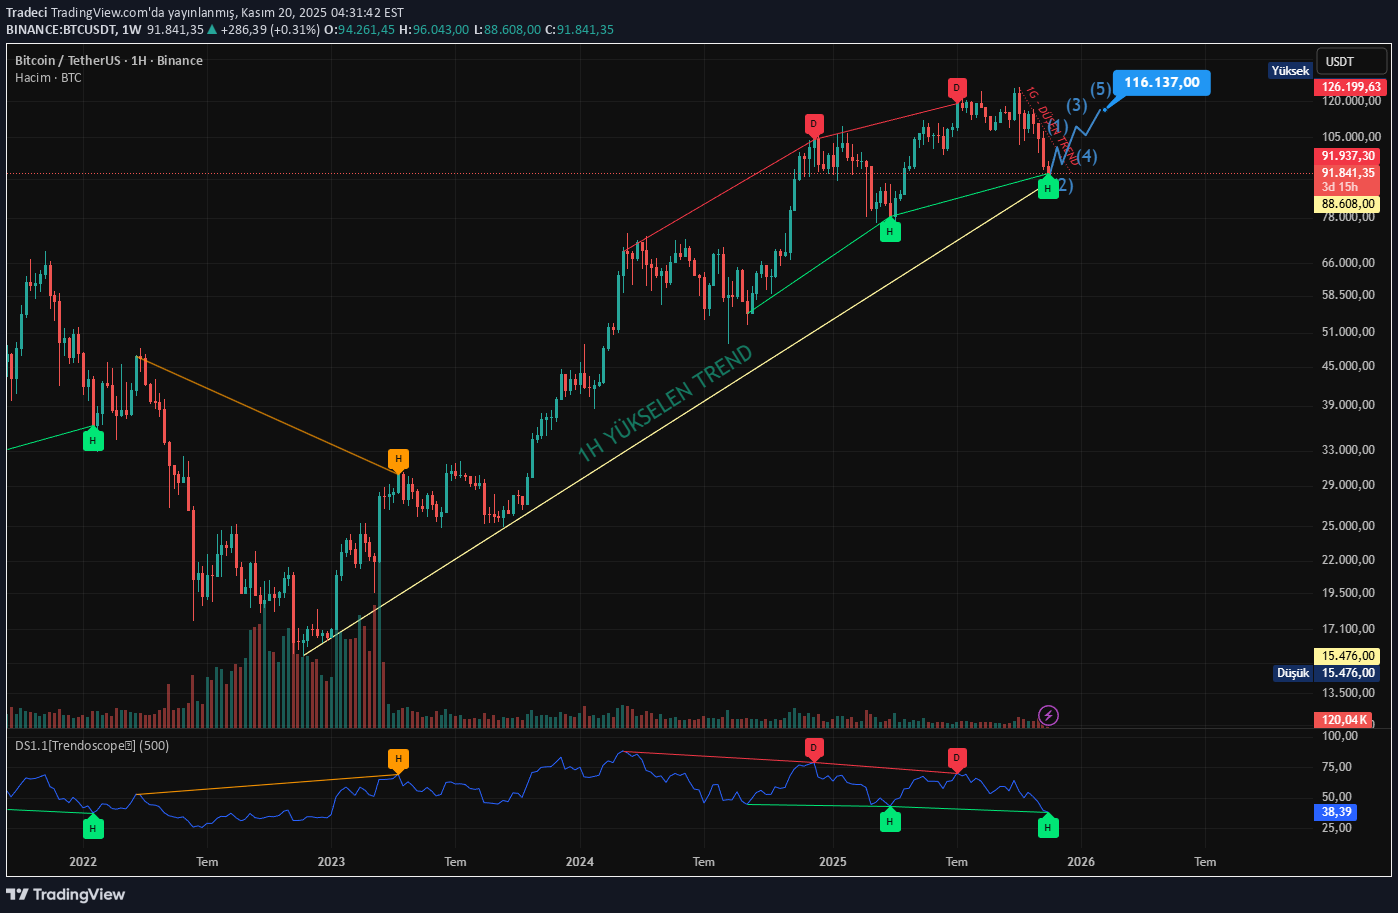
Btc tested the very tip of the long-term rising trend that it started from the 15k bottom on November 22 and received a reaction from that region, although not very strong. Additionally, Hidden positive divergence on the Weekly chart draws attention. It made the same hidden positive mismatch on March 25 and rose from 74k to 120k. There is also a hidden positive discrepancy in the current price. When the previous incompatibilities are examined in the graph, it is understood that it gives good results. We can think that the current price, both bouncing off the long-term rising trend and giving hidden positive divergence, is a bottom in the medium term and may start to rise after this point. The oscillators in the indicator used are not only RSI but also CCI, MACD, etc. It takes 8 indicators into consideration. Considering that the price returns from this region, its first target will be the 101k level of the daily falling trend. If the price breaks the daily falling trend, Btc it can rise to 116k level in a few weeks with the elliot wave theory, which I predict and hope will happen. Hoping it works.. IT ABSOLUTELY DOES NOT CONTAIN INVESTMENT ADVICE.