
TradeMing
@t_TradeMing

What symbols does the trader recommend buying?
Purchase History
پیام های تریدر
Filter
TradeMing
سطوح کلیدی بیت کوین در تایم فریم 4 ساعته: صبر یا انفجار بزرگ؟
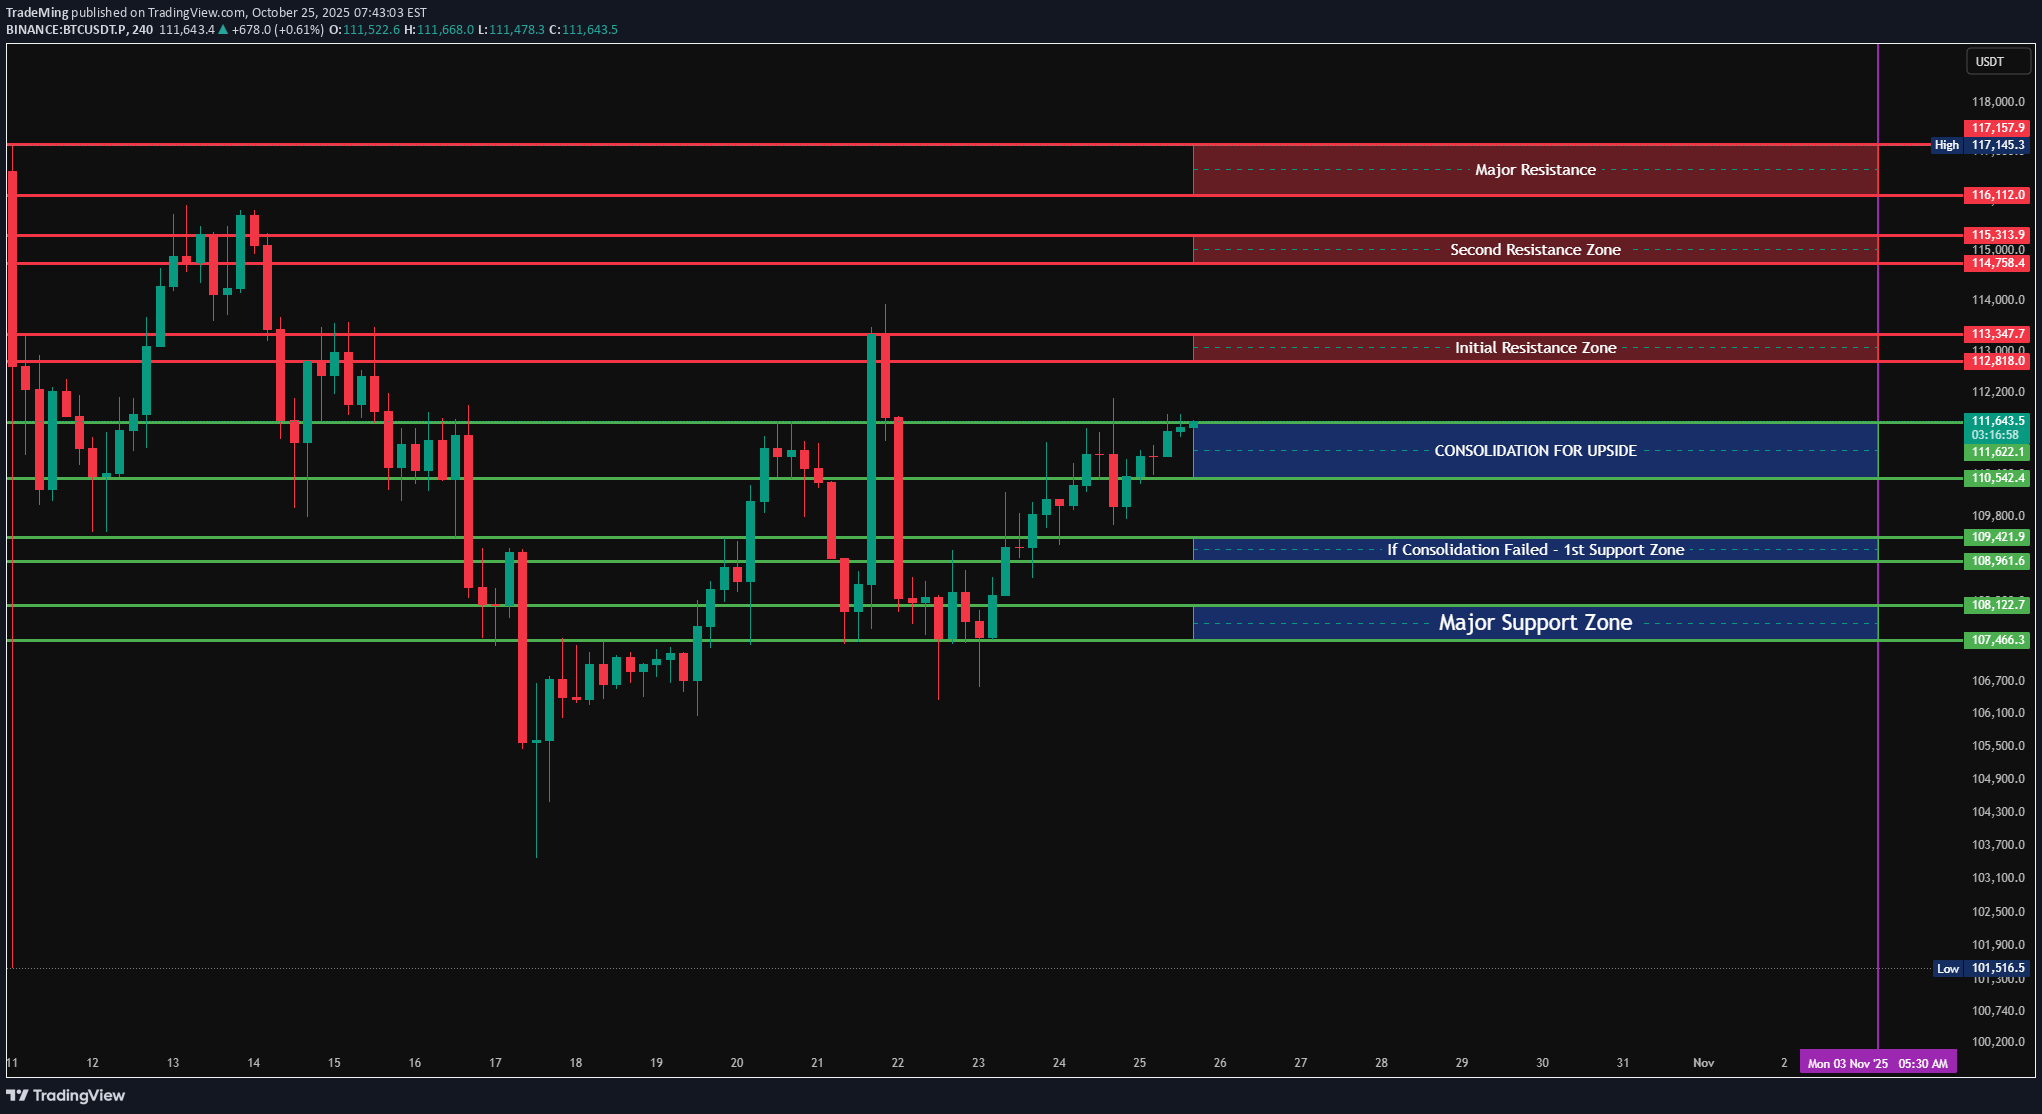
🧭 BTC 4H Market Analysis BTC remains in a structural equilibrium phase, holding within a tight consolidation pocket ($111,422 – $111,691) as the market attempts to sustain above the midrange base. Price has been building gradually higher lows since the last retest of the Major Support Zone ($107,466 – $108,122), signaling a slow reaccumulation phase within a broader corrective context. This “Consolidation for Upside” zone marks a pivotal decision area. Sustained acceptance above $111,600 will likely confirm strength continuation toward the Initial Resistance Zone ($112,818 – $113,347), setting the stage for a possible breakout sequence toward the higher resistance layers at $114,758 – $115,313 (Second Resistance) and $116,112 – $117,157 (Major Resistance). The 4H market tone currently shows balance, with buyers defending dips efficiently but yet to assert full control. For any bullish follow-through, the next few candles will need to establish closing strength above the consolidation ceiling — ideally a clean break and retest confirmation above $111,700. If price fails to expand upward and instead slips back below $110,524, the short-term tone shifts to neutral, and BTC may drift back into its lower demand range at $109,421 – $108,961 (“If Consolidation Failed – 1st Support Zone”). That’s where buyers are expected to defend again; loss of this zone would expose the deeper Major Support Zone ($107,466 – $108,122), a key structural area that has historically served as a base for directional reversals. The broader structural context indicates that BTC is compressing within a mid-range pocket, likely preparing for a breakout leg into early November. Given the price compression near the consolidation high, momentum bias leans constructively bullish, provided the upper range holds firm. 📊 Summary: Current Range: $111,422 – $111,691 (Consolidation for Upside) Immediate Support: $110,524 If Consolidation Fails – 1st Support Zone: $109,421 – $108,961 Major Support Zone: $107,466 – $108,122 Initial Resistance Zone: $112,818 – $113,347 Second Resistance Zone: $114,758 – $115,313 Major Resistance: $116,112 – $117,157 Market Tone: Balanced / Constructive Bias: Mildly Bullish while holding above $110,500; range-neutral below $109,400.
TradeMing
تحلیل بیت کوین (BTC): فرصتهای معاملاتی ۱۵ دقیقهای تا ۲۵ اکتبر!
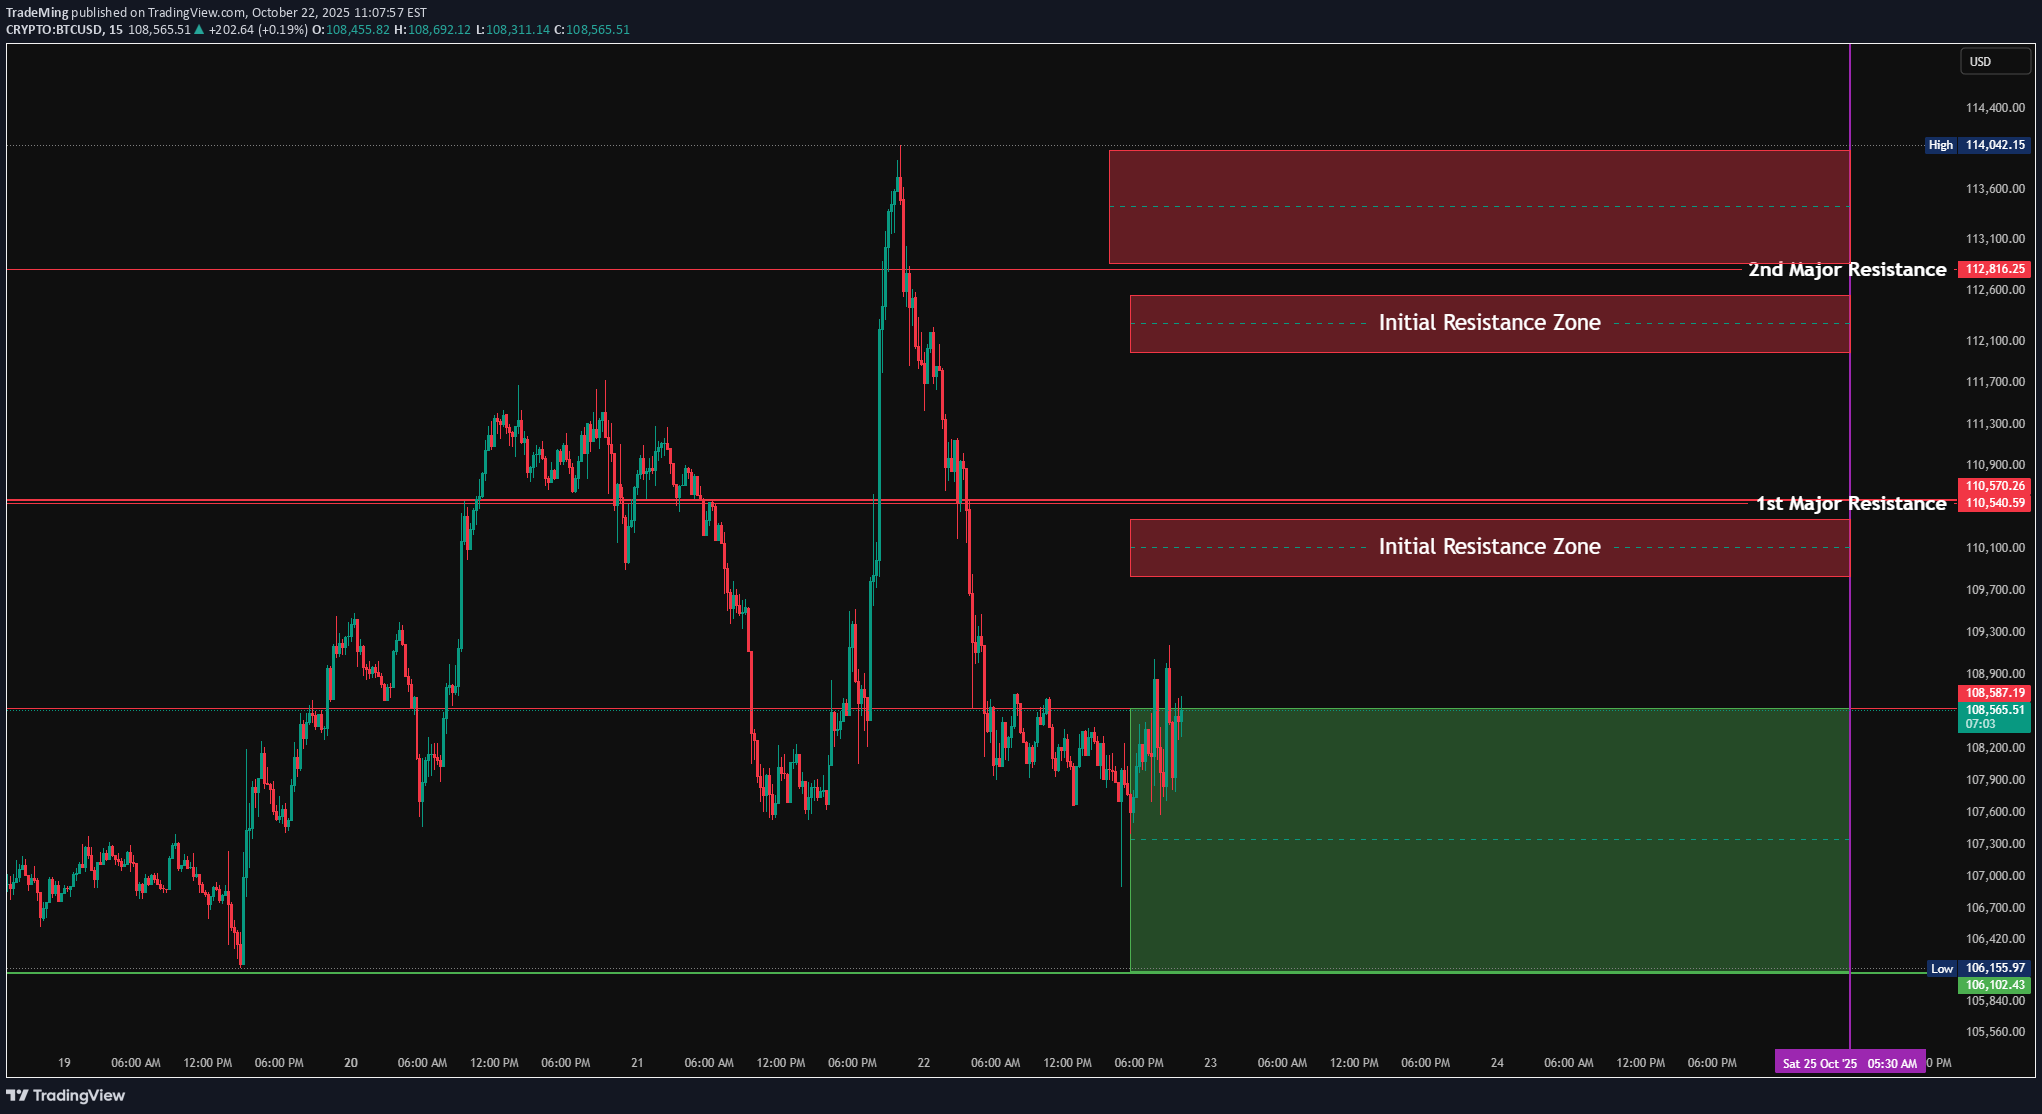
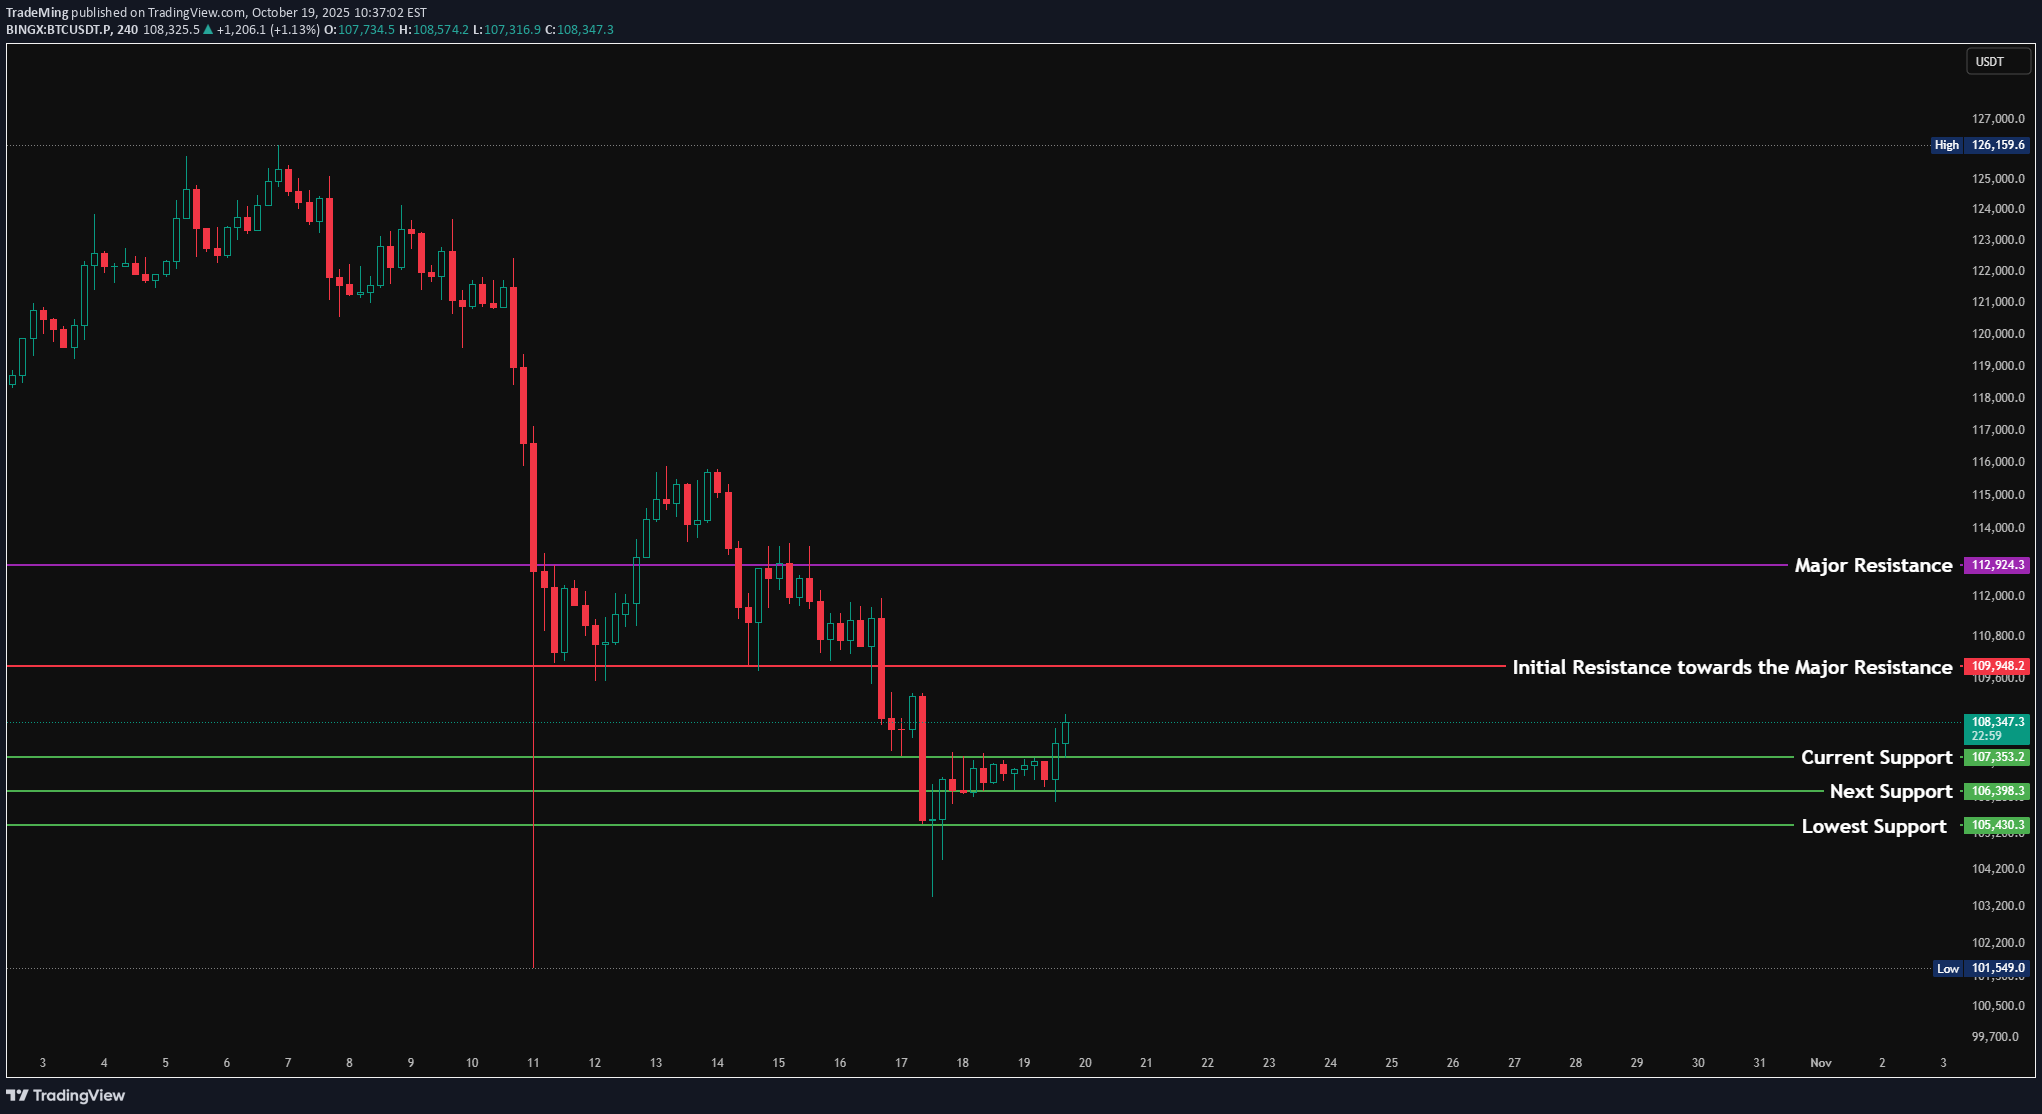
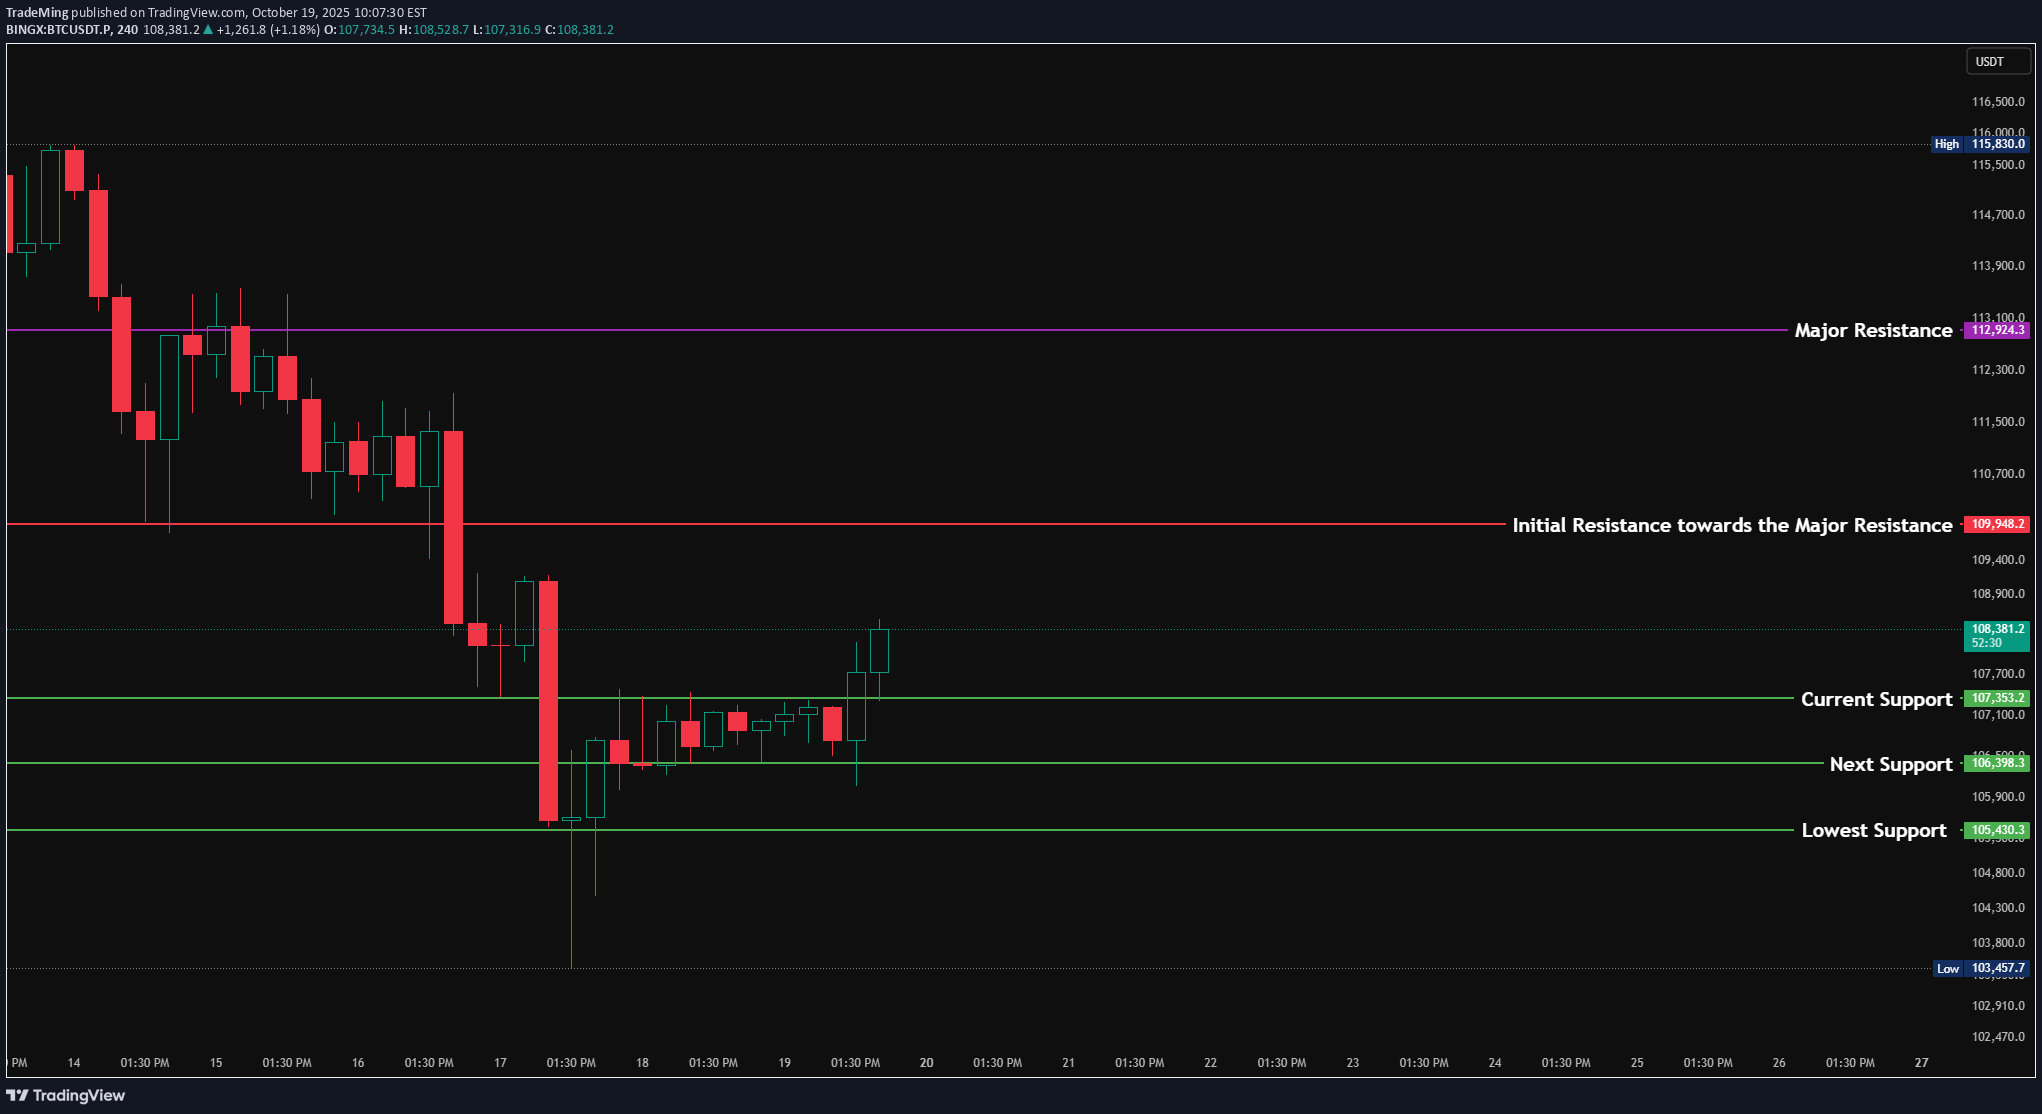
BTCUSD BTCUSD BTCUSD BTCUSD BTCUSD BTCUSD BTCUSD BTCUSD BTCUSD BTCUSD BTCUSD BTCUSD BTCUSD BTC BTCUSD BTCUSD BTCUSD BTCUSD BITCOIN BTCUSD BTCUSDZ2025 BTCUSD BTCUSD BTCUSD BTCUSD BTCUSD BTCUSDZ2025 BTCUSD BTCUSD BTCUSD BTCUSDV2025 BTCUSDV2025 BTCUSD BTCUSD BTCUSD BTCUSD BTCUSD BTCUSD24V2025 BTCUSD26Z2025 BTCUSD24V2025 BTCUSDT.P BTCUSD.P BTCUSDT.P BTCUSD.P BTCUSDT.P BTCUSDT.P BTCUSDC.P BTC 15M Market Analysis BTC is currently trading inside a well-defined Major Support Zone, holding between $108,149 – $107,361. This zone represents the lower boundary of the recent move and continues to act as a critical short-term base for buyers. Price action within this zone has been volatile but reactive — every dip has so far seen a quick absorption, indicating active demand and short-covering behavior. At the moment, the short-term structure remains in a compression phase, with BTC trying to stabilize after a sharp rejection from the upper levels. The immediate resistance area to watch is the Initial Resistance Zone, ranging from $110,380 – $110,570. This zone previously triggered a swift sell-off, marking it as a significant barrier for any short-term recovery attempts. If BTC manages to reclaim this zone convincingly, it will likely open room for continuation toward the 2nd Major Resistance at $112,816 – $112,509, which aligns with the higher range’s liquidity cluster. This area could act as the decisive point before the market either extends higher or confirms rejection ahead of the 3D candle close. Until then, BTC appears to be consolidating within the Major Support Zone, and as long as price remains above $107,361, the structure maintains a neutral-to-constructive bias. A break and sustained close below $107,361 would shift short-term momentum bearish, possibly extending toward $106,900–$106,800, where minor liquidity pools remain untested. As we move closer to the 3D candle closing on October 25th, these next few sessions become critical. Price behavior around the $108K–$110K range will determine whether BTC’s current consolidation evolves into a reversal setup or continues into a lower structure. The fact that the market has held its footing here suggests that buyers are still active, but confirmation above $110,570 will be required to validate any short-term recovery momentum. If BTC fails to break above this resistance and remains trapped between $107,800–$110,000, we may see a slow grind or sideways accumulation into the 3D close — signaling market indecision and awaiting a broader volatility event post-weekend. 🧭 Key Levels & Observations: 2nd Major Resistance: $112,816 – $112,509 (upper resistance and liquidity grab area) 1st Major Resistance: $110,570 – $110,380 (immediate short-term barrier) Initial Resistance Zone: $109,843 – $110,570 (local range top to watch for rejection or breakout) Major Support Zone: $108,149 – $107,361 (current base and demand area) Lower Reaction Zone (if breakdown): $106,901 – $106,800 (minor liquidity pool and stop zone) Market Tone: Range-bound but stabilizing; short-term bullish potential if $110,570 breaks. Bias (until 3D close): Neutral-to-bullish above $108K; weak bias if sustained below $107.3K. Focus Heading into 25 Oct 2025: Holding above $108K supports short-term accumulation narrative. Breakout above $110.5K sets up recovery toward $112.5K zone. Breakdown below $107.3K opens $106.9K test and shifts momentum bearish. A complete Breakdown Video Available in Youtube Disclaimer All information, charts, and analyses shared are for educational and informational purposes only and should not be considered as financial or investment advice. Kindly do not attempt to imitate my positions or take trades solely based on the analysis shared. Always conduct your own research and independent analysis before making any trading or investment decisions. Trading in financial markets involves significant risk, and you are solely responsible for your profits or losses.
TradeMing
تحلیل ۱۵ دقیقهای بیت کوین: آیا قیمت زیر ۱۰۷ هزار دلار سقوط میکند؟ (تا بسته شدن کندل ۳ روزه)

BTCUSD BTCUSD BTCUSD BTCUSD BTCUSD BTCUSD BTCUSD BTCUSD BTCUSD BTCUSD BTCUSD BTCUSD BTCUSD BTC BTCUSD BTCUSD BTCUSD BTCUSD BITCOIN BTCUSD BTCUSDZ2025 BTCUSD BTCUSD BTCUSD BTCUSD BTCUSD BTCUSDZ2025 BTCUSD BTCUSD BTCUSD BTCUSDV2025 BTCUSDV2025 BTCUSD BTCUSD BTCUSD BTCUSD BTCUSD BTCUSD24V2025 BTCUSD26Z2025 BTCUSD24V2025 BTCUSDT.P BTCUSD.P BTCUSDT.P BTCUSD.P BTCUSDT.P BTCUSDT.P BTCUSDC.P BTC 15M Market Analysis BTC is currently trading inside a well-defined Major Support Zone, holding between $108,149 – $107,361. This zone represents the lower boundary of the recent move and continues to act as a critical short-term base for buyers. Price action within this zone has been volatile but reactive — every dip has so far seen a quick absorption, indicating active demand and short-covering behavior. At the moment, the short-term structure remains in a compression phase, with BTC trying to stabilize after a sharp rejection from the upper levels. The immediate resistance area to watch is the Initial Resistance Zone, ranging from $110,380 – $110,570. This zone previously triggered a swift sell-off, marking it as a significant barrier for any short-term recovery attempts. If BTC manages to reclaim this zone convincingly, it will likely open room for continuation toward the 2nd Major Resistance at $112,816 – $112,509, which aligns with the higher range’s liquidity cluster. This area could act as the decisive point before the market either extends higher or confirms rejection ahead of the 3D candle close. Until then, BTC appears to be consolidating within the Major Support Zone, and as long as price remains above $107,361, the structure maintains a neutral-to-constructive bias. A break and sustained close below $107,361 would shift short-term momentum bearish, possibly extending toward $106,900–$106,800, where minor liquidity pools remain untested. As we move closer to the 3D candle closing on October 25th, these next few sessions become critical. Price behavior around the $108K–$110K range will determine whether BTC’s current consolidation evolves into a reversal setup or continues into a lower structure. The fact that the market has held its footing here suggests that buyers are still active, but confirmation above $110,570 will be required to validate any short-term recovery momentum. If BTC fails to break above this resistance and remains trapped between $107,800–$110,000, we may see a slow grind or sideways accumulation into the 3D close — signaling market indecision and awaiting a broader volatility event post-weekend. 🧭 Key Levels & Observations: 2nd Major Resistance: $112,816 – $112,509 (upper resistance and liquidity grab area) 1st Major Resistance: $110,570 – $110,380 (immediate short-term barrier) Initial Resistance Zone: $109,843 – $110,570 (local range top to watch for rejection or breakout) Major Support Zone: $108,149 – $107,361 (current base and demand area) Lower Reaction Zone (if breakdown): $106,901 – $106,800 (minor liquidity pool and stop zone) Market Tone: Range-bound but stabilizing; short-term bullish potential if $110,570 breaks. Bias (until 3D close): Neutral-to-bullish above $108K; weak bias if sustained below $107.3K. Focus Heading into 25 Oct 2025: Holding above $108K supports short-term accumulation narrative. Breakout above $110.5K sets up recovery toward $112.5K zone. Breakdown below $107.3K opens $106.9K test and shifts momentum bearish. A complete Breakdown Video Available in Youtube Disclaimer All information, charts, and analyses shared are for educational and informational purposes only and should not be considered as financial or investment advice. Kindly do not attempt to imitate my positions or take trades solely based on the analysis shared. Always conduct your own research and independent analysis before making any trading or investment decisions. Trading in financial markets involves significant risk, and you are solely responsible for your profits or losses.
TradeMing
بیت کوین در آستانه سقوط یا جهش؟ تحلیل سطح حمایت حیاتی BTC
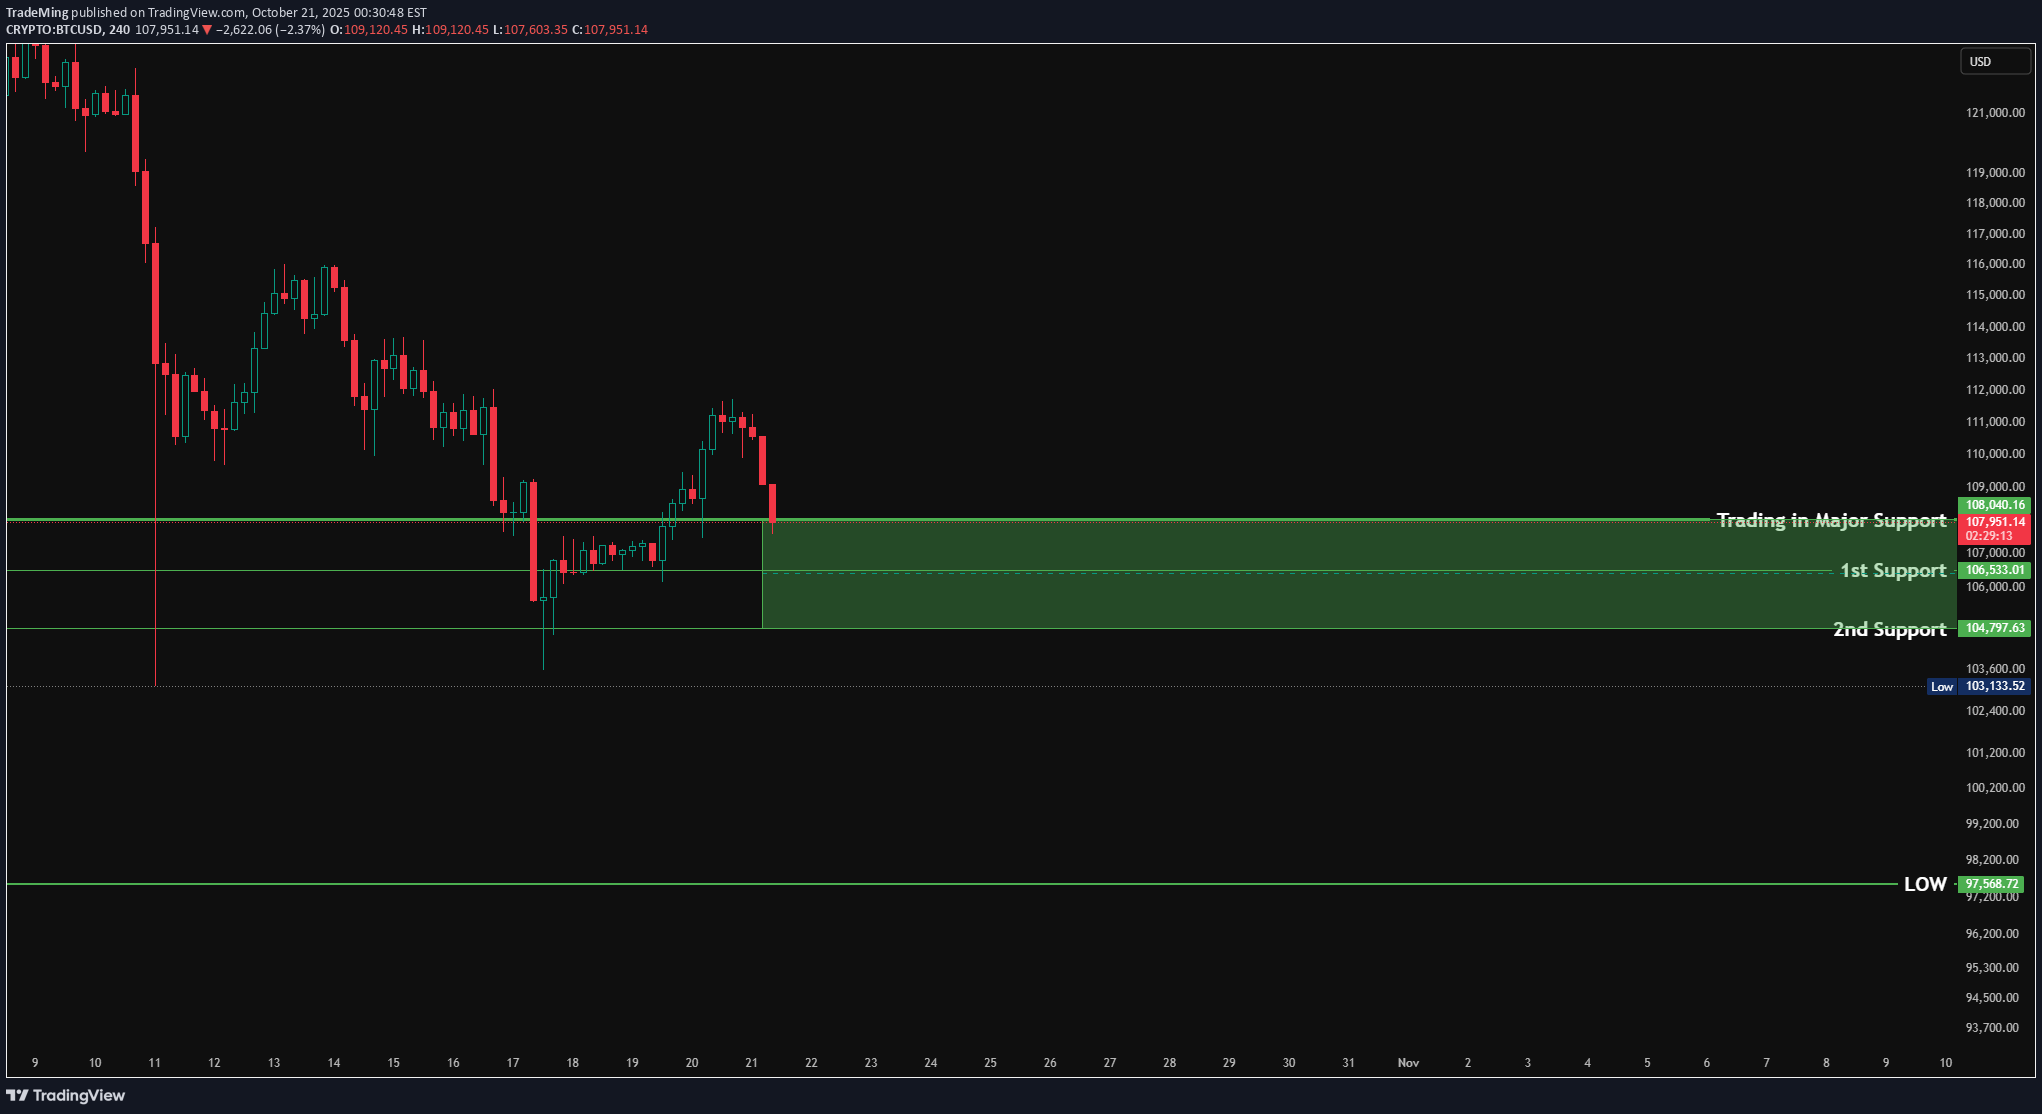
BTCUSD BTC Market Analysis BTC is presently trading within its major support zone, finding footing after a sharp pullback that brought price right back into the key demand region between $108,040 and $106,533. This area has historically acted as a strong reaction zone, and once again, price seems to be stabilizing here, with short-term candles showing signs of base formation. Over the past few sessions, BTC has been moving in a sideways consolidation range roughly between $108,000 and $104,700, suggesting that the market is pausing to absorb recent volatility. This range represents the short-term balance point — buyers are stepping in around the lower end while sellers remain active near the top. At the moment, BTC is trading around the upper half of this range, hovering just above the 1st support at $106,533, which continues to hold well. A sustained defense of this level would be the first sign that buyers are quietly regaining control, possibly preparing for a rebound toward the upper boundary near $108,000 – $109,000. However, the 2nd support at $104,707 remains the real line in the sand. A decisive close below that would indicate weakness extending beyond a simple consolidation — possibly reopening the door for a deeper retest toward the $97,568 major low zone, which aligns with the broader structural support from previous swing cycles. On the flip side, if BTC manages to stay steady and reclaim ground above $108,000, it would indicate the start of a short-term recovery phase. That could bring price back toward $110,000–$111,000, where the next supply cluster sits. But until a clear breakout is seen, the market remains range-bound and cautious. In short, BTC is trying to build a base here. The structure looks like accumulation within a broader correction, and how the market reacts around this $106K–$104K range will define whether this is a genuine bottoming phase or just a pause before another leg down. 🧭 Key Levels & Outlook: Major Support Zone: $108,040 – $106,533 Consolidation Range: $108,000 – $104,700 1st Support: $106,533 (active defense zone) 2nd Support: $104,707 (critical structural base) Next Downside Target (if breakdown): $97,568 – $98,262 Market Tone: Cautiously neutral — sideways consolidation at major support. Bias: Constructive above $106,500; bearish confirmation only below $104,700. Key Focus: Watch for breakout above $108,000 for signs of relief rally; a daily close under $104,700 could accelerate downside momentum.
TradeMing
سطوح کلیدی اتریوم (ETH): مقاومت حیاتی و مسیر رسیدن به تارگت ۴۴۲۹ دلار!
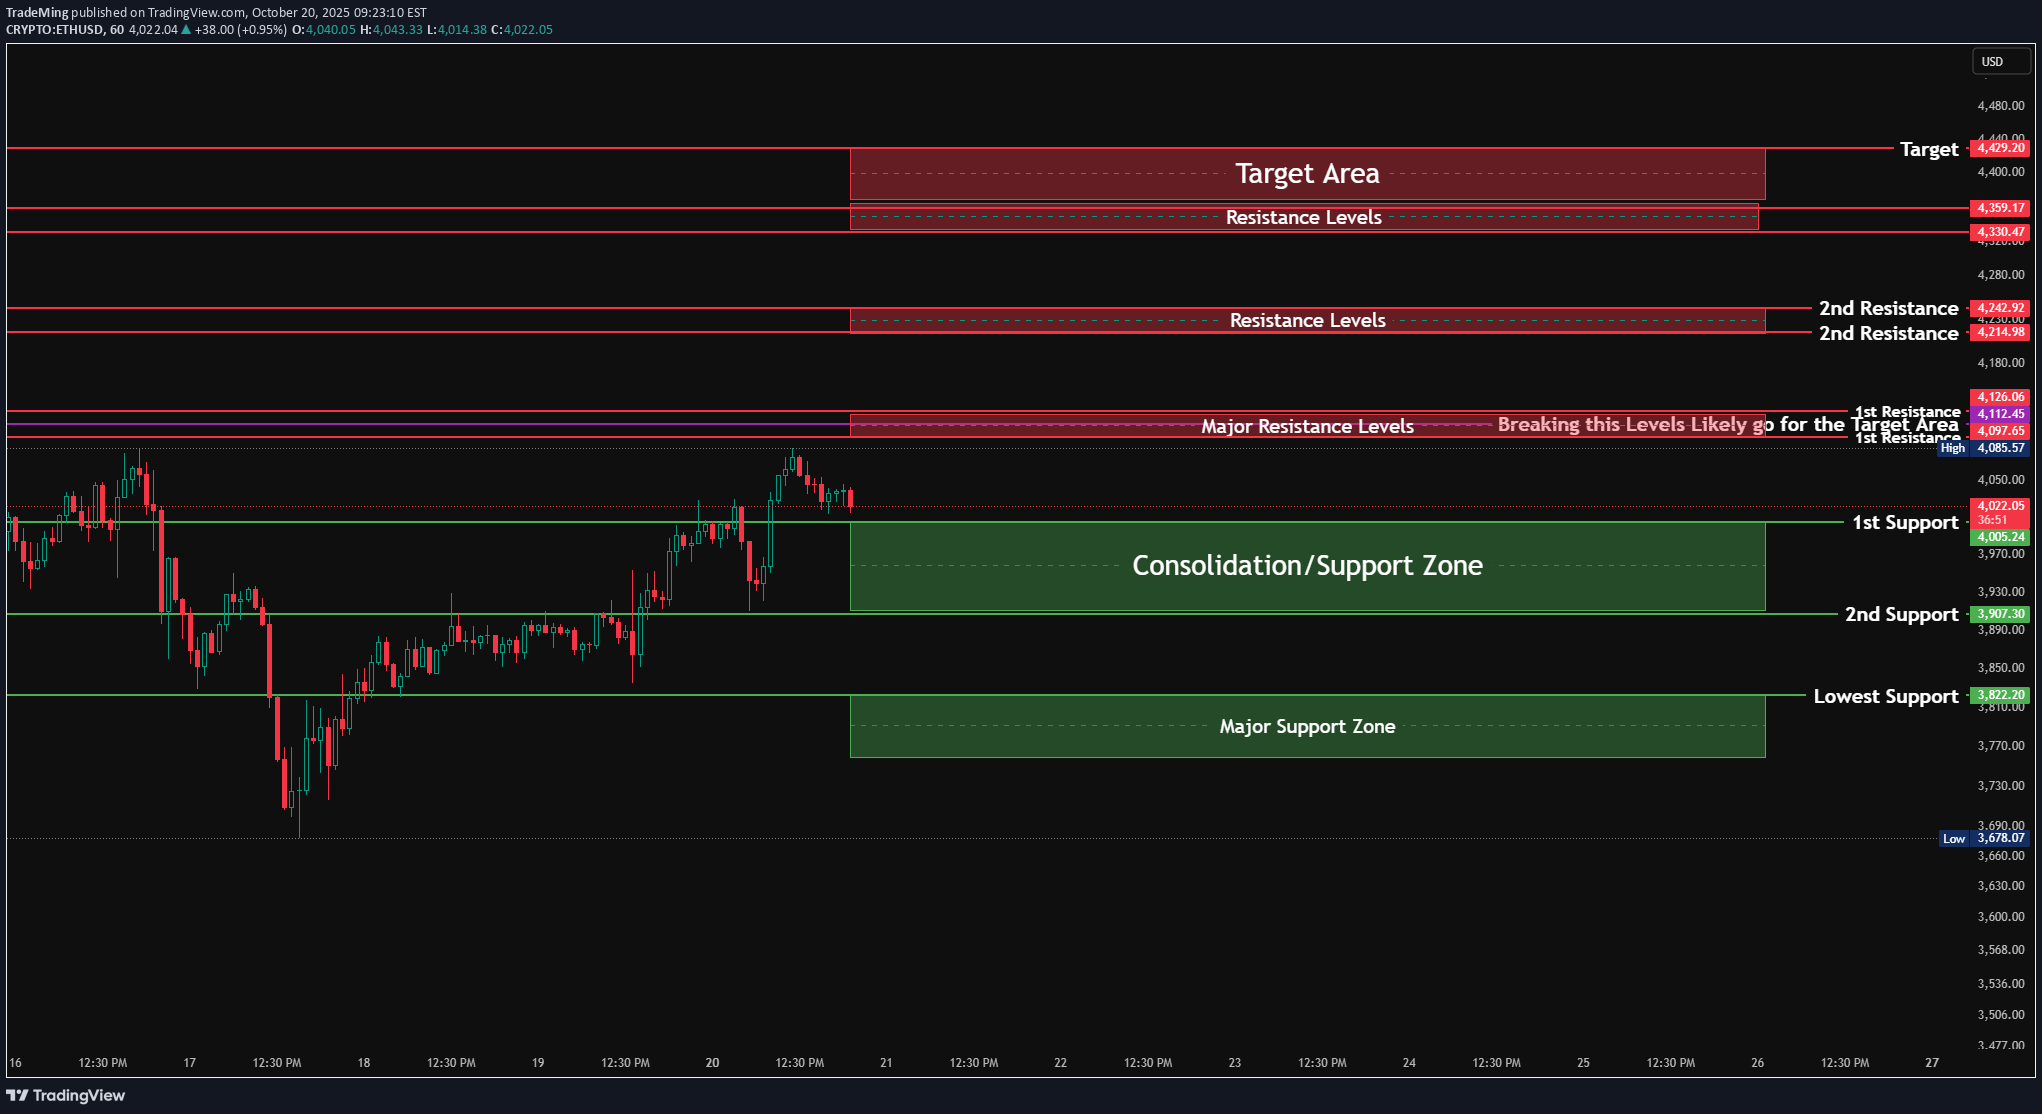
ETHUSD Market Analysis: ETH Currently, ETH is trading just below a Major Resistance cluster around $4,077 – $4,126, after maintaining a strong short-term recovery from the recent lows. The market is consolidating within a defined structure, as shown by the Consolidation/Support Zone between $4,016 – $4,005, which now acts as the immediate base for buyers to defend. This zone represents the equilibrium point for the current leg — holding above it keeps the short-term bias positive, while a breakdown could shift momentum back toward the 2nd Support region at $3,960 – $3,905. The next key area to watch is the Major Resistance band between $4,077 – $4,126. This level has historically acted as both a strong reaction point and a liquidity pocket. A clear breakout above $4,126 with sustained volume and follow-through candles would likely open up the path toward the 2nd Resistance zone at $4,214 – $4,242, followed by the upper Target Area between $4,330 – $4,429. The label “Breaking this Levels Likely go for the Target Area” perfectly highlights the market’s structural inflection point — crossing above this band signifies momentum continuation and confirms the strength of the ongoing recovery. On the downside, the Major Support Zone between $3,823 – $3,822 remains the structural safeguard for ETH’s broader recovery setup. This area aligns with the 4H HTF Ray, indicating strong confluence between intraday and higher timeframe supports. A breakdown below $3,822 would invalidate the current bullish structure and expose ETH to deeper retracement levels. As of now, ETH remains in a short-term consolidation phase under resistance, with price structure still constructive. Bulls are defending the lower supports effectively, and a breakout above $4,126 would confirm a shift from consolidation to expansion — targeting the $4,330 – $4,429 range as the next liquidity objective. 🧭 Summary: Target Area: $4,429 – $4,330 2nd Resistance Zone: $4,242 – $4,214 Major Resistance Levels: $4,126 – $4,077 (Break and sustain above this zone likely triggers move toward the target area) 1st Support / Consolidation Zone: $4,016 – $4,005 2nd Support: $3,960 – $3,905 Major Support Zone: $3,823 – $3,822 Market Tone: Neutral-to-bullish; range-bound but holding above key support. Bias: Bullish above $4,005; momentum confirmation above $4,126 may drive toward $4,330–$4,429. Key Focus: Watch how ETH reacts around the $4,126 resistance — breakout strength here will determine if momentum carries to the target zone or fades back into the support band.
TradeMing
بیت کوین برگشت: حمایت کلیدی ۱۱۰ هزار دلار پس گرفته شد، آیا به ۱۱۷ هزار دلار میرسیم؟
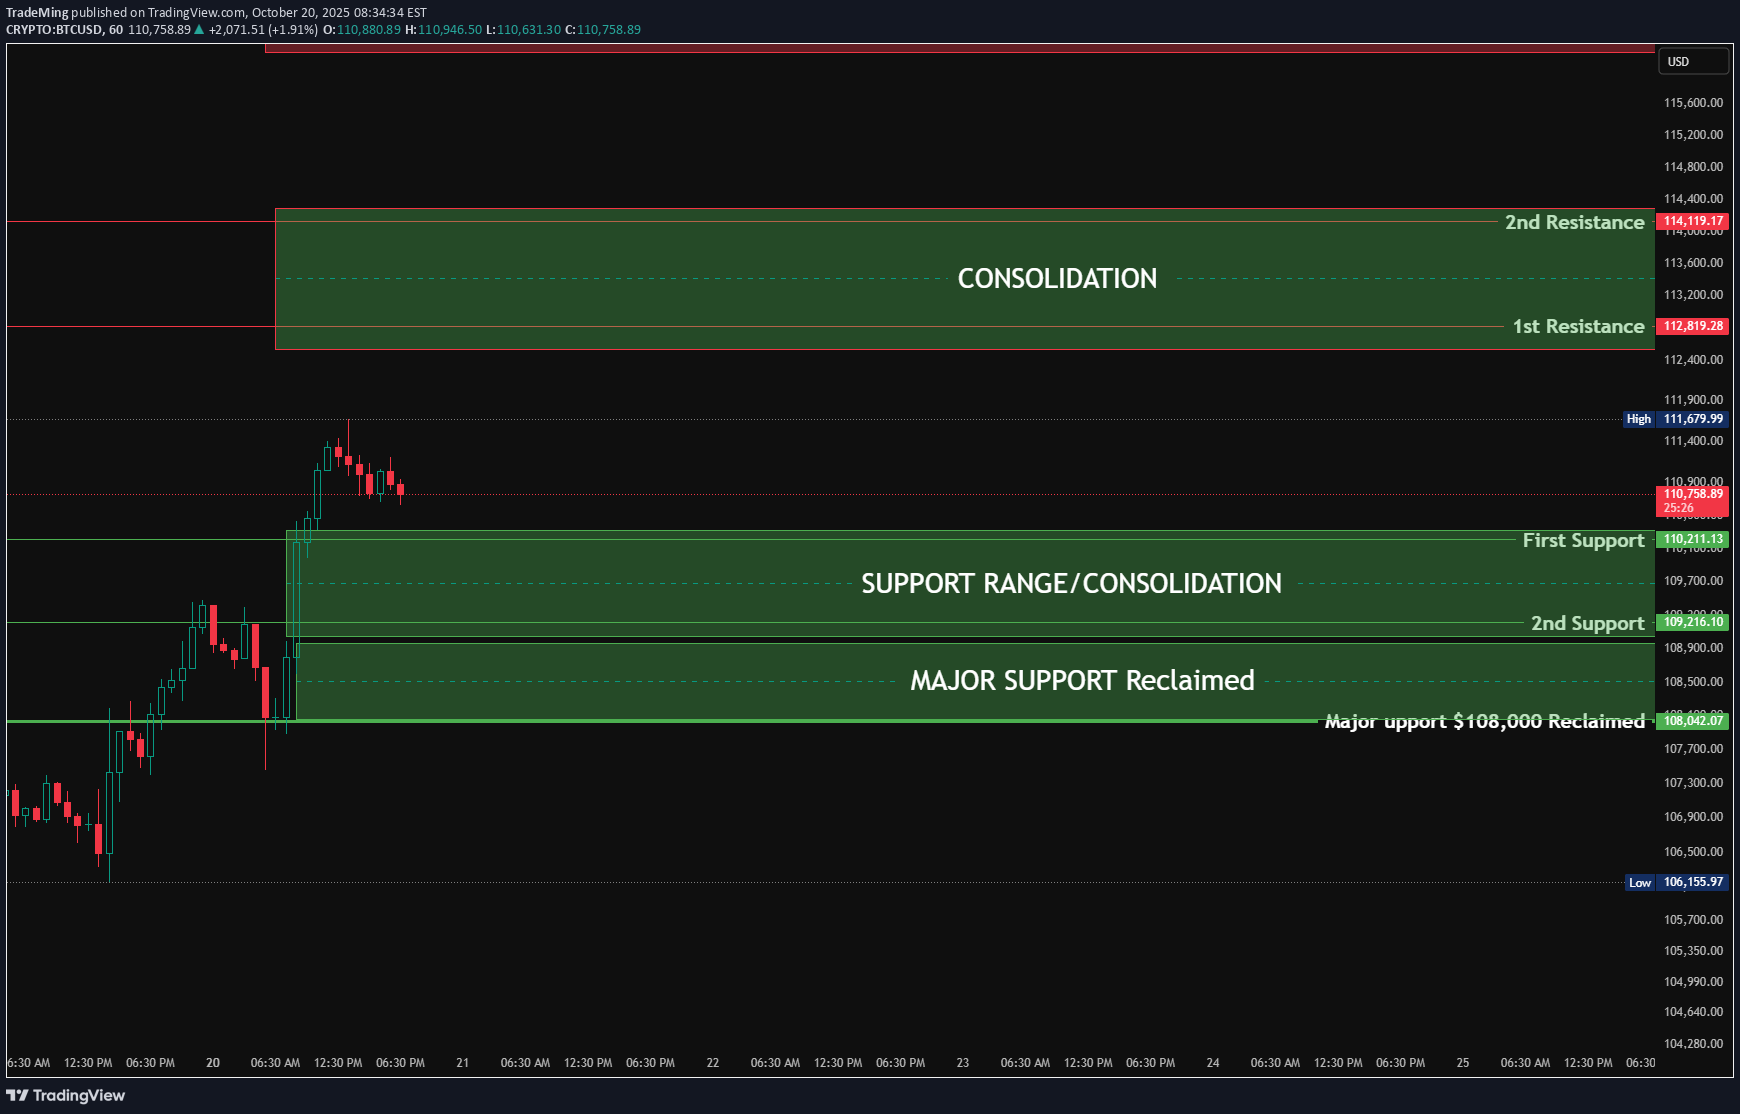
BTCUSD Market Analysis: BTC BTC has shown a strong rebound in recent sessions, successfully reclaiming the major support at $108,000, which had previously acted as a critical breakdown zone. This reclaim confirms a clear shift in short-term momentum, indicating that buyers have regained control after a deep corrective phase. The structure now shows price stabilizing above this reclaimed support and testing the next resistance cluster. Currently, BTC is trading around $111,000, sitting within a key Support/Consolidation range between $110,400 – $110,216, which is acting as the immediate holding base. Sustaining above this zone will be essential for maintaining bullish pressure, as it serves as the first structural demand level after the breakout. The next immediate upside challenge lies between $112,828 – $113,000, marked as the 1st Resistance zone. This area represents a prior breakdown level and is likely to attract short-term profit-taking or seller interest. A clean breakout and sustained close above this level could open the path toward the 2nd Resistance at $114,175, where the market may briefly consolidate again before attempting to expand further. The broader upside target for this structure sits within the Target Range between $117,158 – $117,000, aligning with the top of the recent corrective structure. This zone represents the next potential liquidity sweep area if buyers continue to maintain strength and push the market through the intermediate resistance layers. On the downside, immediate supports are layered below at $109,264 (2nd Support) and $108,011 (Major Support Reclaimed). Any move back below $108,000 would invalidate the short-term bullish sentiment and could shift the tone back toward a neutral-to-bearish bias. Overall, BTC’s structure shows healthy recovery momentum with clear signs of reaccumulation after the $108K reclaim. The focus now remains on how price reacts around the $112,800–$113,000 zone — a decisive breakout here could confirm the next leg higher toward the $114K and $117K targets. 🧭 Summary: Major Support Reclaimed: $108,000 – $108,011 2nd Support: $109,264 1st Support / Consolidation Range: $110,400 – $110,216 1st Resistance: $112,828 – $113,000 2nd Resistance: $114,175 Target Range: $117,158 – $117,000 Market Tone: Bullish bias; reclaim of $108K confirms strength. Bias: Bullish above $110,200; neutral below $108,000. Key Focus: Reaction around $113,000 resistance — breakout continuation could extend to $114K and beyond, while rejection may lead to a retest of $110K support.
TradeMing
تغییر ساختار بازار بیت کوین: آیا کفسازی موقت شکل میگیرد؟
BTCUSD BTCUSD BTCUSD BTCUSD BTCUSD BTCUSD BTCUSD BTCUSD BTCUSD BTCUSD BTCUSD BTCUSD BTCUSD BTC BTCUSD BTCUSD BTCUSD BTCUSD BITCOIN BTCUSD BTCUSDZ2025 BTCUSD BTCUSD BTCUSD BTCUSD BTCUSD BTCUSDZ2025 BTCUSD BTCUSD BTCUSD BTCUSDV2025 BTCUSDV2025 BTCUSD BTCUSD BTCUSD BTCUSD BTCUSD BTCUSD24V2025 BTCUSD26Z2025 BTCUSD24V2025 BTCUSDT.P BTCUSD.P BTCUSDT.P BTCUSD.P BTCUSDT.P BTCUSDT.P BTCUSDC.P Currently, BTC is showing early signs of a short-term recovery after the recent sharp decline. The market has managed to hold above the Current Support zone around $107,357 – $107,353, which has been a crucial stabilizing level over the past few sessions. Price has now begun to climb gradually, indicating that buyers are attempting to absorb previous selling pressure and establish a temporary base. The immediate focus now shifts toward the Initial Resistance zone near $109,948, which stands as the first key hurdle on the path to recovery. This level is likely to act as a decisive region — if BTC can break and sustain above it, it could trigger a push toward the Major Resistance zone between $113,100 – $112,914. That region, however, is where heavy supply pressure has previously entered, causing sharp declines in prior attempts. Hence, any approach toward that zone should be observed carefully for potential rejection or confirmation of strength. On the downside, if the price fails to hold above $107,353, we could see a retest of the Next Support at $106,398 – $106,393, followed by the Lowest Support at $105,430, which represents the last structural line of defense before the market risks another drop toward deeper levels near $103,457 (the most recent low). Overall, the structure currently represents a short-term bottoming attempt within a broader corrective trend. BTC is still trading below the larger resistance zones, so while short-term momentum appears constructive, the broader tone remains cautiously neutral until the market breaks decisively above $109,948 – $110,000. Sustained strength above that region would validate the possibility of a more meaningful upside recovery. 🧭 Summary: Major Resistance: $113,100 – $112,914 Initial Resistance: $109,948 Current Support: $107,357 – $107,353 Next Support: $106,398 – $106,393 Lowest Support: $105,430 Major Low: $103,457 Market Tone: Neutral-to-bullish in short term; broader structure still corrective. Bias: Short-term bullish above $107,350; caution below $106,400 as breakdown risk increases. Key Focus: How BTC reacts between $109,900 – $110,000 will determine whether this current bounce extends or fades into another leg lower.
TradeMing
بیت کوین پس از سقوط: آیا ساختار بازار در تایم فریم 4 ساعته تغییر میکند؟
BTCUSD BTCUSD BTCUSD BTCUSD BTCUSD BTCUSD BTCUSD BTCUSD BTCUSD BTCUSD BTCUSD BTCUSD BTCUSD BTC BTCUSD BTCUSD BTCUSD BTCUSD BITCOIN BTCUSD BTCUSDZ2025 BTCUSD BTCUSD BTCUSD BTCUSD BTCUSD BTCUSDZ2025 BTCUSD BTCUSD BTCUSD BTCUSDV2025 BTCUSDV2025 BTCUSD BTCUSD BTCUSD BTCUSD BTCUSD BTCUSD24V2025 BTCUSD26Z2025 BTCUSD24V2025 BTCUSDT.P BTCUSD.P BTCUSDT.P BTCUSD.P BTCUSDT.P BTCUSDT.P BTCUSDC.P Currently, BTC is showing early signs of a short-term recovery after the recent sharp decline. The market has managed to hold above the Current Support zone around $107,357 – $107,353, which has been a crucial stabilizing level over the past few sessions. Price has now begun to climb gradually, indicating that buyers are attempting to absorb previous selling pressure and establish a temporary base. The immediate focus now shifts toward the Initial Resistance zone near $109,948, which stands as the first key hurdle on the path to recovery. This level is likely to act as a decisive region — if BTC can break and sustain above it, it could trigger a push toward the Major Resistance zone between $113,100 – $112,914. That region, however, is where heavy supply pressure has previously entered, causing sharp declines in prior attempts. Hence, any approach toward that zone should be observed carefully for potential rejection or confirmation of strength. On the downside, if the price fails to hold above $107,353, we could see a retest of the Next Support at $106,398 – $106,393, followed by the Lowest Support at $105,430, which represents the last structural line of defense before the market risks another drop toward deeper levels near $103,457 (the most recent low). Overall, the structure currently represents a short-term bottoming attempt within a broader corrective trend. BTC is still trading below the larger resistance zones, so while short-term momentum appears constructive, the broader tone remains cautiously neutral until the market breaks decisively above $109,948 – $110,000. Sustained strength above that region would validate the possibility of a more meaningful upside recovery. 🧭 Summary: Major Resistance: $113,100 – $112,914 Initial Resistance: $109,948 Current Support: $107,357 – $107,353 Next Support: $106,398 – $106,393 Lowest Support: $105,430 Major Low: $103,457 Market Tone: Neutral-to-bullish in short term; broader structure still corrective. Bias: Short-term bullish above $107,350; caution below $106,400 as breakdown risk increases. Key Focus: How BTC reacts between $109,900 – $110,000 will determine whether this current bounce extends or fades into another leg lower. Detailed Video youtu.be/aORgAZUQ6q0
TradeMing
تحلیل بیت کوین: آیا بازیابی موقت است یا سقوط به زیر ۹۷ هزار دلار؟
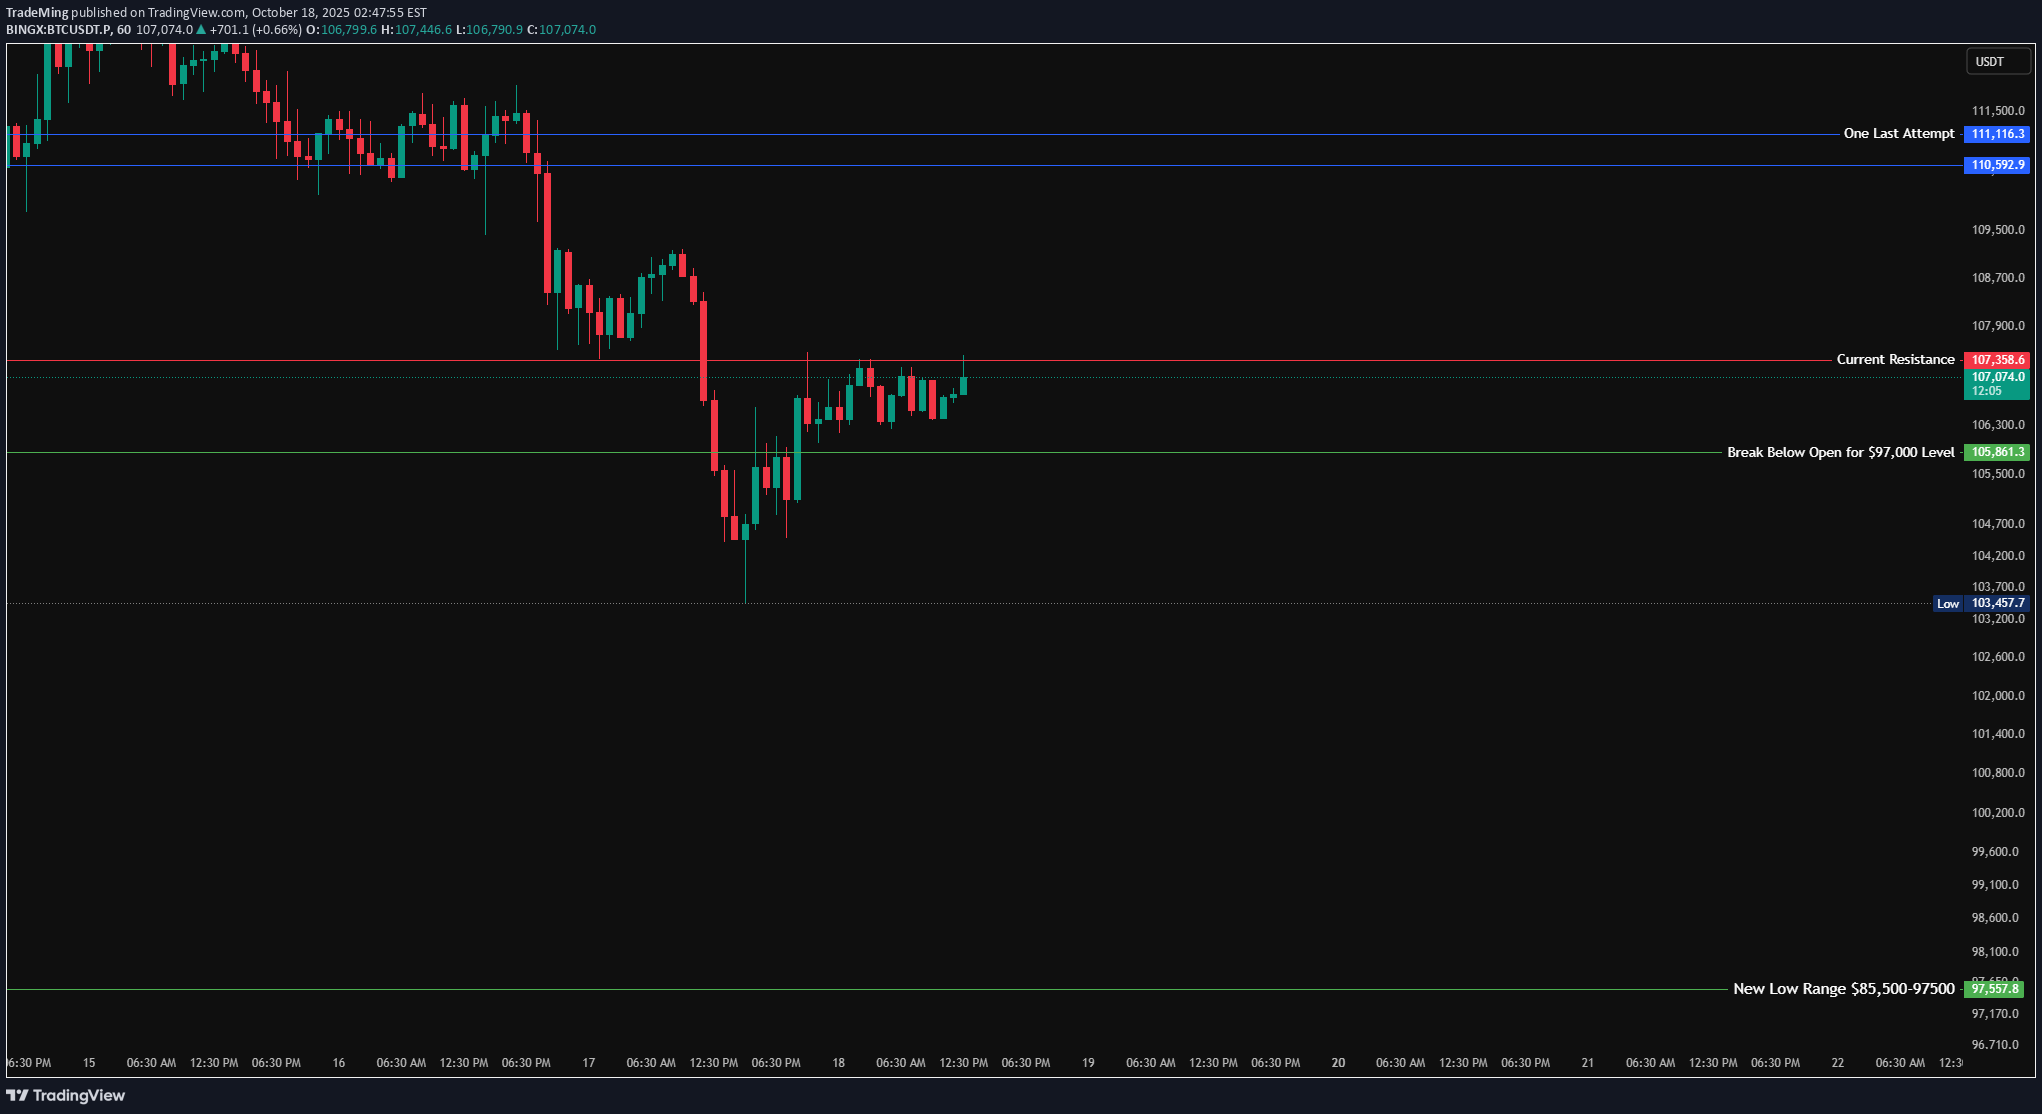
BTCUSD BTCUSD BTCUSD BTCUSD BTCUSD BTCUSD BTCUSD BTCUSDT BTCUSDT.P BTCUSDT.P BTCUSD.P BTCUSDT.P BTCUSDT.P BTCUSDT.P BTCUSD.P BTCUSD.P BTCUSDT.P BTCUSD.P BTCUSD.P BTCUSD.P BTCUSD.P BTCUSDC.P BTCUSDT.P BTCUSD.PM BTCUSDC.P BCHUSDT.P BTCUSDT BTCUSD BTCUSDT BTCUSDT BTCUSD As per current structure At present, the market is showing early signs of a minor recovery attempt after a strong downward continuation. The structure remains bearish overall, but a short-term base appears to have formed around the $103,400 – $105,000 region, where buyers have started to show some absorption. The current candle formation indicates that the price is attempting to stabilize above the $105,861 level, which I’ve marked as the “Break Below Open for $97,000 Level.” This level now acts as a short-term pivot — maintaining above it could give the market a bit of breathing room, but a confirmed close below it would reopen the path toward the $97,000 zone, and potentially even deeper into the New Low Range ($85,500 – $97,500). On the upside, $107,358 stands as the immediate Current Resistance, and the price action here will be crucial. This is where sellers previously regained control, leading to the recent sell-off. Unless the market breaks and sustains above this resistance, the broader structure will continue to favor the downside. Above that, the $110,592 – $111,116 zone — labeled “One Last Attempt” — represents the critical ceiling for this entire move. If buyers manage to reclaim this range and hold, it could signal a stronger reversal impulse or a potential short-term bottom. However, as of now, the probability remains lower until we see volume-backed confirmation and a clear higher high on lower timeframes. In summary, the market is currently consolidating within a recovery range between $105,800 and $107,300, showing limited bullish momentum. Any rejection here would likely bring sellers back into play, targeting the next leg toward $103,400 first, and eventually $97,500 if momentum continues. 🧭 Summary: One Last Attempt Zone: $111,116 – $110,592 Current Resistance: $107,358 Break Below Level: $105,861 Immediate Support: $103,457 New Low Range: $97,568 – $85,500 Market Tone: Bearish-to-neutral; short-term consolidation phase within broader downtrend. Bias: Bearish below $107,358; only a breakout above $110,600 may change short-term momentum. Key Focus: Reaction near $105,800 – $107,300 — this will determine if the market builds strength for a retest toward $110K or rolls over for a fresh breakdown toward $97K.
TradeMing
تحلیل بازار بیت کوین: سقوط زیر ۱۰۰ هزار دلار و سطح حمایتی جدید کجاست؟
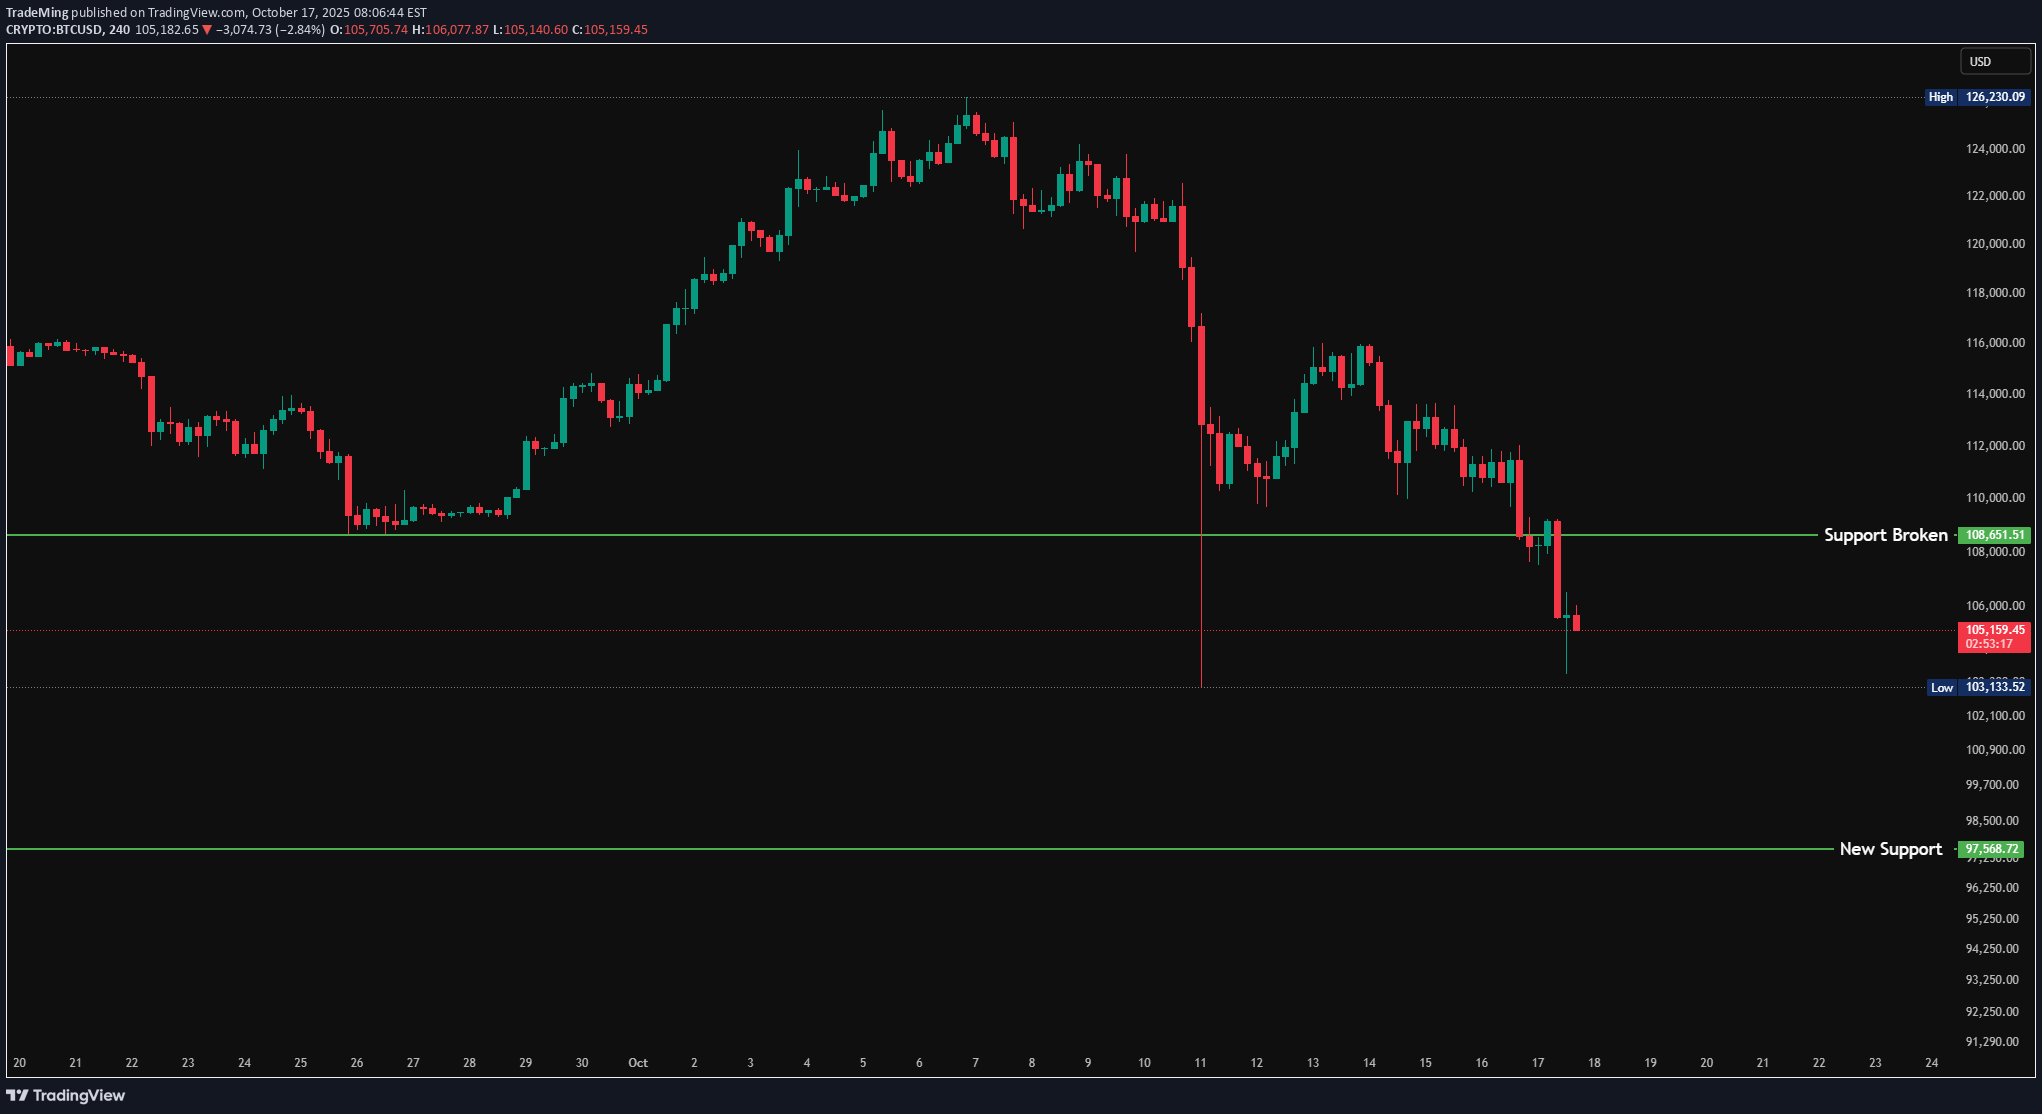
BTCUSD BTCUSD BTCUSD BTCUSD BTCUSD BTCUSD BTCUSD BTCUSDT BTCUSDT.P BTCUSDT.P BTCUSD.P BTCUSDT.P BTCUSDT.P BTCUSDT.P BTCUSD.P BTCUSD.P BTCUSDT.P BTCUSD.P BTCUSD.P BTCUSD.P BTCUSD.P BTCUSDC.P BTCUSDT.P BTCUSD.PM BTCUSDC.P BCHUSDT.P Market Analysis: BTC The market has recently shown a clear breakdown below the previously established support zone around $108,651, confirming a short-term shift in sentiment from bullish to bearish. This breakdown indicates that buyers failed to defend a key level that had previously acted as a strong base for upward moves, suggesting that sellers have now regained control of the short-term market momentum. Following the break of support, the price has continued to trade below the zone with limited signs of immediate recovery. The current candle structure reflects sustained pressure from the sell-side, with only a minor lower wick indicating an attempt by buyers to absorb liquidity after the initial flush. However, unless the price quickly reclaims and sustains above $108,651, this region will likely act as a new resistance zone, capping any short-term recovery rallies. The next key area of interest now lies around the $97,568 support zone, which serves as the next major liquidity base and potential demand region. This level has historical importance and could attract fresh buying interest if price continues to decline in the coming sessions. A test of this zone could provide the market with the potential to form a temporary bottom or an accumulation structure before any meaningful bounce. In the bigger picture, this structure represents a confirmed short-term breakdown phase within what appears to be a broader distribution range. The failure to hold the previous support is often a precursor to further downside continuation unless strong reversal evidence emerges. Therefore, until the market reclaims $108,651 convincingly, the bias remains bearish to cautiously neutral. 🧭 Summary: Previous Support (Now Resistance): $108,651 New Major Support Zone: $97,568 Market Tone: Bearish; breakdown confirmed below key structure. Bias: Bearish unless reclaimed above $108,651. Key Focus: Watch for market reaction around $105,000–$106,000; sustained weakness here could accelerate the move toward $97,500.
Disclaimer
Any content and materials included in Sahmeto's website and official communication channels are a compilation of personal opinions and analyses and are not binding. They do not constitute any recommendation for buying, selling, entering or exiting the stock market and cryptocurrency market. Also, all news and analyses included in the website and channels are merely republished information from official and unofficial domestic and foreign sources, and it is obvious that users of the said content are responsible for following up and ensuring the authenticity and accuracy of the materials. Therefore, while disclaiming responsibility, it is declared that the responsibility for any decision-making, action, and potential profit and loss in the capital market and cryptocurrency market lies with the trader.