Technical analysis by TradeMing about Symbol BTC on 10/21/2025

TradeMing
بیت کوین در آستانه سقوط یا جهش؟ تحلیل سطح حمایت حیاتی BTC
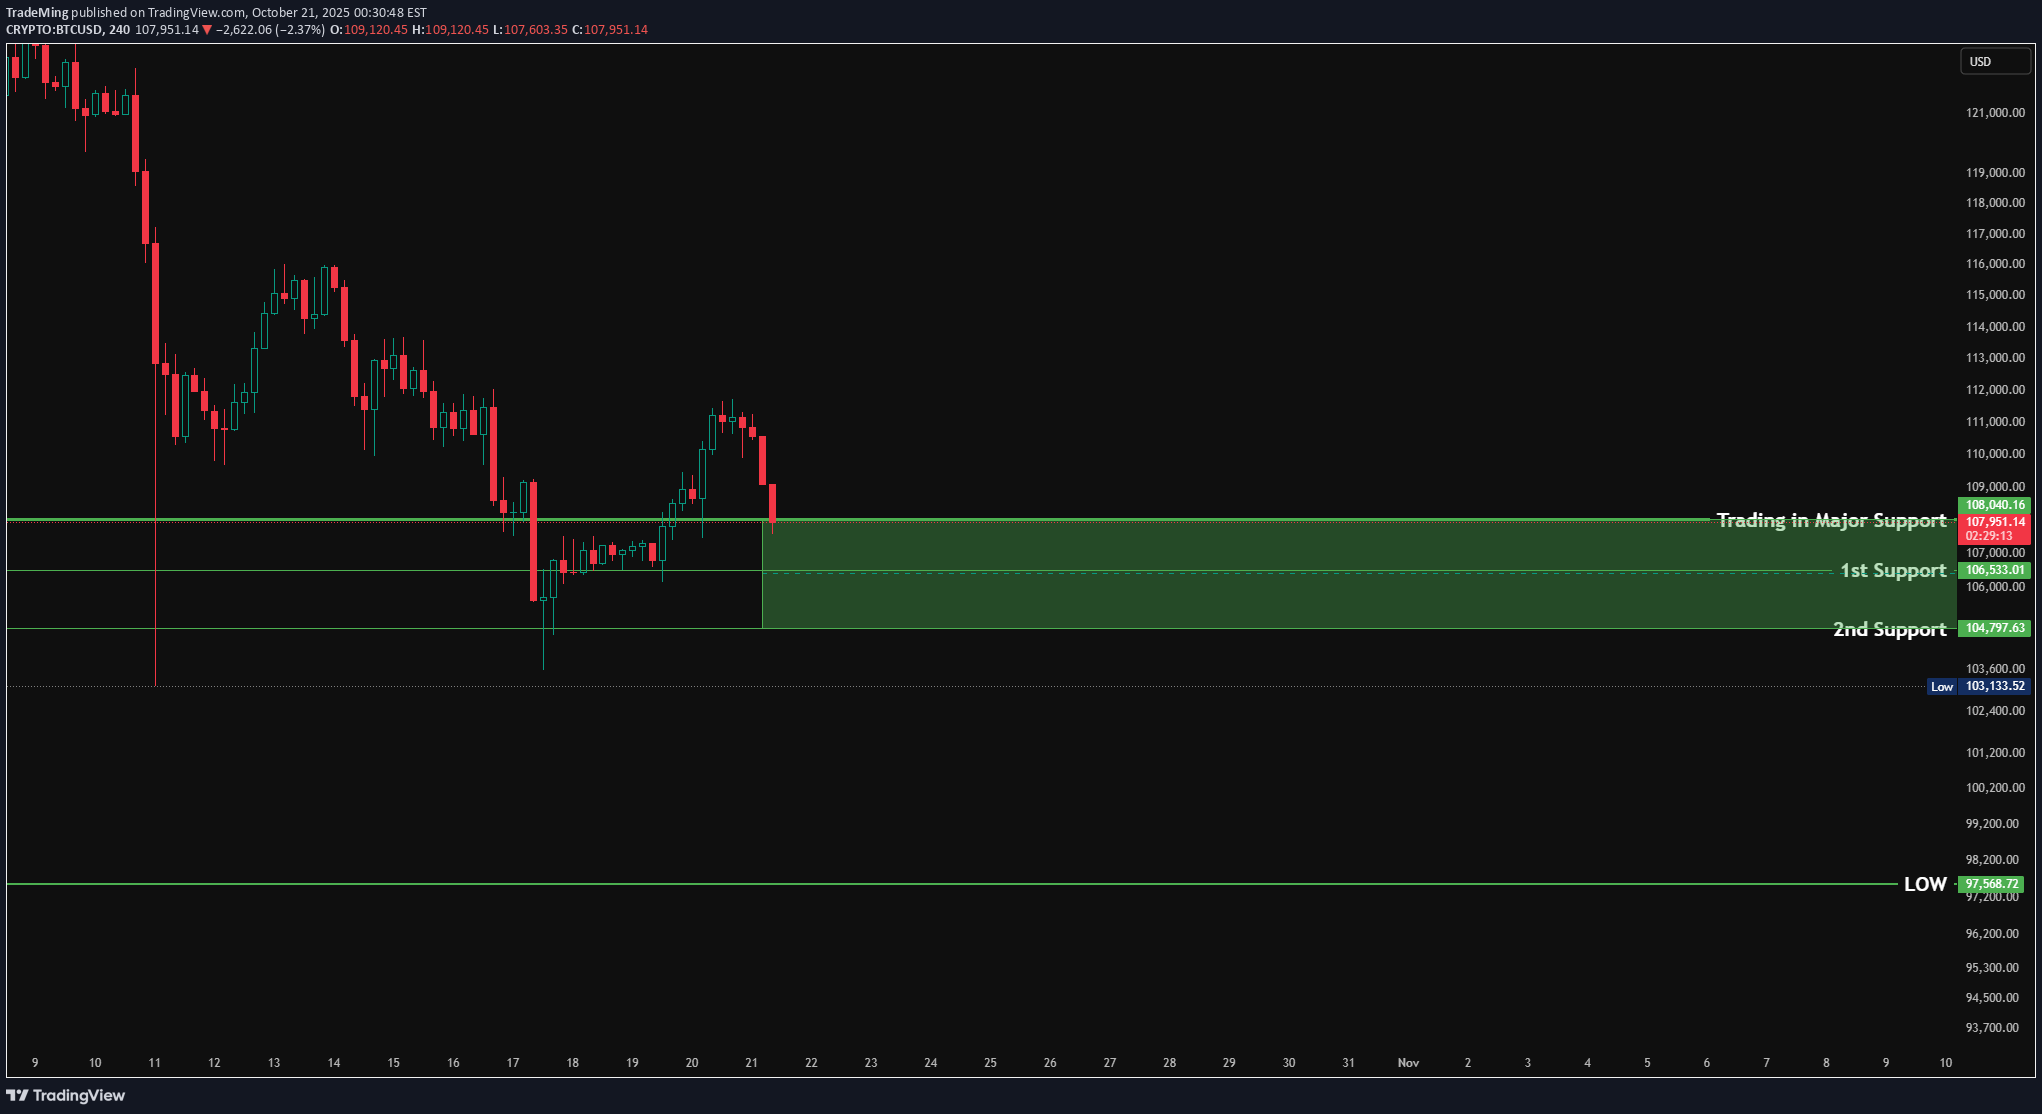
BTCUSD BTC Market Analysis BTC is presently trading within its major support zone, finding footing after a sharp pullback that brought price right back into the key demand region between $108,040 and $106,533. This area has historically acted as a strong reaction zone, and once again, price seems to be stabilizing here, with short-term candles showing signs of base formation. Over the past few sessions, BTC has been moving in a sideways consolidation range roughly between $108,000 and $104,700, suggesting that the market is pausing to absorb recent volatility. This range represents the short-term balance point — buyers are stepping in around the lower end while sellers remain active near the top. At the moment, BTC is trading around the upper half of this range, hovering just above the 1st support at $106,533, which continues to hold well. A sustained defense of this level would be the first sign that buyers are quietly regaining control, possibly preparing for a rebound toward the upper boundary near $108,000 – $109,000. However, the 2nd support at $104,707 remains the real line in the sand. A decisive close below that would indicate weakness extending beyond a simple consolidation — possibly reopening the door for a deeper retest toward the $97,568 major low zone, which aligns with the broader structural support from previous swing cycles. On the flip side, if BTC manages to stay steady and reclaim ground above $108,000, it would indicate the start of a short-term recovery phase. That could bring price back toward $110,000–$111,000, where the next supply cluster sits. But until a clear breakout is seen, the market remains range-bound and cautious. In short, BTC is trying to build a base here. The structure looks like accumulation within a broader correction, and how the market reacts around this $106K–$104K range will define whether this is a genuine bottoming phase or just a pause before another leg down. 🧭 Key Levels & Outlook: Major Support Zone: $108,040 – $106,533 Consolidation Range: $108,000 – $104,700 1st Support: $106,533 (active defense zone) 2nd Support: $104,707 (critical structural base) Next Downside Target (if breakdown): $97,568 – $98,262 Market Tone: Cautiously neutral — sideways consolidation at major support. Bias: Constructive above $106,500; bearish confirmation only below $104,700. Key Focus: Watch for breakout above $108,000 for signs of relief rally; a daily close under $104,700 could accelerate downside momentum.