Technical analysis by TradeMing about Symbol BTC on 10/18/2025

TradeMing
تحلیل بیت کوین: آیا بازیابی موقت است یا سقوط به زیر ۹۷ هزار دلار؟
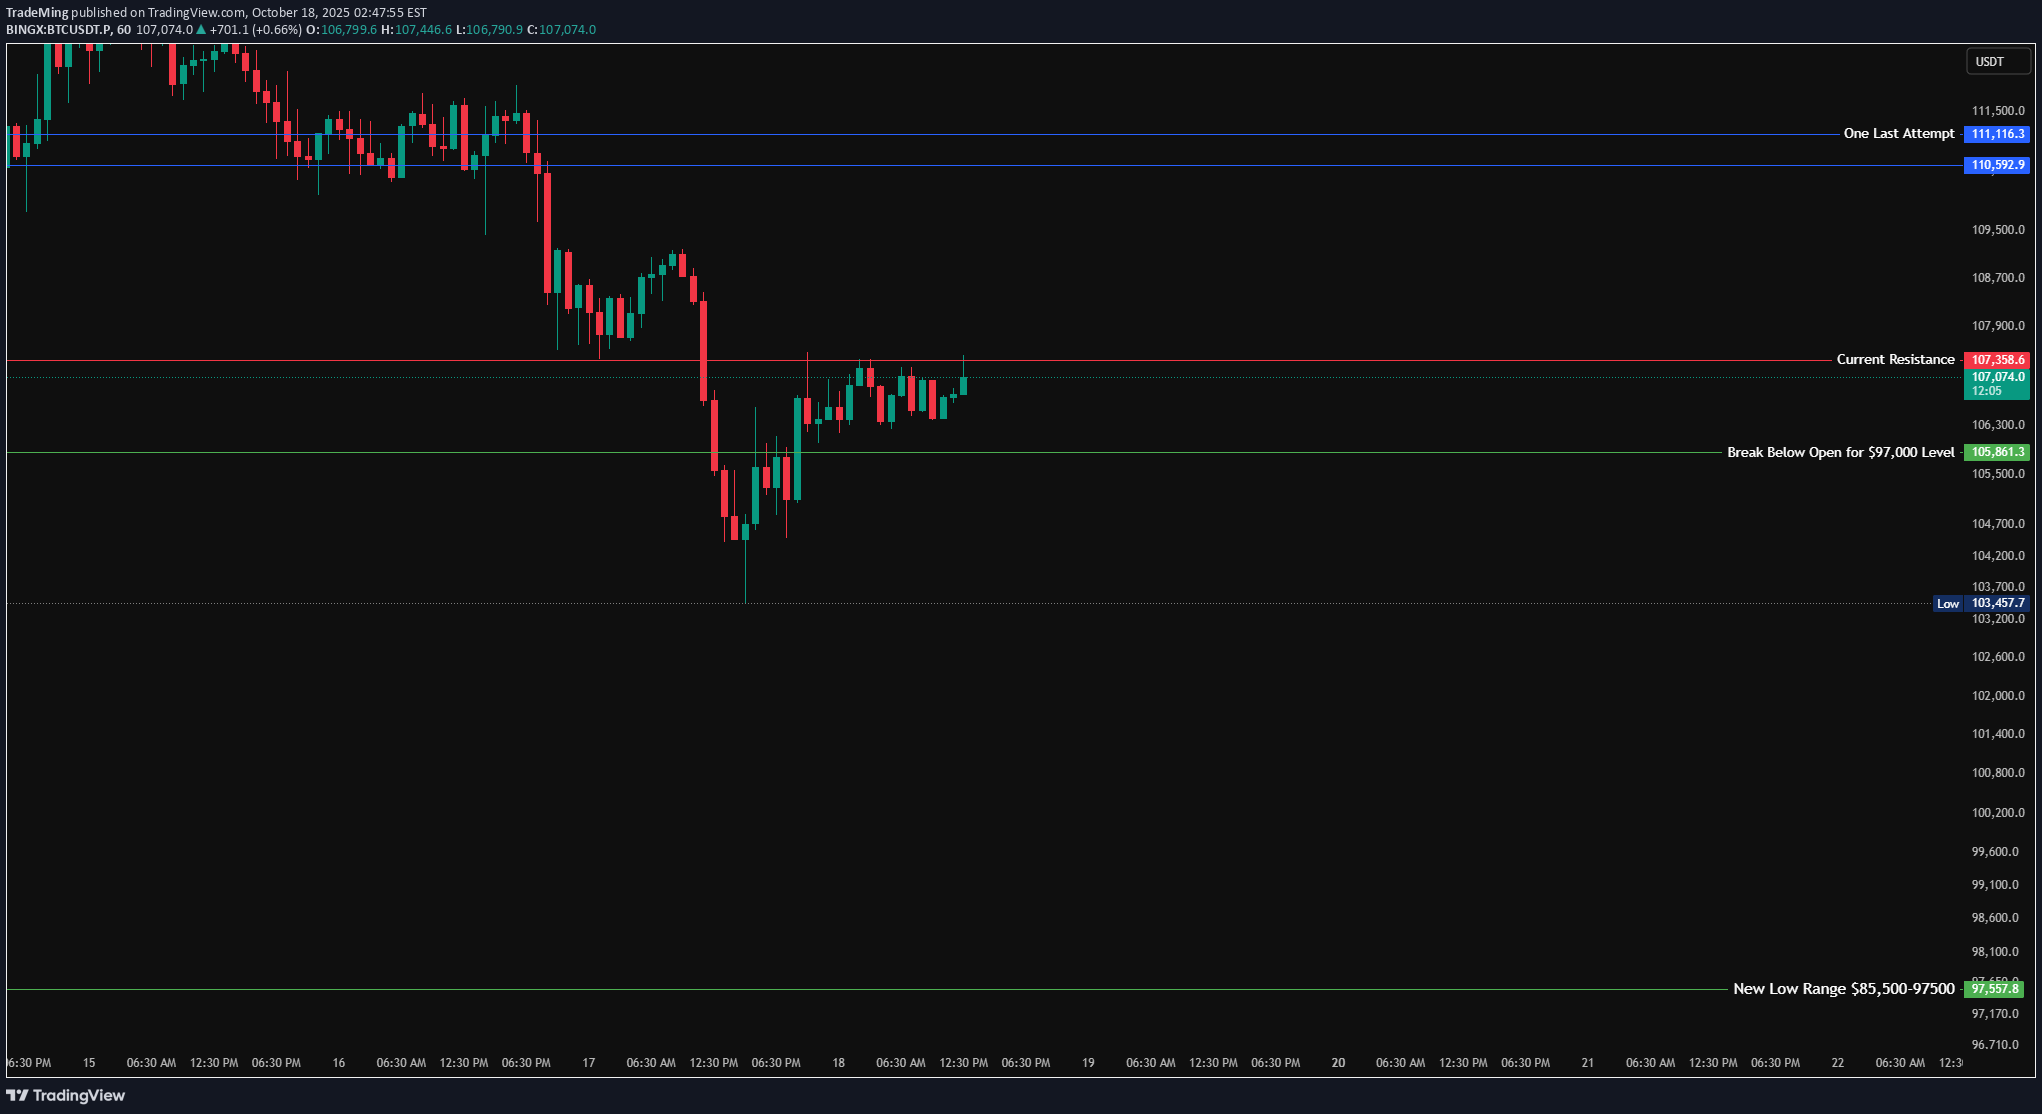
BTCUSD BTCUSD BTCUSD BTCUSD BTCUSD BTCUSD BTCUSD BTCUSDT BTCUSDT.P BTCUSDT.P BTCUSD.P BTCUSDT.P BTCUSDT.P BTCUSDT.P BTCUSD.P BTCUSD.P BTCUSDT.P BTCUSD.P BTCUSD.P BTCUSD.P BTCUSD.P BTCUSDC.P BTCUSDT.P BTCUSD.PM BTCUSDC.P BCHUSDT.P BTCUSDT BTCUSD BTCUSDT BTCUSDT BTCUSD As per current structure At present, the market is showing early signs of a minor recovery attempt after a strong downward continuation. The structure remains bearish overall, but a short-term base appears to have formed around the $103,400 – $105,000 region, where buyers have started to show some absorption. The current candle formation indicates that the price is attempting to stabilize above the $105,861 level, which I’ve marked as the “Break Below Open for $97,000 Level.” This level now acts as a short-term pivot — maintaining above it could give the market a bit of breathing room, but a confirmed close below it would reopen the path toward the $97,000 zone, and potentially even deeper into the New Low Range ($85,500 – $97,500). On the upside, $107,358 stands as the immediate Current Resistance, and the price action here will be crucial. This is where sellers previously regained control, leading to the recent sell-off. Unless the market breaks and sustains above this resistance, the broader structure will continue to favor the downside. Above that, the $110,592 – $111,116 zone — labeled “One Last Attempt” — represents the critical ceiling for this entire move. If buyers manage to reclaim this range and hold, it could signal a stronger reversal impulse or a potential short-term bottom. However, as of now, the probability remains lower until we see volume-backed confirmation and a clear higher high on lower timeframes. In summary, the market is currently consolidating within a recovery range between $105,800 and $107,300, showing limited bullish momentum. Any rejection here would likely bring sellers back into play, targeting the next leg toward $103,400 first, and eventually $97,500 if momentum continues. 🧭 Summary: One Last Attempt Zone: $111,116 – $110,592 Current Resistance: $107,358 Break Below Level: $105,861 Immediate Support: $103,457 New Low Range: $97,568 – $85,500 Market Tone: Bearish-to-neutral; short-term consolidation phase within broader downtrend. Bias: Bearish below $107,358; only a breakout above $110,600 may change short-term momentum. Key Focus: Reaction near $105,800 – $107,300 — this will determine if the market builds strength for a retest toward $110K or rolls over for a fresh breakdown toward $97K.