
TradeM_Gold_I
@t_TradeM_Gold_I

What symbols does the trader recommend buying?
Purchase History
پیام های تریدر
Filter
GOLD PLAN TODAY DEC 31, 2025 | XAUUSD LAST DAY OF 2025
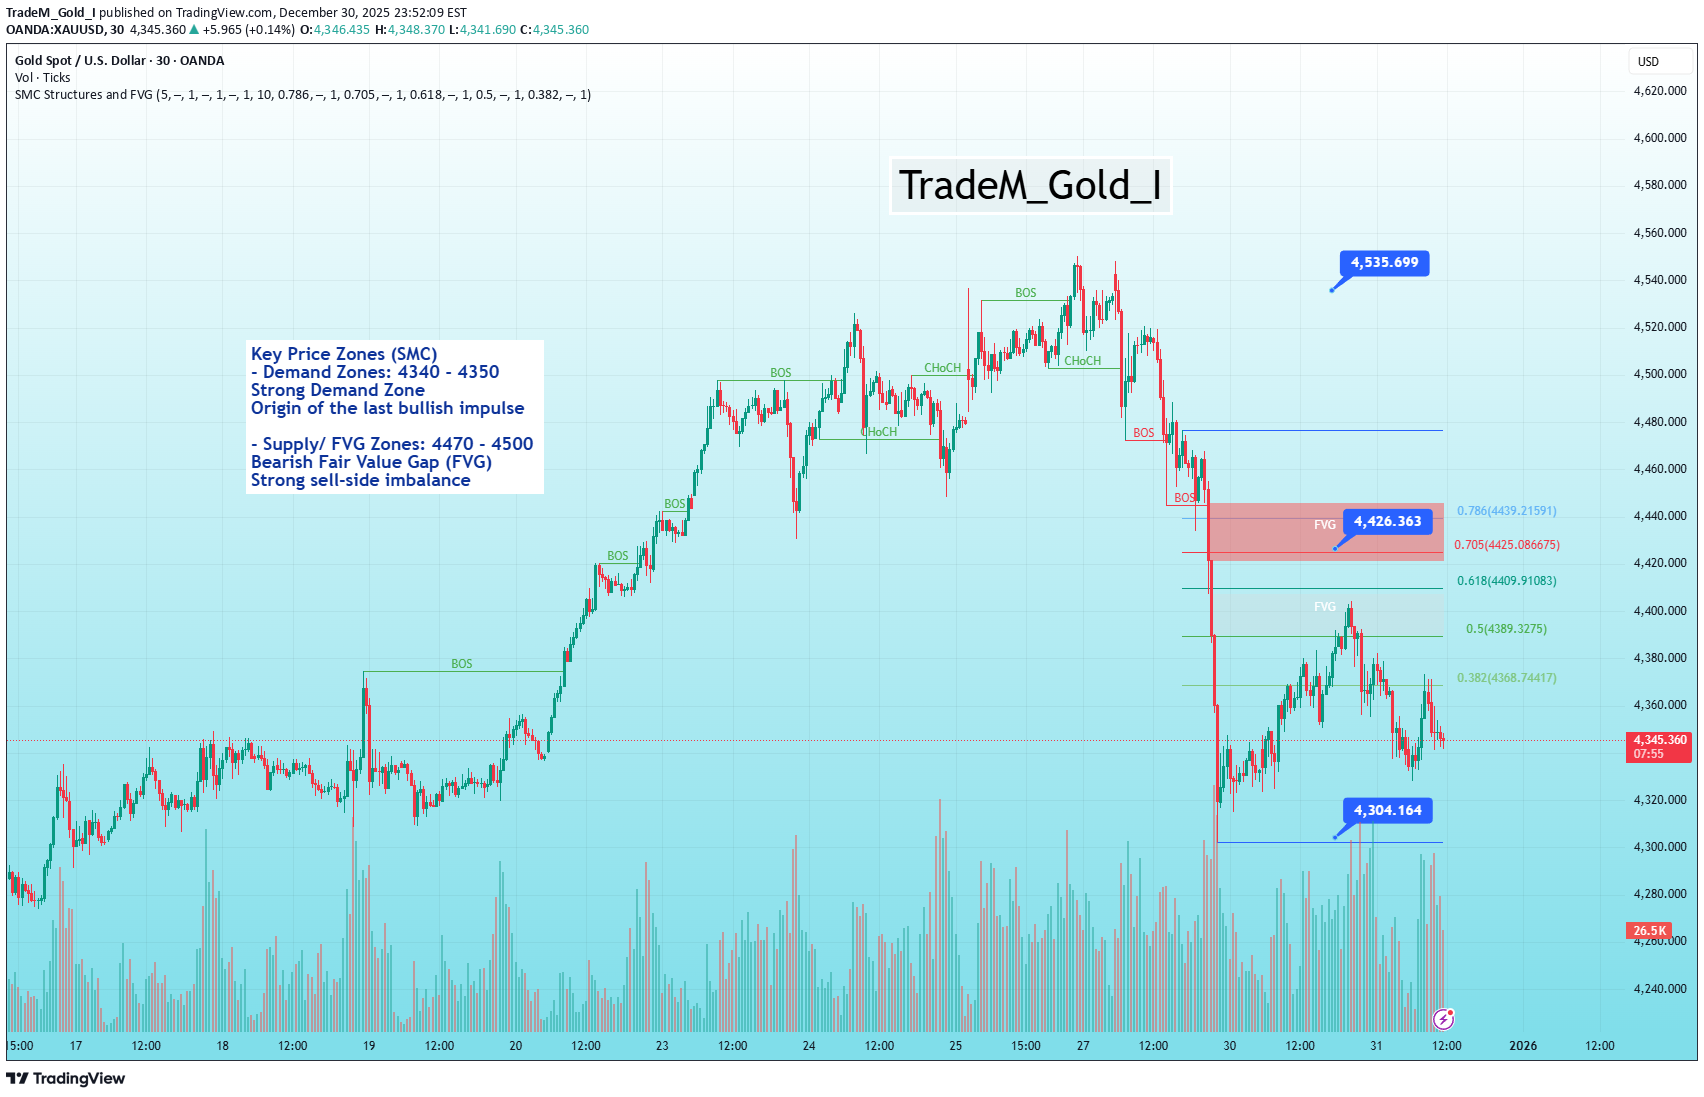
☄️ Gold Market Outlook 12/ 31 (Based on SMC) ☄️ 📊Market Structure Overview 🔤After a strong bullish expansion with multiple BOS (Break of Structure) to the upside, Gold has experienced a sharp sell-off, creating a clear bearish displacement. 🔤The recent drop broke the last bullish structure, confirming a bearish BOS. 🔤Prior to the sell-off, the market showed a HoCH (Change of Character) near the top, signaling smart money distribution. 🔤Price is now trading below previous bullish demand, indicating a shift from bullish continuation to corrective / bearish phase. 💡Trading Scenarios 🔼Scenario 1: Buy from Demand (Counter-trend) 🔤Entry: 4330 – 4340 🔤Reasoning Price reacted strongly from demand Selling momentum is slowing This move is considered a pullback after bearish BOS 🔤Entry Condition Bullish CHoCH on lower timeframe (M15–M5) Hold above demand with rejection wicks 🔽Scenario 2: Sell from Bearish FVG (High Probability) 🔤Entry: 4470 – 4500 🔤Reasoning Clear bearish BOS already confirmed This zone aligns with premium area + bearish FVG Ideal location for trend continuation shorts 🔤Entry Condition Price retraces into FVG Bearish rejection or CHoCH on lower timeframe ⚠️Scenario 3: Range Continuation / No Trade Range: 4340 – 4470 Reasoning Market may consolidate after high volatility Smart money may accumulate positions Action Stand aside Wait for a clear BOS or CHoCH before entering Disclaimer: All content and signals shared are for general guidance and informational purposes only. This information should not be considered a substitute for certified financial advice. We assume no responsibility for any outcomes or consequences (positive or negative) that may arise from the use of these signals. All members are strongly encouraged to consult with their own qualified experts or advisors before making any trading decisions.
BTCUSD PLAN TODAY DEC 31, 2025 | BITCOIN LAST DAY OF 2025
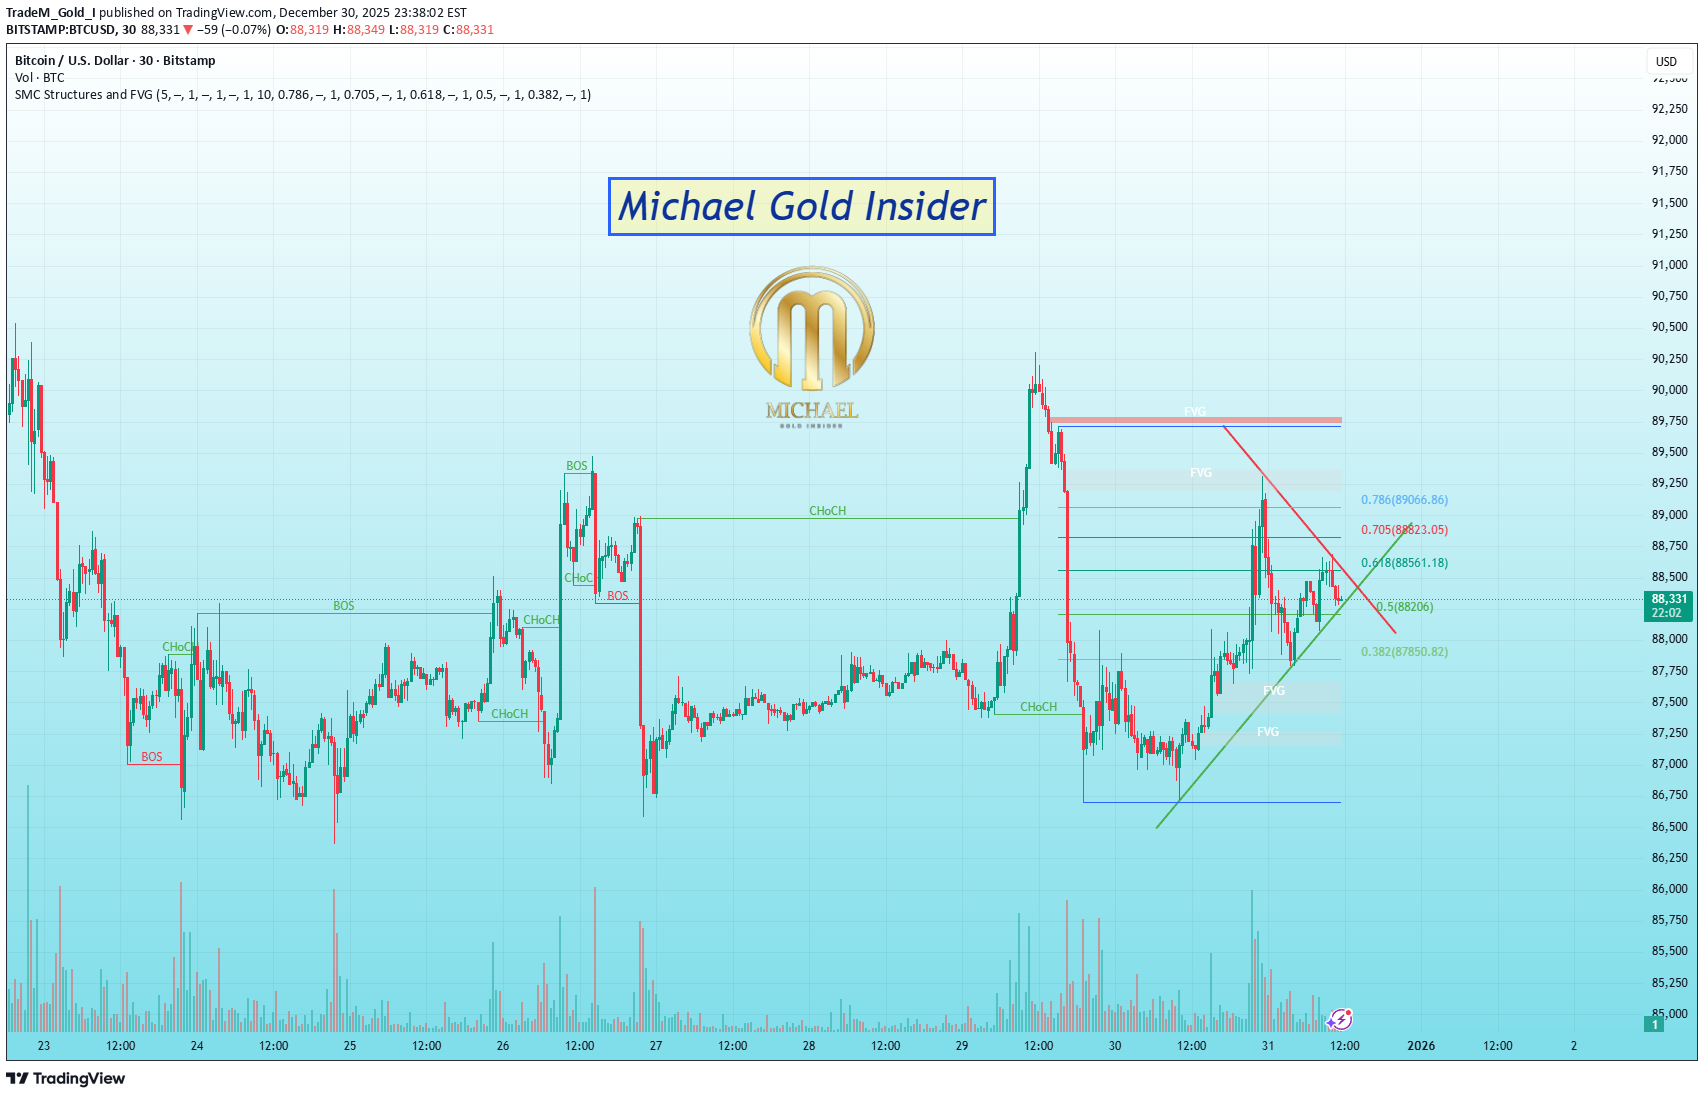
1. Market Structure & Trend Analysis Overall Context: The chart shows a period of high volatility with several CHoCH (Change of Character) and BOS (Break of Structure) signals. Current Momentum: After a sharp decline from the $89,750 peak, the price found support near $86,750 and is currently in a recovery phase. Current Price: $88,346, trading near the equilibrium point of the recent swing. 2. Key Technical Levels Supply Zone (Red FVG): There is a clear Fair Value Gap (FVG) and supply area between $89,500 and $89,750. This acted as the origin of the recent aggressive sell-off. Demand Zone (Blue Level): The base near $86,750 represents the recent swing low and a significant zone where buyers stepped in. Fibonacci Retracement: 0.618 Level ($88,561): Price is currently battling this "Golden Ratio" area. A rejection here suggests a bearish continuation. 0.705 - 0.786 ($88,823 - $89,066): This is the Optimal Trade Entry (OTE) for shorts. If the price rallies into this zone, expect heavy resistance. 3. Support and Resistance Summary Major Resistance ($89,500 - $89,750): Premium Supply zone and the origin of the bearish move. Pivot Level ($88,206): The 0.5 Fibonacci level, acting as the mid-point of the current range. Immediate Support ($87,850): The 0.382 Fibonacci level where price may find short-term buyers. Major Support ($86,750): The recent swing low and the primary Discount Demand Zone. 4. Trading Outlook Bearish Scenario: If the price fails to hold above the $88,500 (0.618 Fib) area and shows a bearish rejection (wicking), it is likely to retest the lower demand zone at $86,750. Bullish Scenario: To flip bullish, BTC needs to close decisively above $89,100 to fill the upper FVG and invalidate the current bearish structure. This would open the door for a retest of the $90,000+ psychological level. Disclaimer: All content and signals shared are for general guidance and informational purposes only. This information should not be considered a substitute for certified financial advice. We assume no responsibility for any outcomes or consequences (positive or negative) that may arise from the use of these signals. All members are strongly encouraged to consult with their own qualified experts or advisors before making any trading decisions.
پیشبینی بیت کوین ۳۰ دسامبر ۲۰۲۵: آیا ریزش به ۶۸ هزار دلار ادامه دارد؟
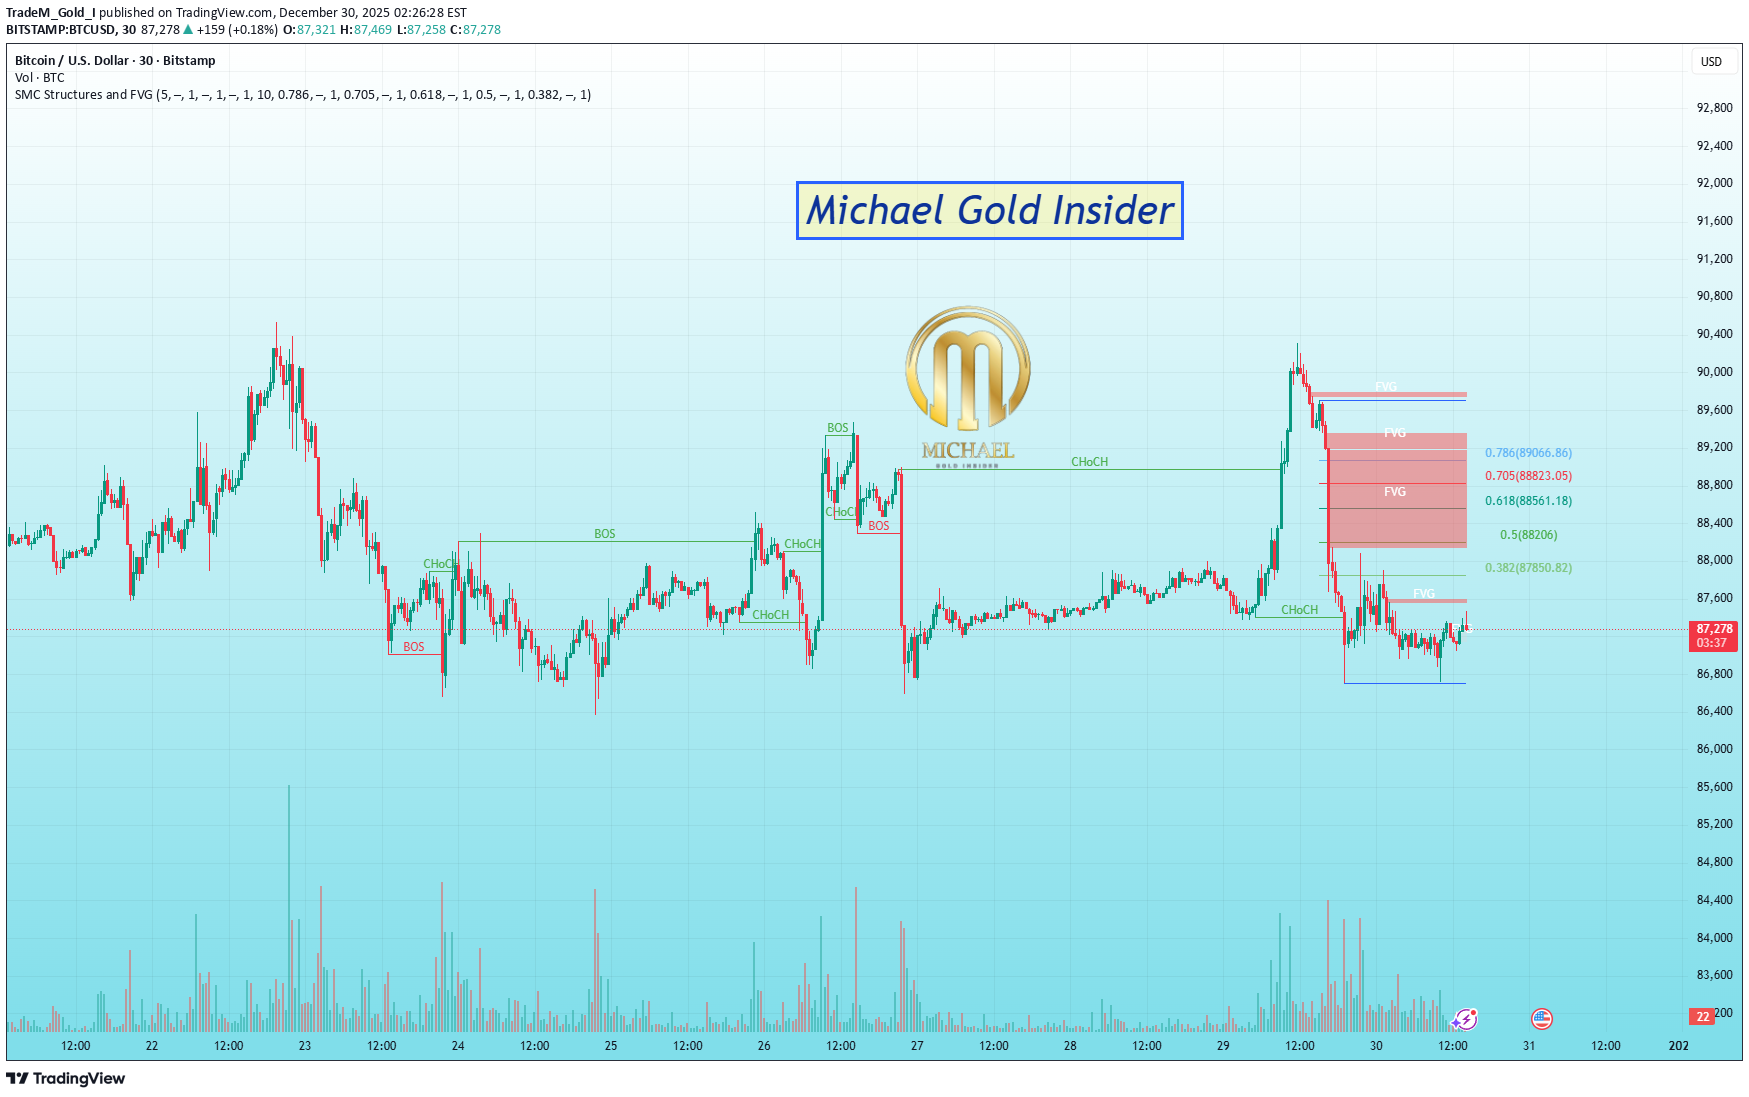
BTC Outlook Today Dec 30, 2025 1. Market Structure Analysis The price action shows a highly volatile environment with frequent shifts in momentum: Recent Bullish Impulse: Price experienced a sharp rally toward the $90,000 psychological level, creating a CHoCH (Change of Character) to the upside and breaking previous resistance levels. The Sharp Reversal: After peaking near $90k, the market saw a rapid decline, breaking local structures to the downside. Current State: Price is currently consolidating near a local bottom around $87,266. It is hovering just below a minor bullish Fair Value Gap (FVG), indicating a struggle between buyers and sellers at this level. 2. Key Technical Indicators Fair Value Gaps (FVG): * Bearish Zones: A large cluster of red FVGs sits between $88,200 and $89,500. This area represents significant "unfilled" sell orders. Bullish Zone: A small teal FVG is visible just above the current price, acting as immediate overhead resistance. Fibonacci Retracement Levels: The Fibonacci tool is drawn from the recent high to the recent low: 0.5 Level ($88,206): Aligns with the start of the heavy bearish FVG. 0.618 Golden Pocket ($88,561): This is the "Premium" zone where institutional sellers are most likely to re-enter. Volume: Significant volume spikes are visible during the recent crash, suggesting that the move was driven by high-conviction selling. 3. Trading Scenarios Scenario A: The Bearish Retest (Higher Probability) Strategy: Wait for price to pull back into the $88,200 – $88,600 zone (0.5 to 0.618 Fib levels). Expectation: Since the overall structure has shifted bearish on this timeframe, a "retest and reject" of these FVGs would provide a high-probability short entry targeting the $86,000 liquidity pool. Scenario B: Consolidation and Breakout Strategy: Monitor the current consolidation range between $86,800 and $87,600. Expectation: If Bitcoin fails to bounce into the premium zones and instead breaks below the recent wick low ($86,800), expect an immediate continuation toward lower support levels. 4. Summary for Traders The trend is currently Bearish following the rejection from the $90k area. The market is "discounted" at the moment, but the most logical move for "Smart Money" is to wait for a retracement into the red FVG zones to distribute more sell orders before the next leg down.
استراتژی طلایی طلا (XAUUSD): ترید بیع/شراء امروز بر اساس ساختار بازار (SMC)
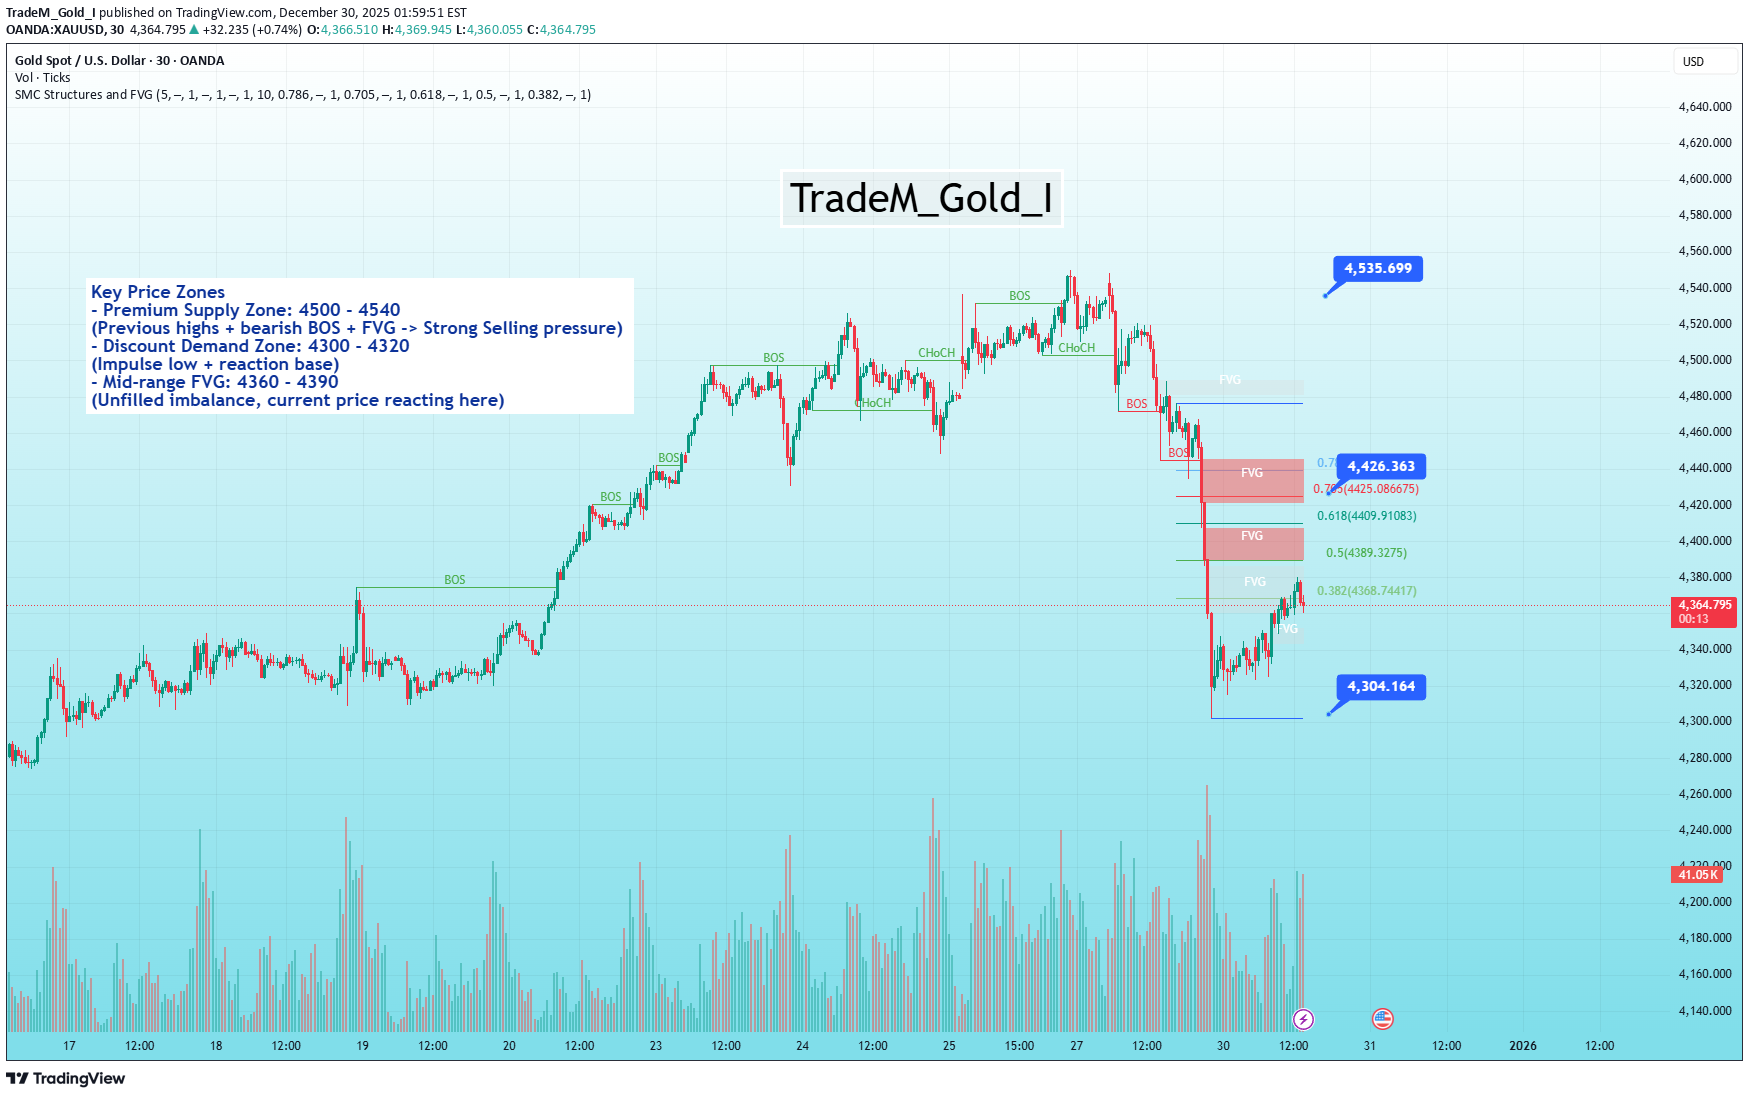
☄️ Gold Market Outlook 12/ 30 (Based on SMC) ☄️ 📊Market Trend 🔤The overall structure shows a clear bullish trend in the previous sessions with multiple BOS to the upside. 🔤However, the most recent move shows a strong bearish impulse, breaking below the last internal higher low, which confirms a bearish CHoCH. 🔤This suggests the market is currently in a corrective/short-term bearish phase within a higher-timeframe bullish context. 💡Trading Scenarios 🔽Scenario 1: Pullback Sell (High Probability) 🔤Bias: Bearish continuation 🔤Condition: Price retraces into H1 / M15 FVG around 4390 – 4420 🔤Confirmation: Bearish CHoCH on M15 Followed by a bearish BOS 🔤Entry: 4390 – 4420 🔤Logic: After bearish CHoCH, smart money often sells from FVG before continuing lower. 🔼Scenario 2: Intraday Buy from Demand 🔤Bias: Short-term bullish reaction 🔤Condition: Price taps into 4300 – 4320 demand zone 🔤Confirmation: Bullish CHoCH on M5/M15 Bullish BOS from the demand zone 🔤Entry: 4300 – 4320 🔤Logic: This zone represents discounted prices after a strong sell-off, suitable for a corrective bounce. 🔼Scenario 3: Trend Continuation Buy (Safer) 🔤Bias: Bullish continuation 🔤Condition: Price reclaims 4420 – 4450 and forms a bullish BOS on H1 🔤Confirmation: Clean BOS above internal structure FVG formed below price 🔤Entry: 4420 – 4450 🔤Logic: Confirms that the bearish move was only a correction within the main bullish trend. Disclaimer: All content and signals shared are for general guidance and informational purposes only. This information should not be considered a substitute for certified financial advice. We assume no responsibility for any outcomes or consequences (positive or negative) that may arise from the use of these signals. All members are strongly encouraged to consult with their own qualified experts or advisors before making any trading decisions.
BTC PLAN NOW | BITCOIN BULLISH TREND DEC 29, 2025
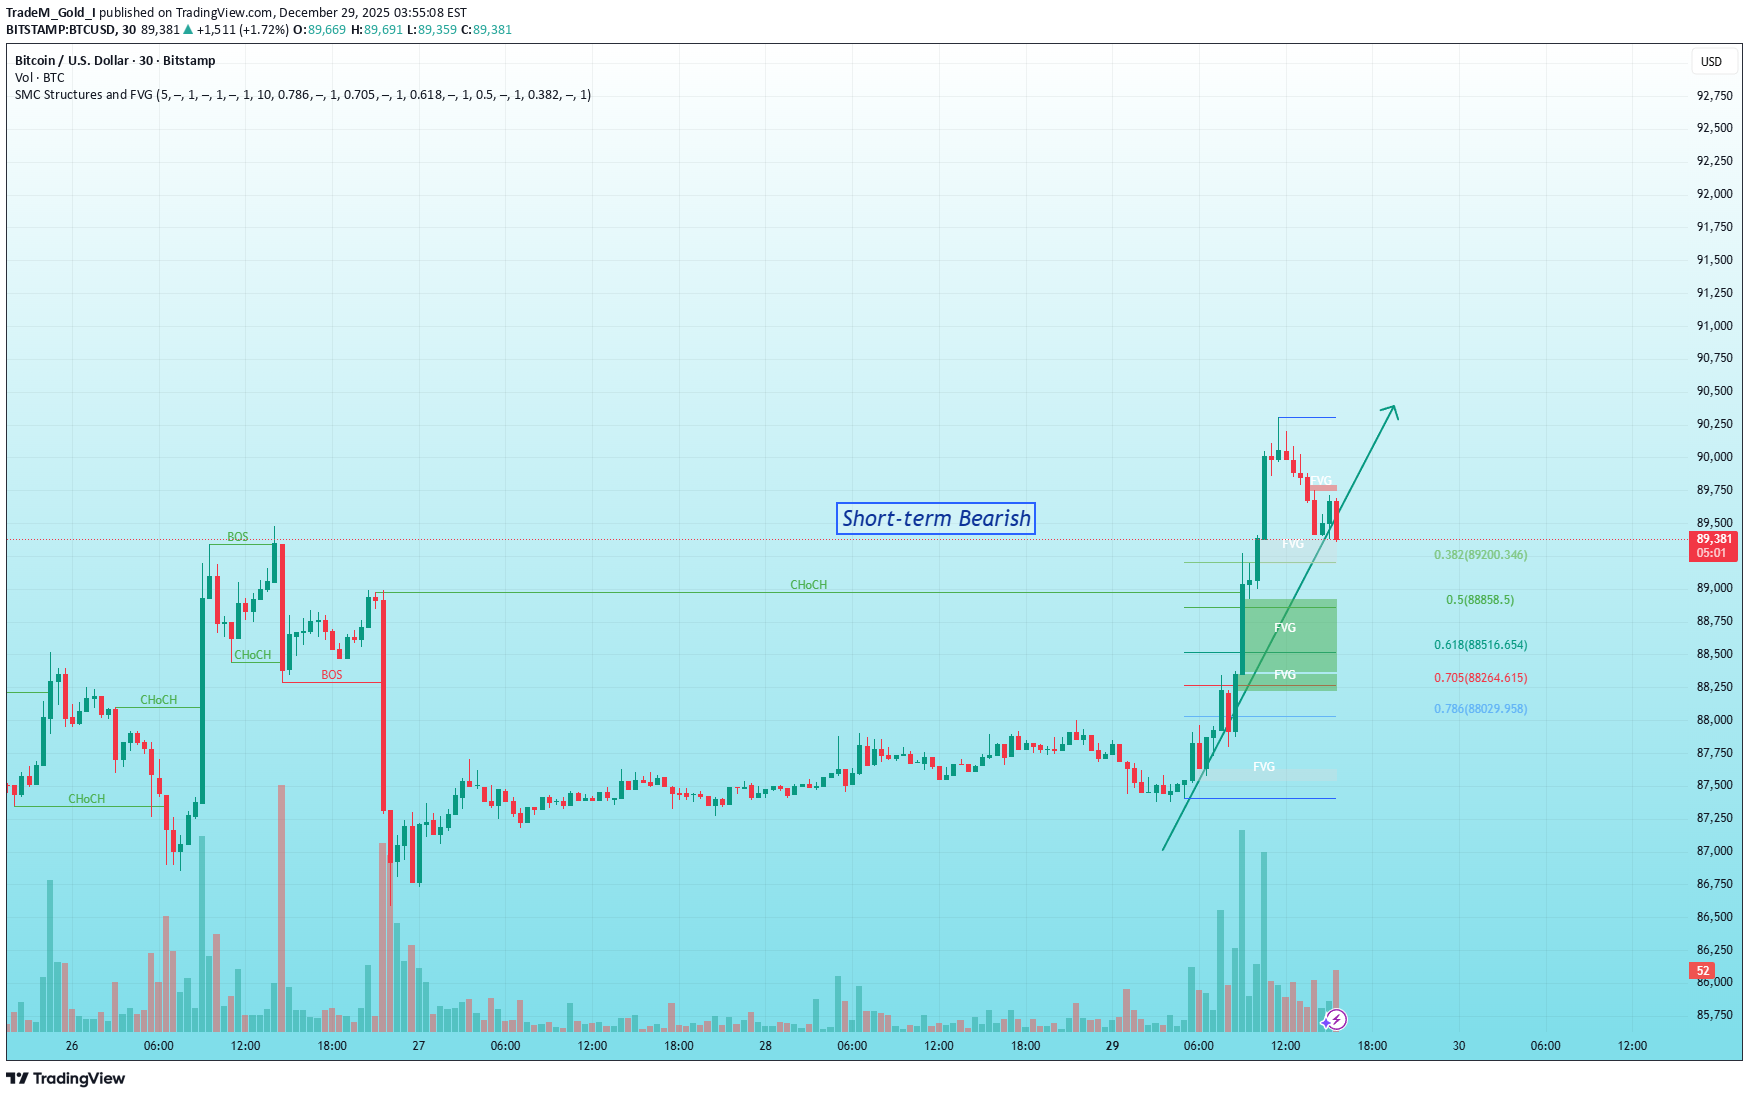
BTC/USD Technical Analysis: The Bullish Shift 1. Market Structure Breakdown The chart highlights a significant transition in Bitcoin's price action. After a Short-term Bearish phase characterized by lower highs, we have officially seen a CHoCH (Change of Character). This break above the previous swing high confirms that the bulls have regained control of the market. 2. The Impulse & Imbalance Following the structural shift, BTC staged a powerful rally toward the $91,936 mark. This aggressive move created multiple FVGs (Fair Value Gaps)—the green shaded areas on your chart. These zones represent "market inefficiency" where price moved too fast, leaving unfilled orders behind. 3. Key Levels & Strategy The Pullback Zone: The current consolidation suggests a retracement is likely. The "Smart Money" entry point lies within the $88,200 - $89,200 range, which aligns with the 0.618 Fibonacci level and the primary FVG. Target Outlook: As long as BTC holds above the $87,500 support, the momentum remains firmly bullish. The next major objective is a clean break and hold above the $92,000 psychological barrier. Disclaimer: All content and signals shared are for general guidance and informational purposes only. This information should not be considered a substitute for certified financial advice. We assume no responsibility for any outcomes or consequences (positive or negative) that may arise from the use of these signals. All members are strongly encouraged to consult with their own qualified experts or advisors before making any trading decisions.
تحلیل امروز بیت کوین: منتظر چه قیمتی برای خرید بمانیم؟ (پیشبینی 26 دسامبر)
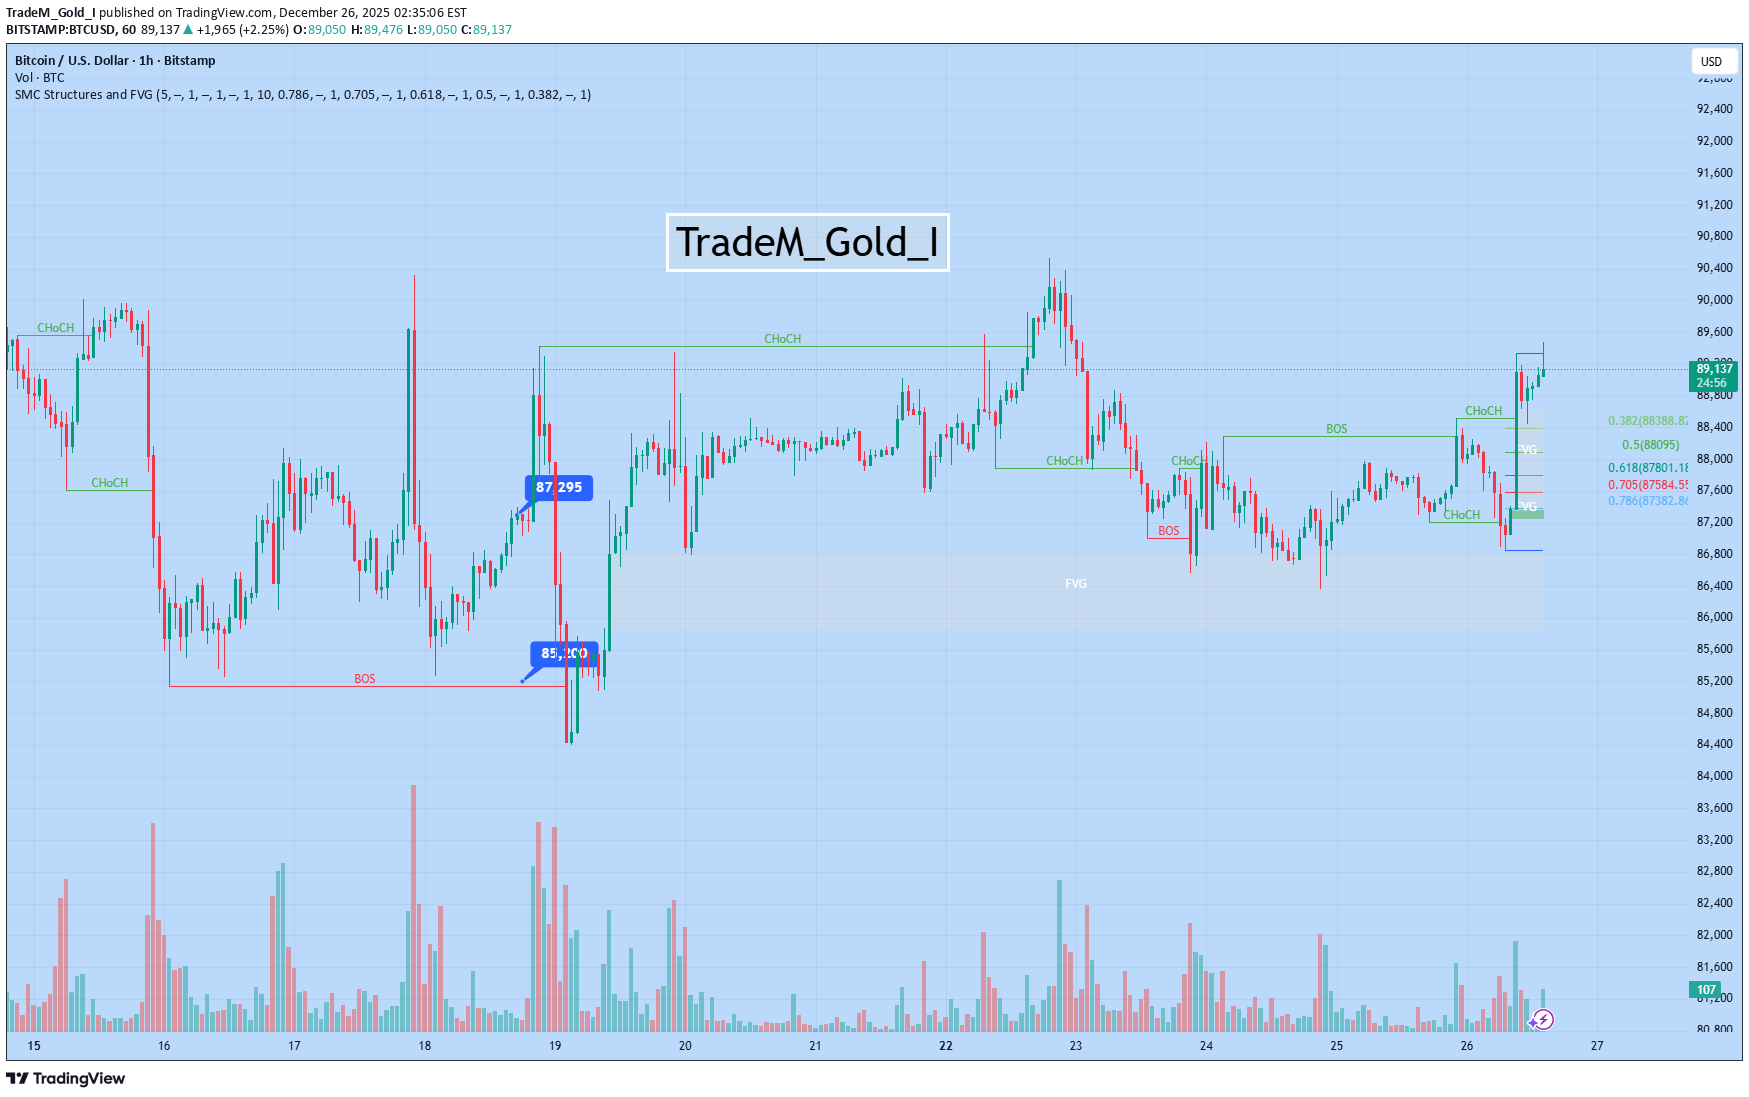
1. Market Structure & Trend The market has recently shifted back into a Bullish Structure on the 1-hour timeframe. BOS (Break of Structure): The recent price action has broken above the previous swing high, marked by the green "BOS" line near 89,352. This indicates that the previous bearish/corrective phase has ended, and the bulls are back in control. CHoCH (Change of Character): Multiple "CHoCH" labels appear on the chart, representing the internal shifts in trend. The most recent bullish CHoCH near the 88,000 level served as the early warning signal that the trend was flipping from bearish to bullish. 2. Key Demand Zones & Fair Value Gaps (FVG) The indicator has identified several areas where "Smart Money" left an imbalance: a) Bullish FVG (Imbalance): There is a small green rectangular zone (FVG) located just below the current price, roughly between 87,200 and 88,000. If the price retraces, this is the primary zone where buyers are expected to step in. b) Discount Array: The Fibonacci levels on the right provide a roadmap for "buying the dip":Equilibrium ($0.5$): 88,163Optimal Trade Entry (OTE - $0.618$ to $0.705$): Between 87,624 and 87,853. 3. Volume and Momentum The volume bars at the bottom show a notable spike during the recent breakout. This suggests "Institutional Participation"—meaning the move above the previous highs is backed by real buying pressure rather than just a "liquidity grab." 4. Trading Outlook & Strategy Current price is hovering near 89,352. Following the SMC logic of "buying pullbacks, not tops," the strategy would be: a) The Bullish Scenario Entry Point: Wait for a retracement into the FVG or the $0.618$ Fibonacci level (~87,853). Stop Loss (SL): Placed below the recent swing low or the $0.786$ Fib level (~87,411). Take Profit (TP): The next major psychological target would be 90,000, followed by a hunt for new all-time highs. b) The Cautionary Scenario If the price fails to hold the 87,000 support level, the bullish structure would be invalidated, and we could see a revisit to the lower liquidity pools near 85,000. Summary: Bitcoin is showing strong bullish momentum after a clean Break of Structure. The most professional approach is to wait for a "discount" price in the 87,600 - 88,100 range before looking for long entries. Disclaimer: All content and signals shared are for general guidance and informational purposes only. This information should not be considered a substitute for certified financial advice. We assume no responsibility for any outcomes or consequences (positive or negative) that may arise from the use of these signals. All members are strongly encouraged to consult with their own qualified experts or advisors before making any trading decisions.
تحلیل طلا (XAUUSD) امروز: نقشه راه صعودی بر اساس ساختار بازار هوشمند (SMC)
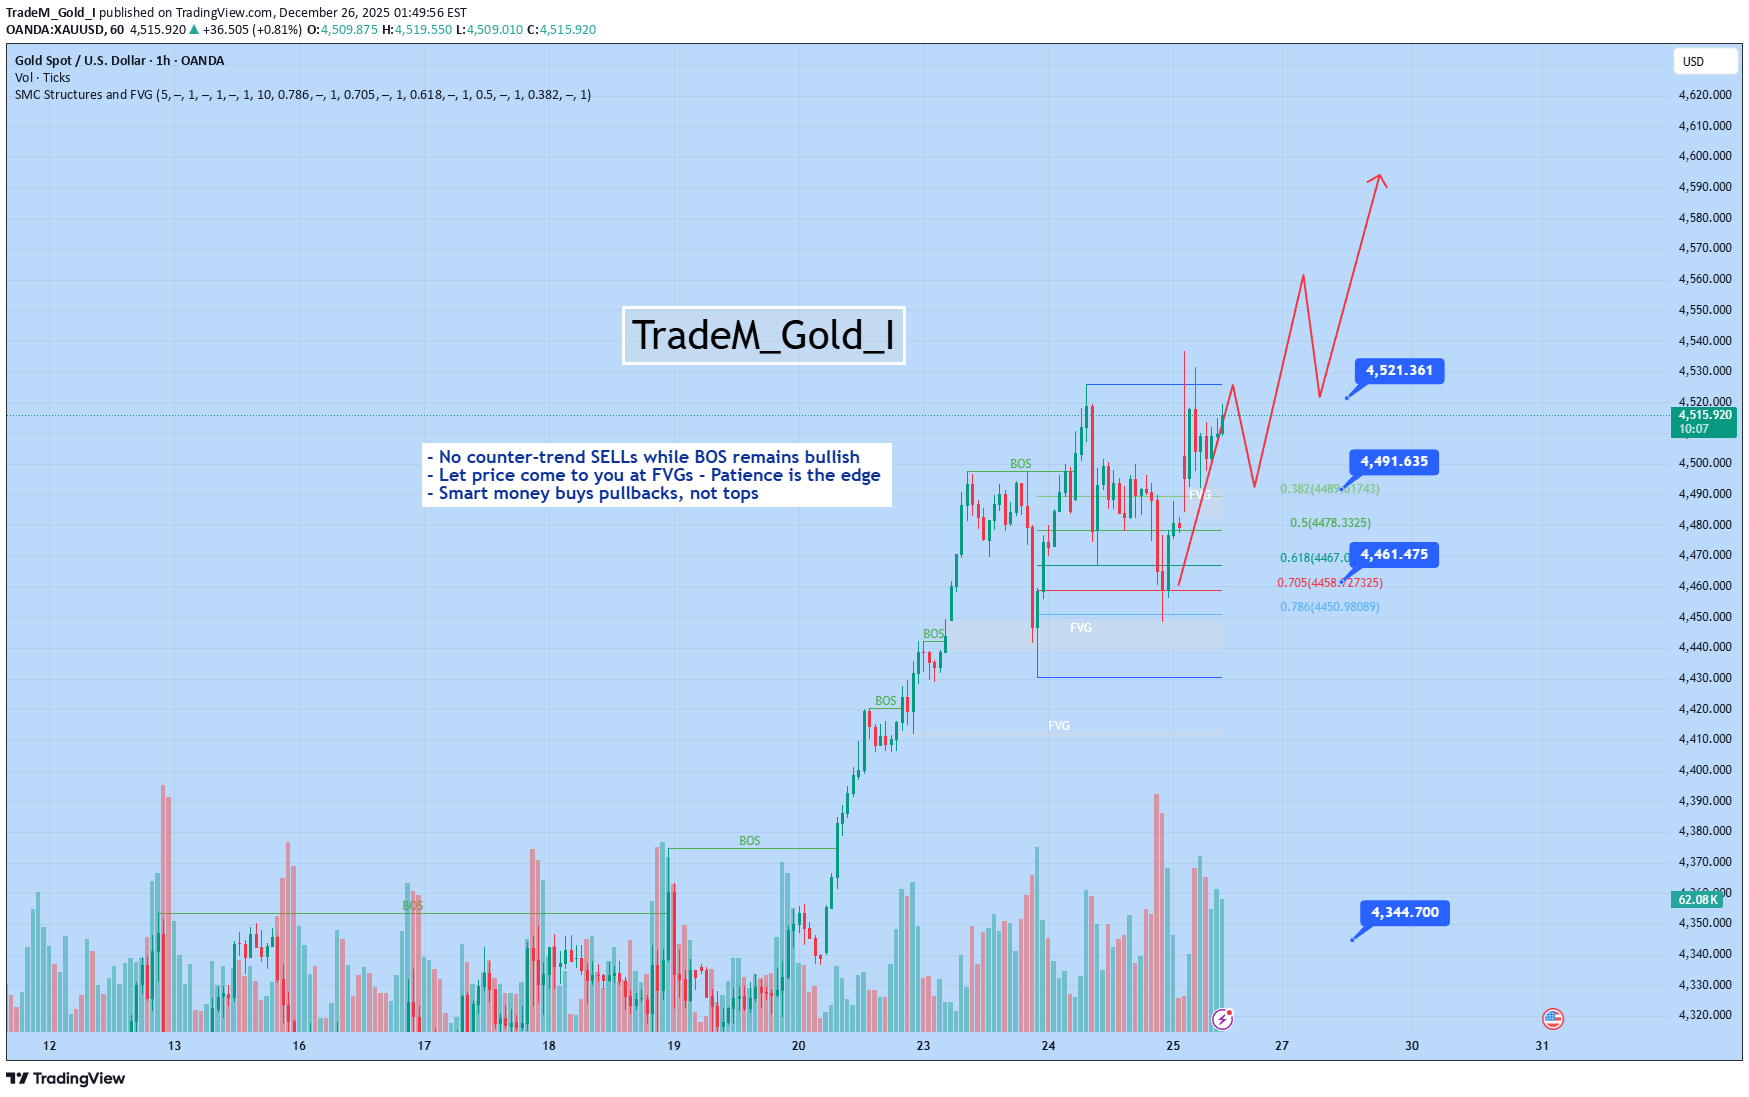
☄️ Gold Market Outlook 12/ 26 (Based on SMC) ☄️ 📊Market Structure 🔤Overall Bias: Bullish 🔤Price continues to print higher highs & higher lows. 🔤Multiple BOS (Break of Structure) to the upside confirm strong smart money control. 🔤No valid bearish CHOCH yet → trend remains intact. 💡Trading Plan 🔼Scenario 1 – Primary Buy (Trend Continuation) 🔤Entry: 4488 – 4495 🔤Reason Pullback into H1 FVG Structure remains bullish (no CHOCH) Previous BOS acting as support 🔤Confirmation Bullish reaction inside the zone (rejection / strong close) 🔤Invalidation: H1 close below 4460 🔼Scenario 2 – Deep Buy (Stronger Discount) 🔤Entry: 4460 – 4470 🔤Reason Deeper FVG + demand zone Aligned with higher-timeframe bullish structure 🔤Confirmation Minor BOS on M5–M15 after reaction Invalidation: Clean break & close below 4445 🔼Scenario 3 – Breakout Continuation 🔤Entry: Buy on retest of 4520 after clean H1 BOS above 🔤Reason Acceptance above previous high Liquidity taken → continuation phase 🔤Confirmation Retest holds + bullish displacement Disclaimer: All content and signals shared are for general guidance and informational purposes only. This information should not be considered a substitute for certified financial advice. We assume no responsibility for any outcomes or consequences (positive or negative) that may arise from the use of these signals. All members are strongly encouraged to consult with their own qualified experts or advisors before making any trading decisions.
GOLD PLAN TODAY AFTER SURGING OVER 4400 | XAUUSD DEC 23, 2025
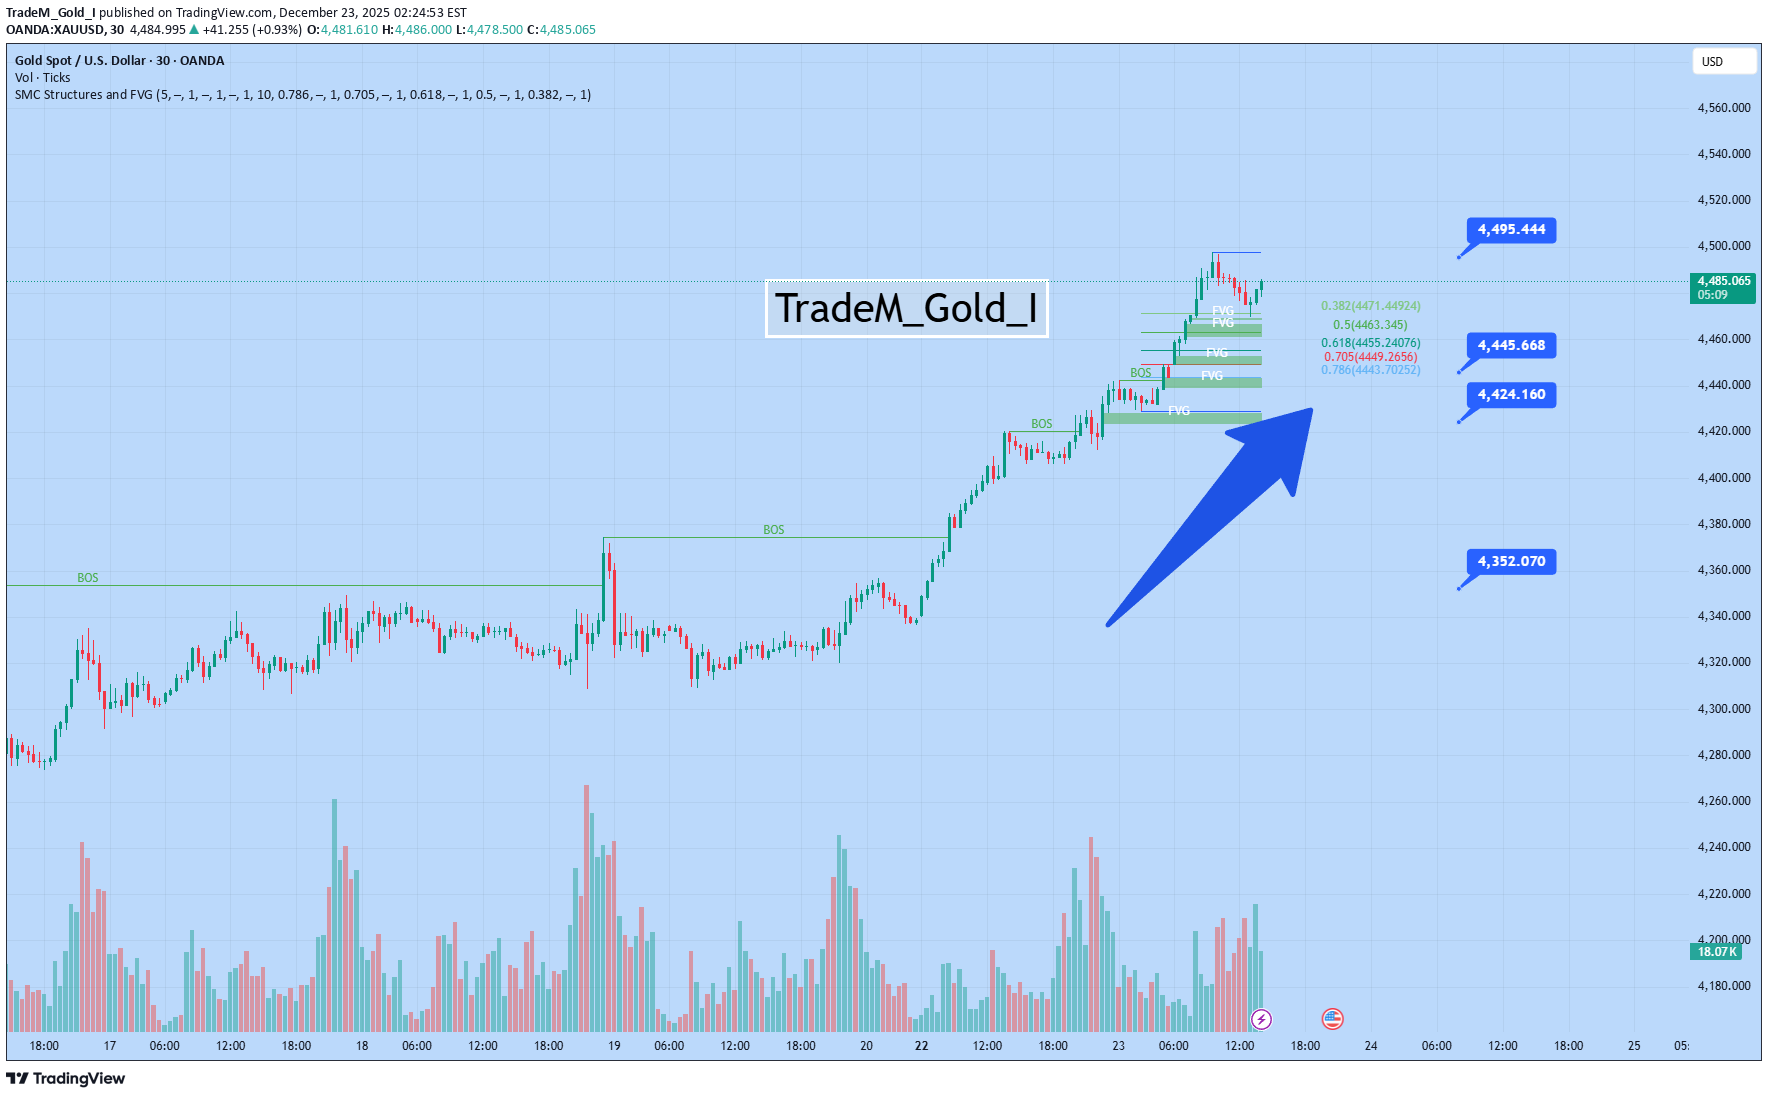
☄️ Gold Market Outlook 12/ 23 (Based on SMC) ☄️ 📊Market Structure Overview 🔤Main trend: Bullish 🔤Price continues to form Higher Highs & Higher Lows 🔤Multiple Bullish BOS confirm strong Smart Money control 🔤No Bearish CHOCH on H1 → no sign of trend reversal yet 🔤Recent impulsive move created bullish FVGs that are not fully filled 👉 Bias: BUY continuation only. Selling is counter-trend and risky 💡Trading Scenarios 🔼Scenario 1: BUY on Pullback (High Probability) 🔤Conditions Price retraces into 4445 – 4425 Bullish CHOCH Followed by Bullish BOS Entry at Bullish FVG 🔤Reasoning Trade in line with H1 trend FVG + BOS confirms Smart Money continuation 🔼Scenario 2: BUY on Deep Pullback (Safer, Better RR) 🔤Conditions Price drops into 4340 – 4320 H1 structure remains intact M15 shows Bullish CHOCH Bullish BOS Entry at Demand / FVG 🔤Reasoning Previous BOS flips into demand Typical Smart Money re-accumulation zone 🔽Scenario 3: SELL (Counter-Trend, Short-Term Only) 🔤Conditions Price reaches 4485 – 4500 Bearish CHOCH Bearish BOS Entry at Bearish FVG 🔤Reasoning Premium zone + profit taking Counter-trend trade → scalp only ⚠️ Do NOT hold sell positions without a confirmed H1 Bearish CHOCH Disclaimer: All content and signals shared are for general guidance and informational purposes only. This information should not be considered a substitute for certified financial advice. We assume no responsibility for any outcomes or consequences (positive or negative) that may arise from the use of these signals. All members are strongly encouraged to consult with their own qualified experts or advisors before making any trading decisions.
GOLD MARKET OUTLOOK | XAUUSD DEC 19, 2025
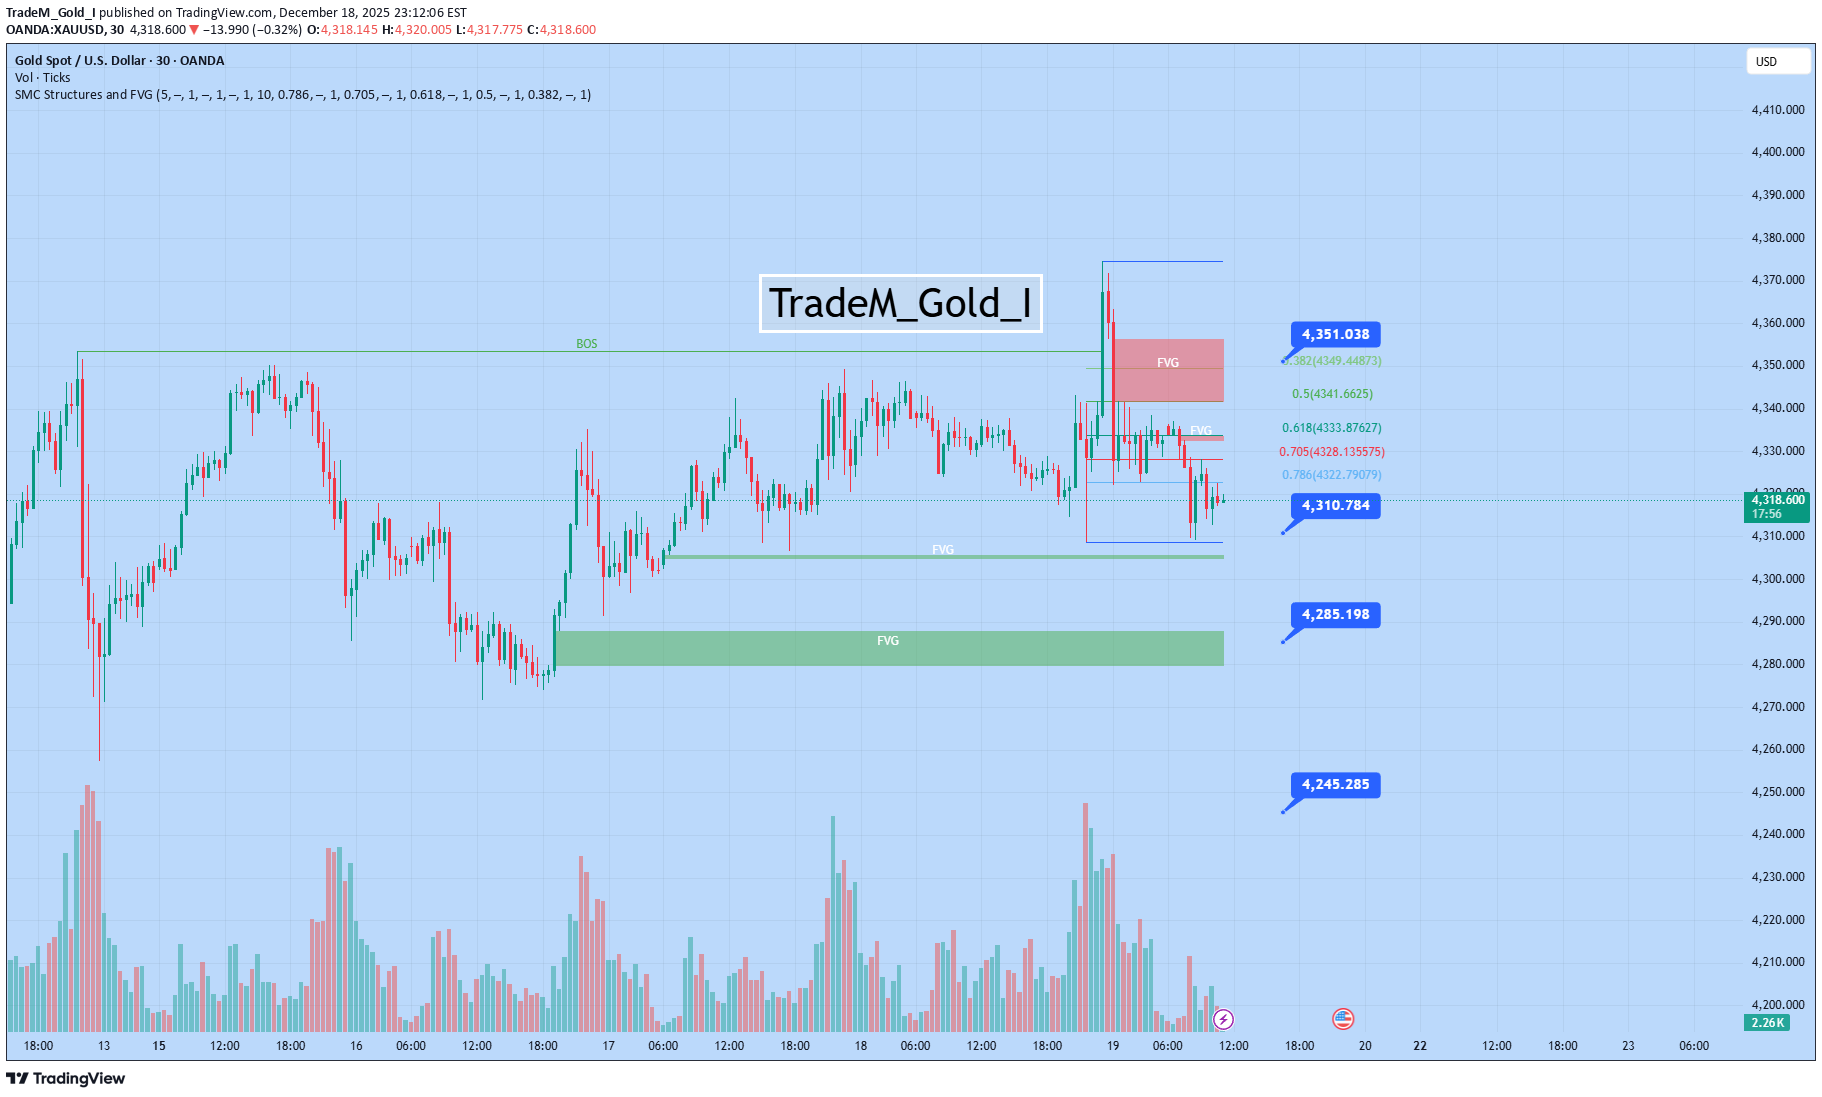
📊Market Structure Gold on the H1 timeframe remains bullish, confirmed by multiple BOS (Break of Structure) to the upside. However, recent price action shows consolidation below highs, suggesting smart money is mitigating positions after a strong expansion. 💡Trading Plan 🔼Scenario 1 – Bullish Continuation (High Probability) 🔤Bias: Buy continuation 🔤Reason Market remains bullish with previous BOS intact No confirmed bearish CHoCH on H1 Price likely to retrace into discount FVG before continuation 🔤Entry Condition Price taps 4310–4320 FVG Bullish reaction with LTF BOS / displacement 📊Scenario 2 – Range Play / Liquidity Sweep (Medium Probability) 🔤Short-term sell → buy 🔤Reason Price consolidating near equilibrium Likely liquidity sweep above 4350 before reversal Smart money traps breakout buyers 🔤Entry Condition Sweep above recent highs Bearish CHoCH on M15–M30 Sell back into range → Buy again at discount FVG 🔽Scenario 3 – Bearish Reversal (Low Probability) 🔤Bias: Sell 🔤Reason Requires a confirmed H1 CHoCH Failure to hold above BOS level Strong displacement below 4300 🔤Entry Condition H1 candle closes below 4300 Retest fails + bearish BOS Disclaimer: All content and signals shared are for general guidance and informational purposes only. This information should not be considered a substitute for certified financial advice. We assume no responsibility for any outcomes or consequences (positive or negative) that may arise from the use of these signals. All members are strongly encouraged to consult with their own qualified experts or advisors before making any trading decisions.
BTCUSD PLAN TODAY | BITCOIN DEC 18, 2025
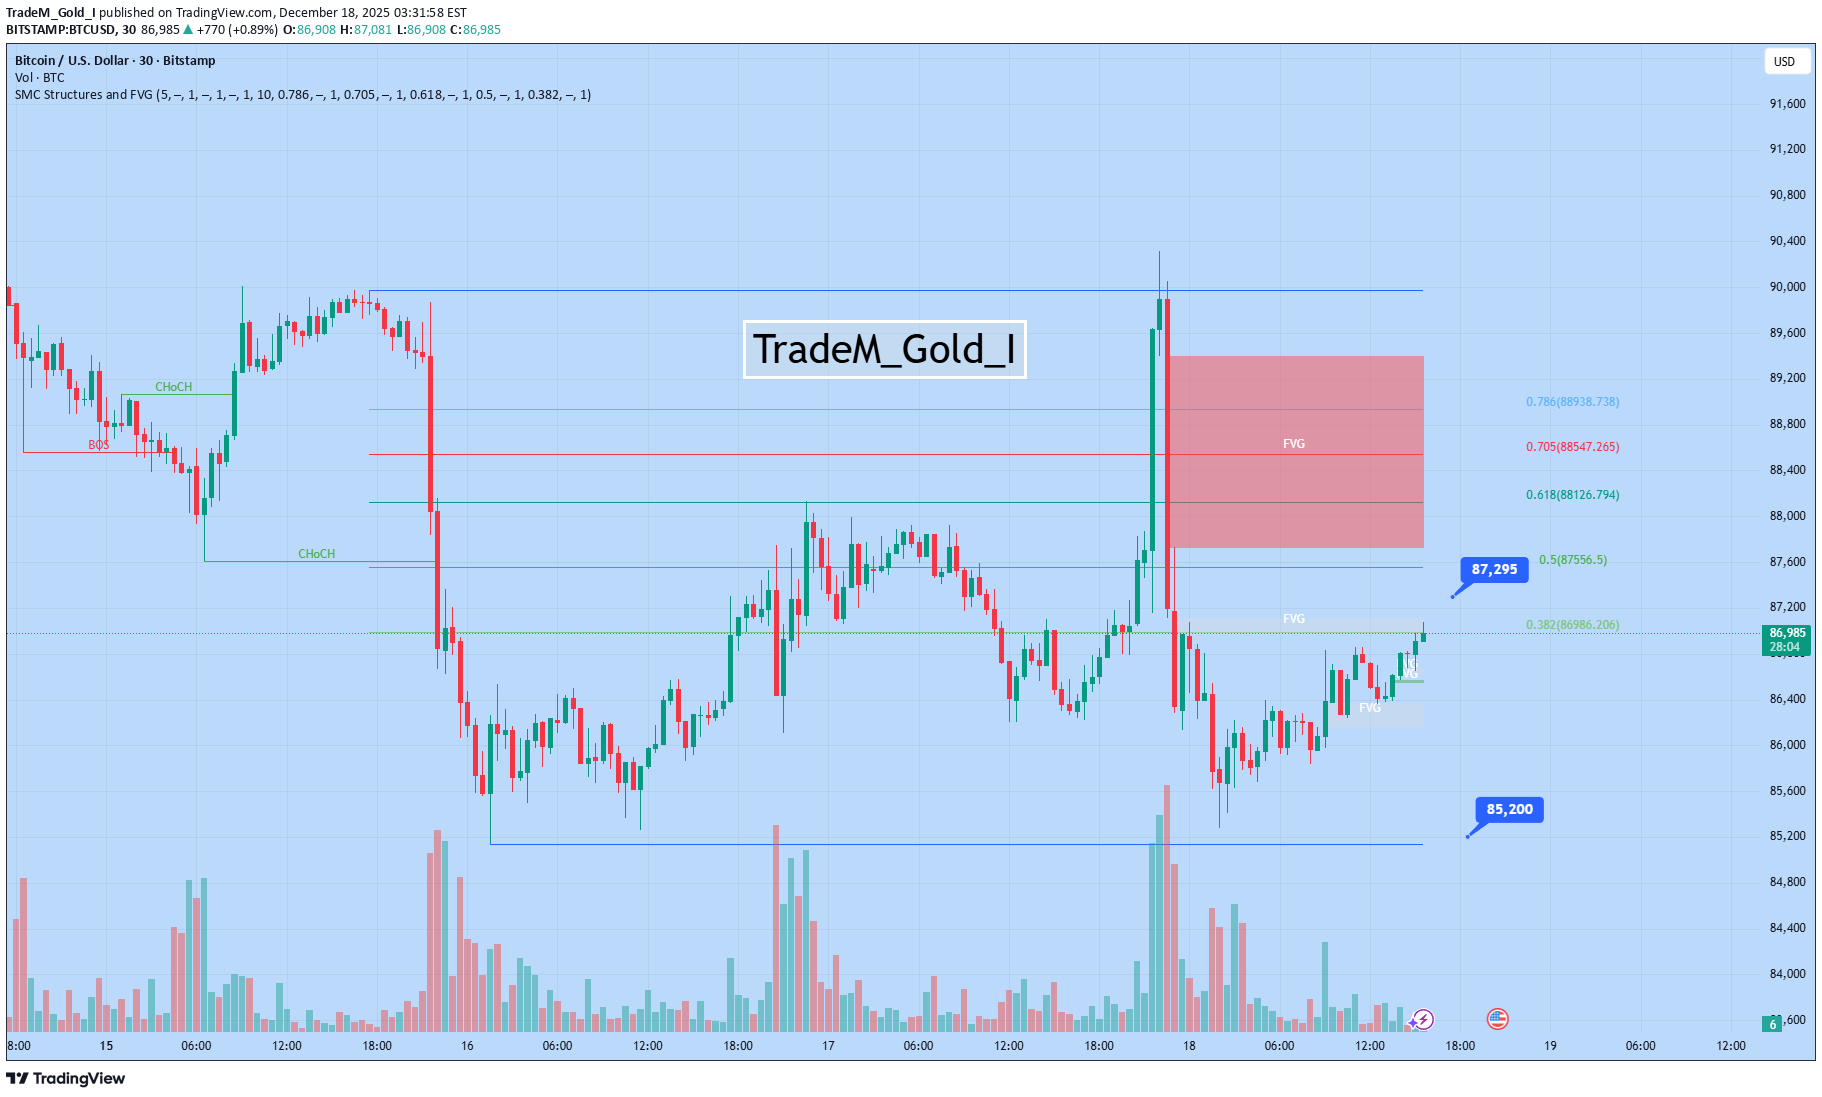
1. Market Structure & Trend Direction : The market is currently in a high-volatility sideways range after a sharp rejection from the $90,000 level. Key Levels: A significant swing low is established at $85,200, while the recent peak sits near $90,000. Current State: Price is attempting to stabilize around the 0.382 Fibonacci level ($86,986). 2. Supply and Demand Zones Major Resistance (Supply): A large Fair Value Gap (FVG) and supply zone (red box) exists between $87,556 and $88,938. This area is likely to attract sellers on any bounce. Immediate Support: The $86,957 level is providing minor relief, but a break below this could lead back to the $85,200 support floor. 3. Volume & Momentum Volume Spike: The massive red volume bar indicates strong institutional selling at the recent high. Momentum: Current volume is thinning (19.6K), suggesting a consolidation phase before the next big move. Summary: The outlook is neutral-to-bearish below the $88,000 supply zone. Look for a rejection at the red FVG or a support test at $85,200. Disclaimer: All content and signals shared are for general guidance and informational purposes only. This information should not be considered a substitute for certified financial advice. We assume no responsibility for any outcomes or consequences (positive or negative) that may arise from the use of these signals. All members are strongly encouraged to consult with their own qualified experts or advisors before making any trading decisions.
Disclaimer
Any content and materials included in Sahmeto's website and official communication channels are a compilation of personal opinions and analyses and are not binding. They do not constitute any recommendation for buying, selling, entering or exiting the stock market and cryptocurrency market. Also, all news and analyses included in the website and channels are merely republished information from official and unofficial domestic and foreign sources, and it is obvious that users of the said content are responsible for following up and ensuring the authenticity and accuracy of the materials. Therefore, while disclaiming responsibility, it is declared that the responsibility for any decision-making, action, and potential profit and loss in the capital market and cryptocurrency market lies with the trader.