
Trade-Lean
@t_Trade-Lean

What symbols does the trader recommend buying?
Purchase History
پیام های تریدر
Filter
Signal Type
Trade-Lean
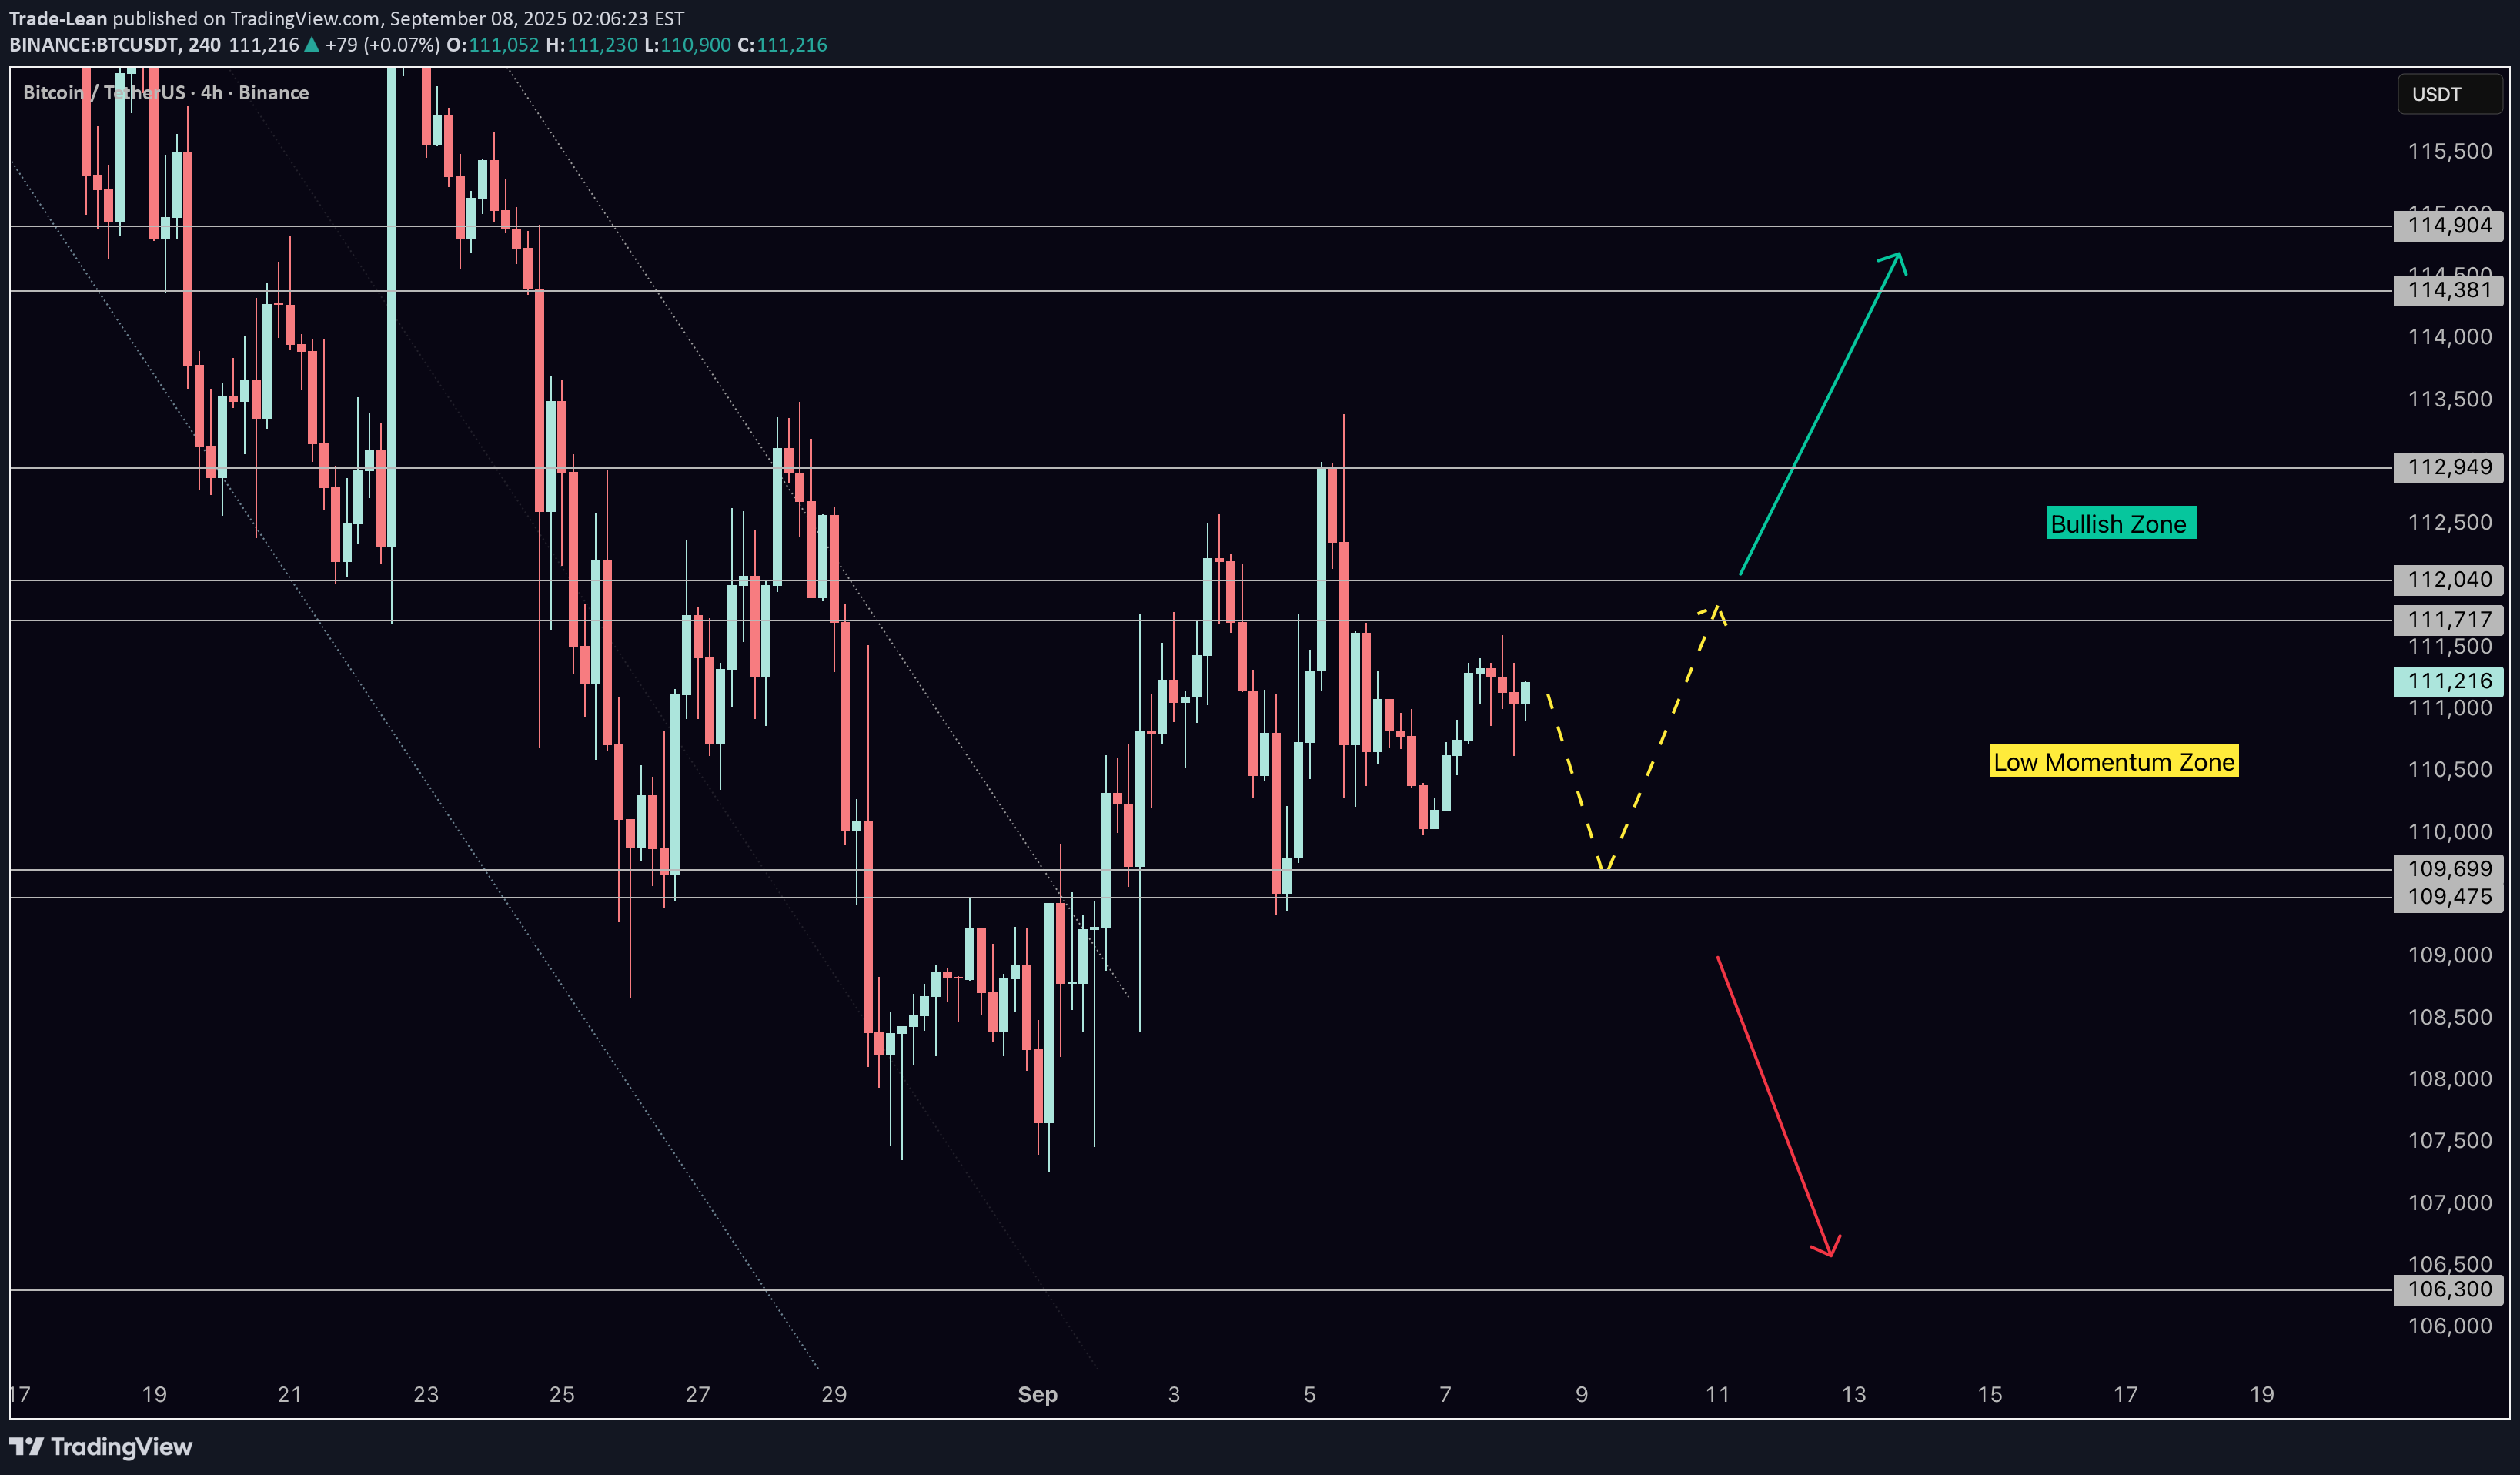
My main bias is to the upside, expecting more upward movement, contingent on holding $104,770. The upcoming CPI data is the key catalyst. On the 4-hour chart, a break above $111,721 targets $116,722, while a break below $109,464 targets the key support zone at $104,777.
Trade-Lean
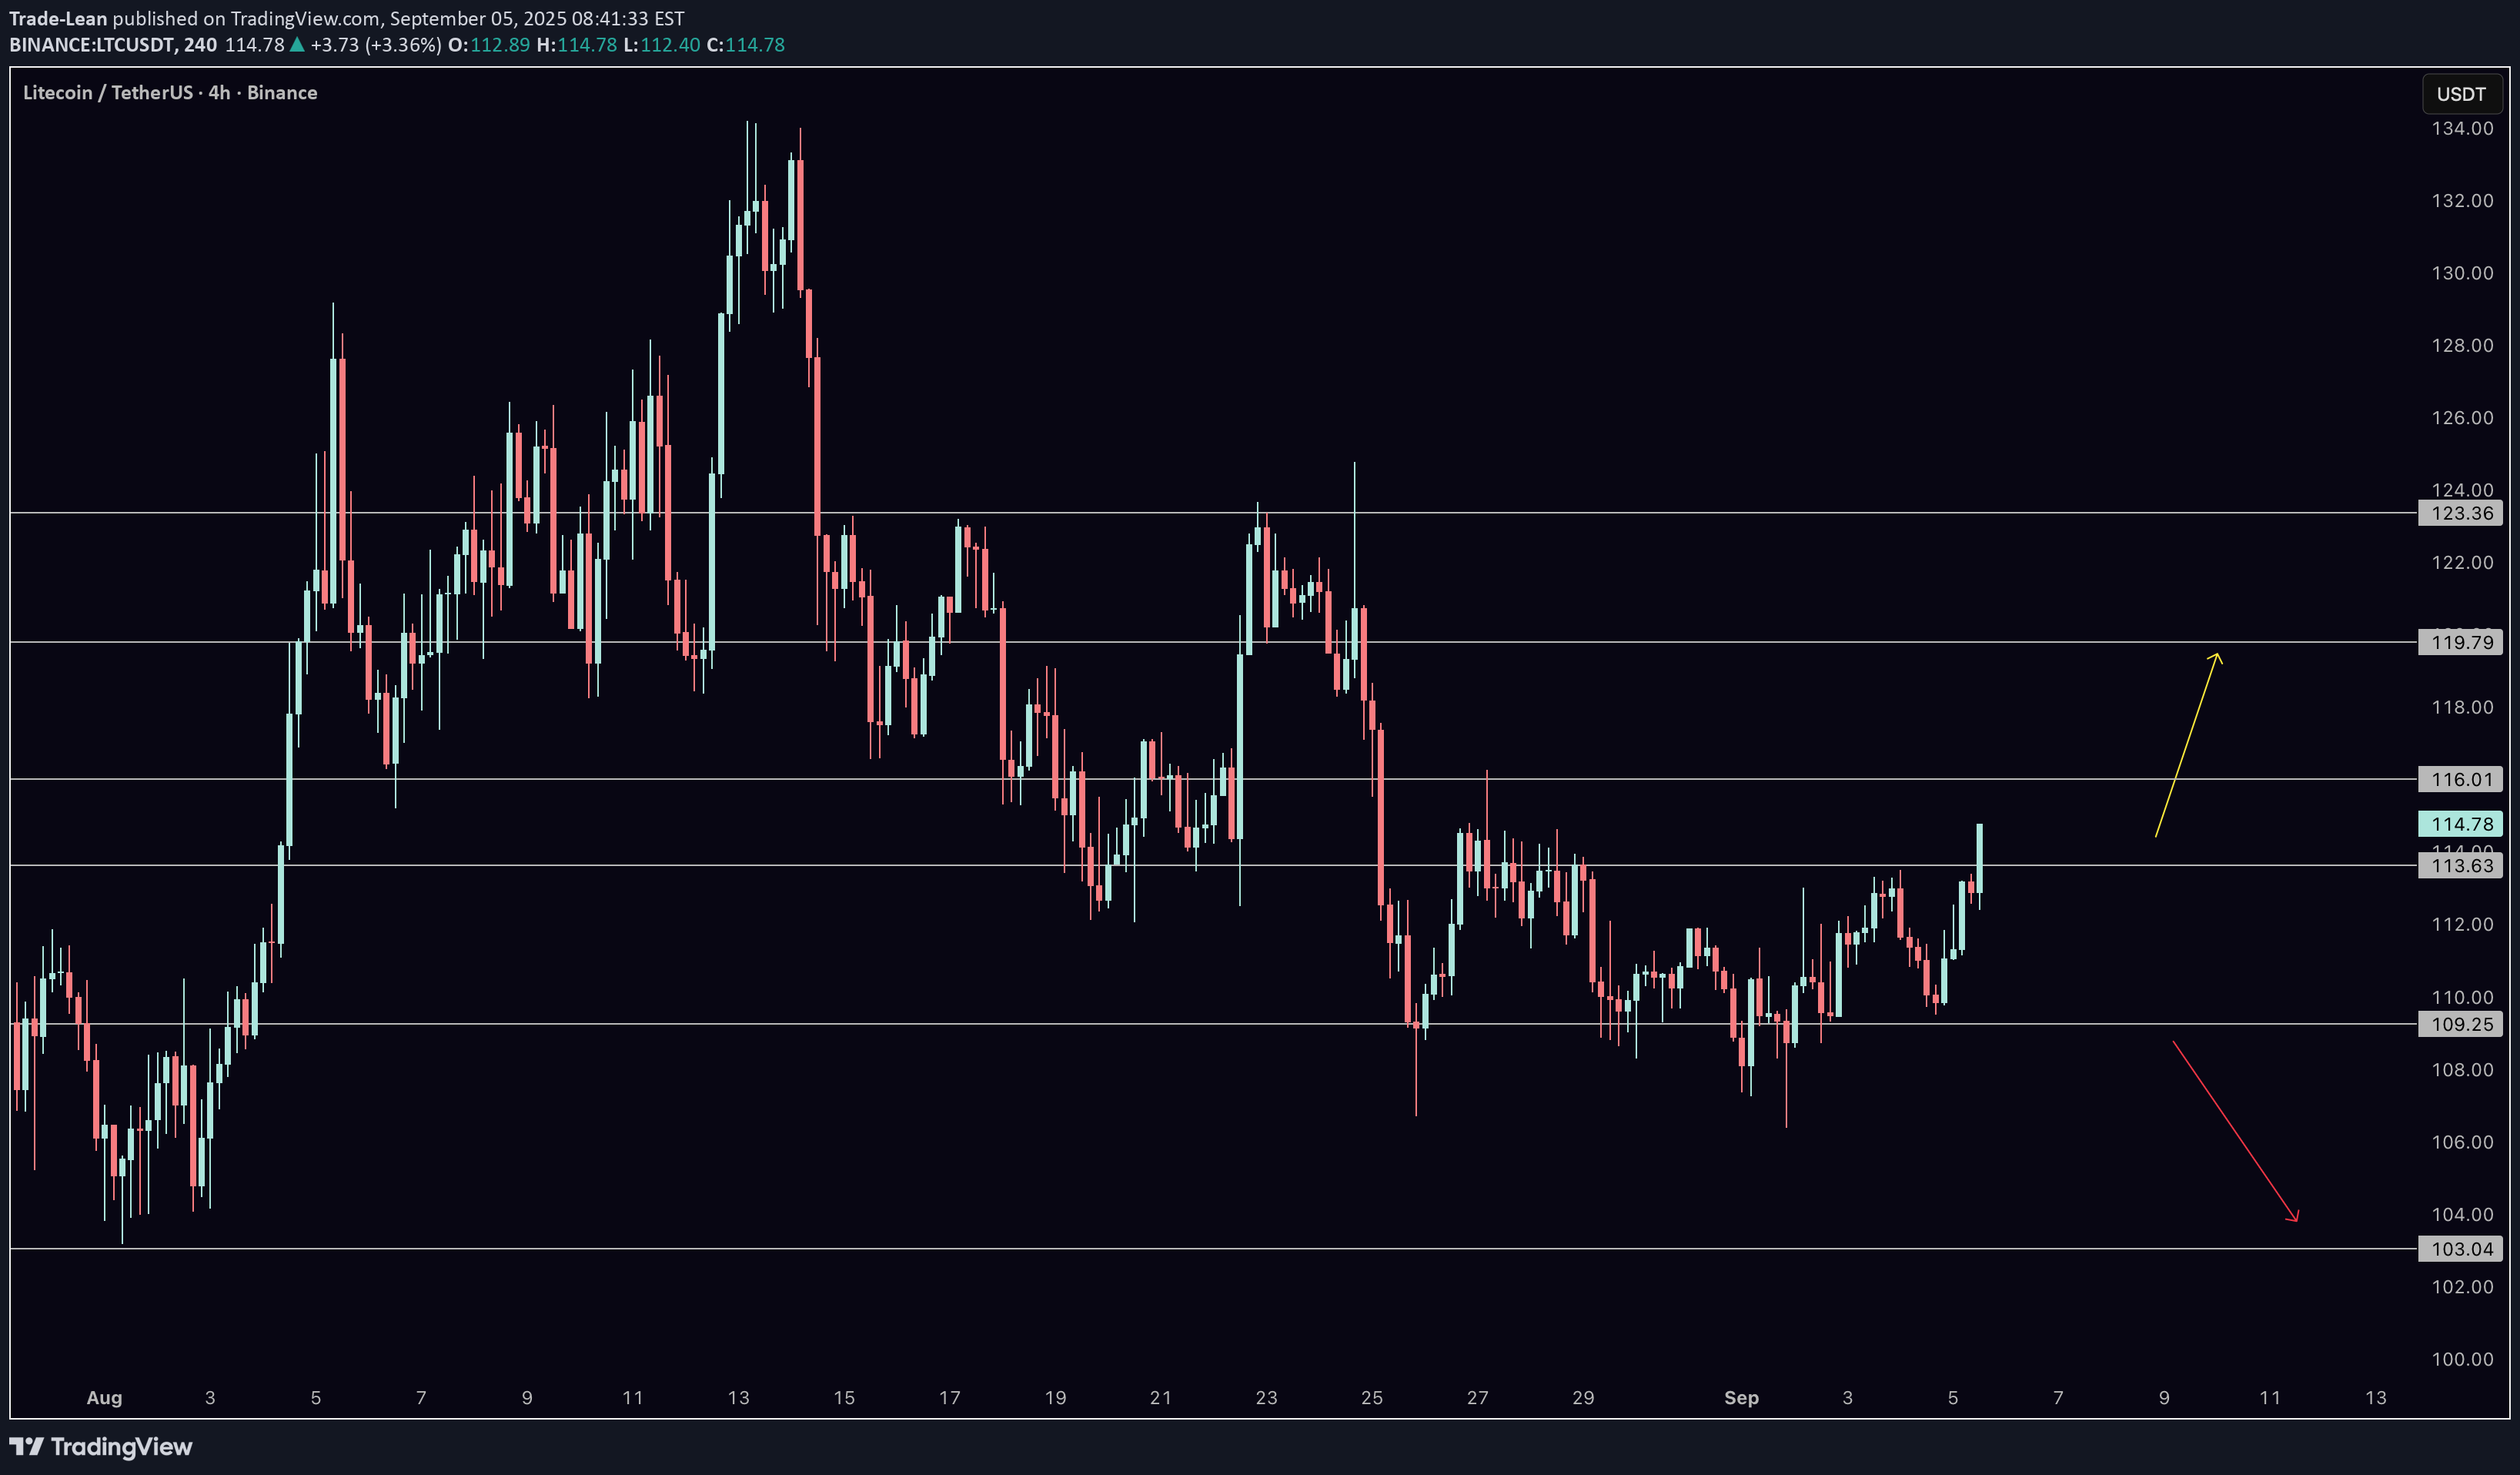
Litecoin (LTC) continues to hold key support around $109 despite recent volatility, setting up for another upside push. With the Non-Farm Payrolls report coming in significantly weaker than expected, risk assets like crypto have gained a bullish backdrop as the Fed faces pressure to lean dovish. In this video, I break down LTC’s daily and 4-hour charts, highlighting the crucial demand and resistance levels that will shape the next move. As long as LTC holds above $109, the structure remains constructive with targets toward $119.8, $123.4, and $137 in play. A breakout above those levels would open the path toward $168, aligning with the broader bullish setup across the crypto market. With Bitcoin showing resilience, Litecoin is well-positioned to continue its recovery in the sessions ahead.
Trade-Lean
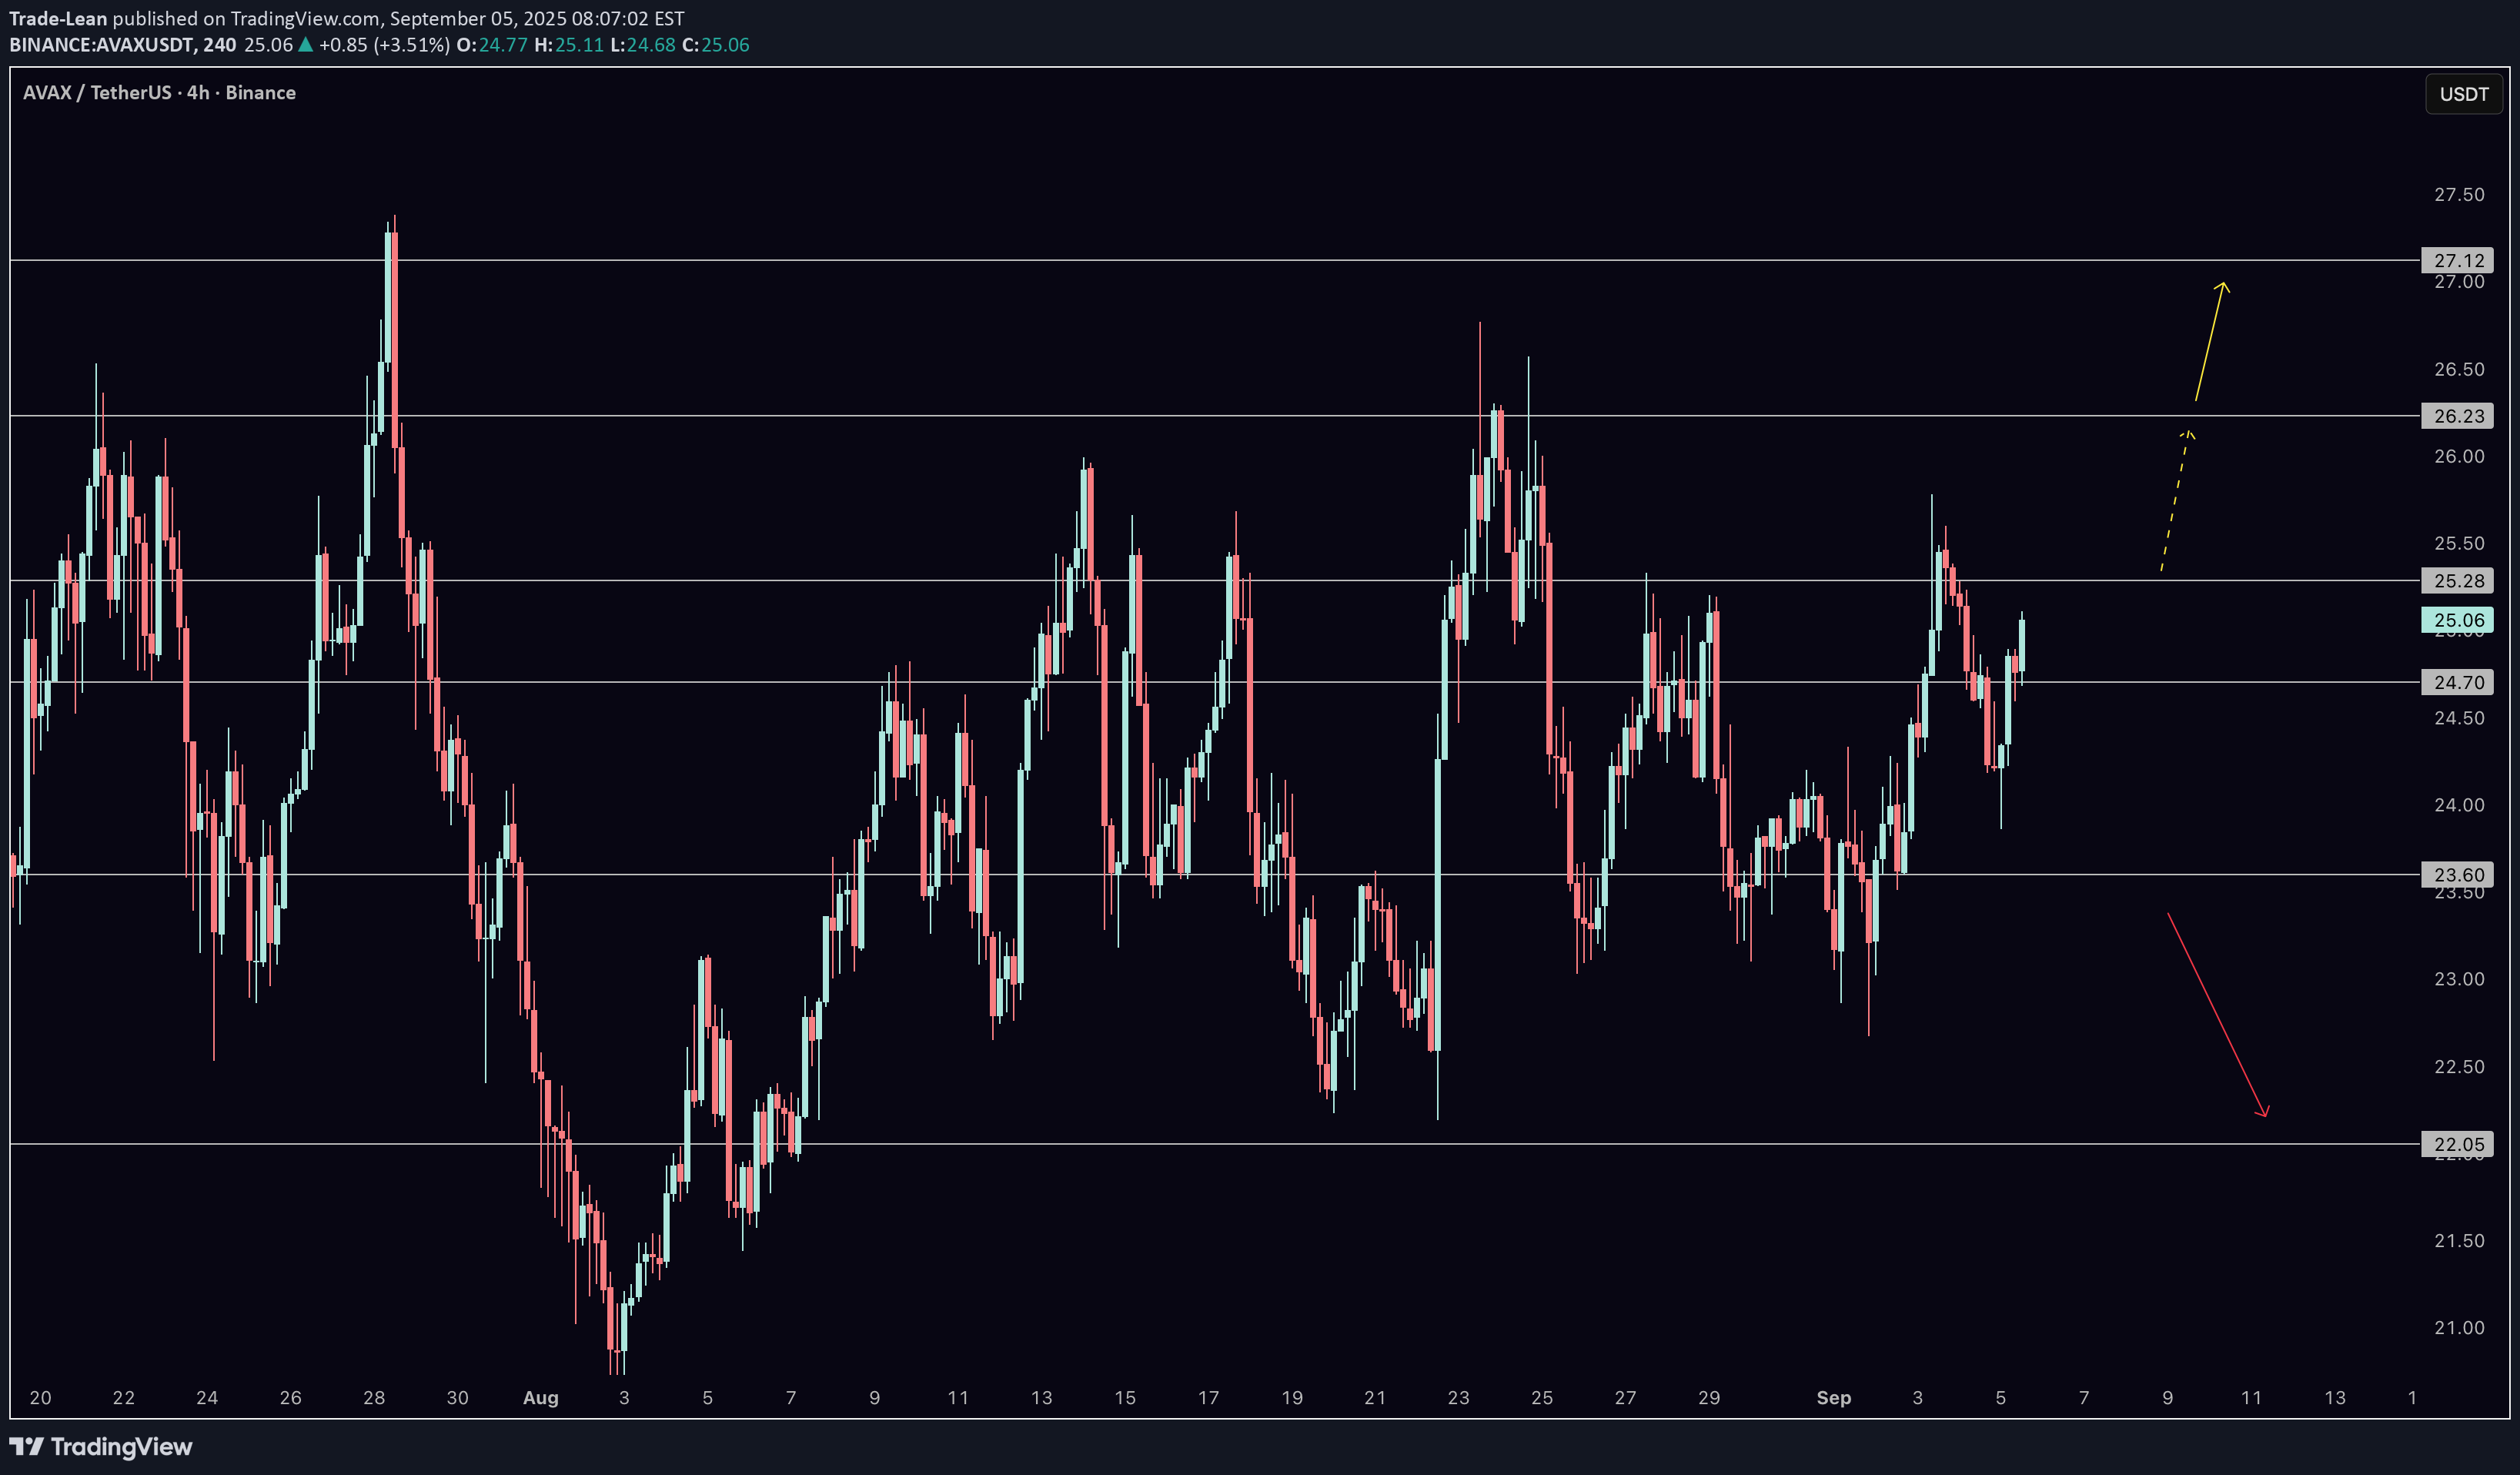
Avalanche (AVAX) is holding key support and showing signs of strength after today’s NFP report came in much weaker than expected. That release sparked volatility across risk assets, and with Bitcoin leaning bullish, AVAX could be setting up for its next leg higher. In this video, I break down both the daily and 4-hour charts to map out the critical levels you need to watch. From $22 support to resistance levels at $26.2, $27.1, and $30.6, the structure remains constructive as long as AVAX holds above its floor. A decisive breakout opens the path toward $39 and potentially $48 in the medium term. Join me as I explain the bullish roadmap, the downside risks, and how this all connects back to Bitcoin’s momentum after NFP.
Trade-Lean
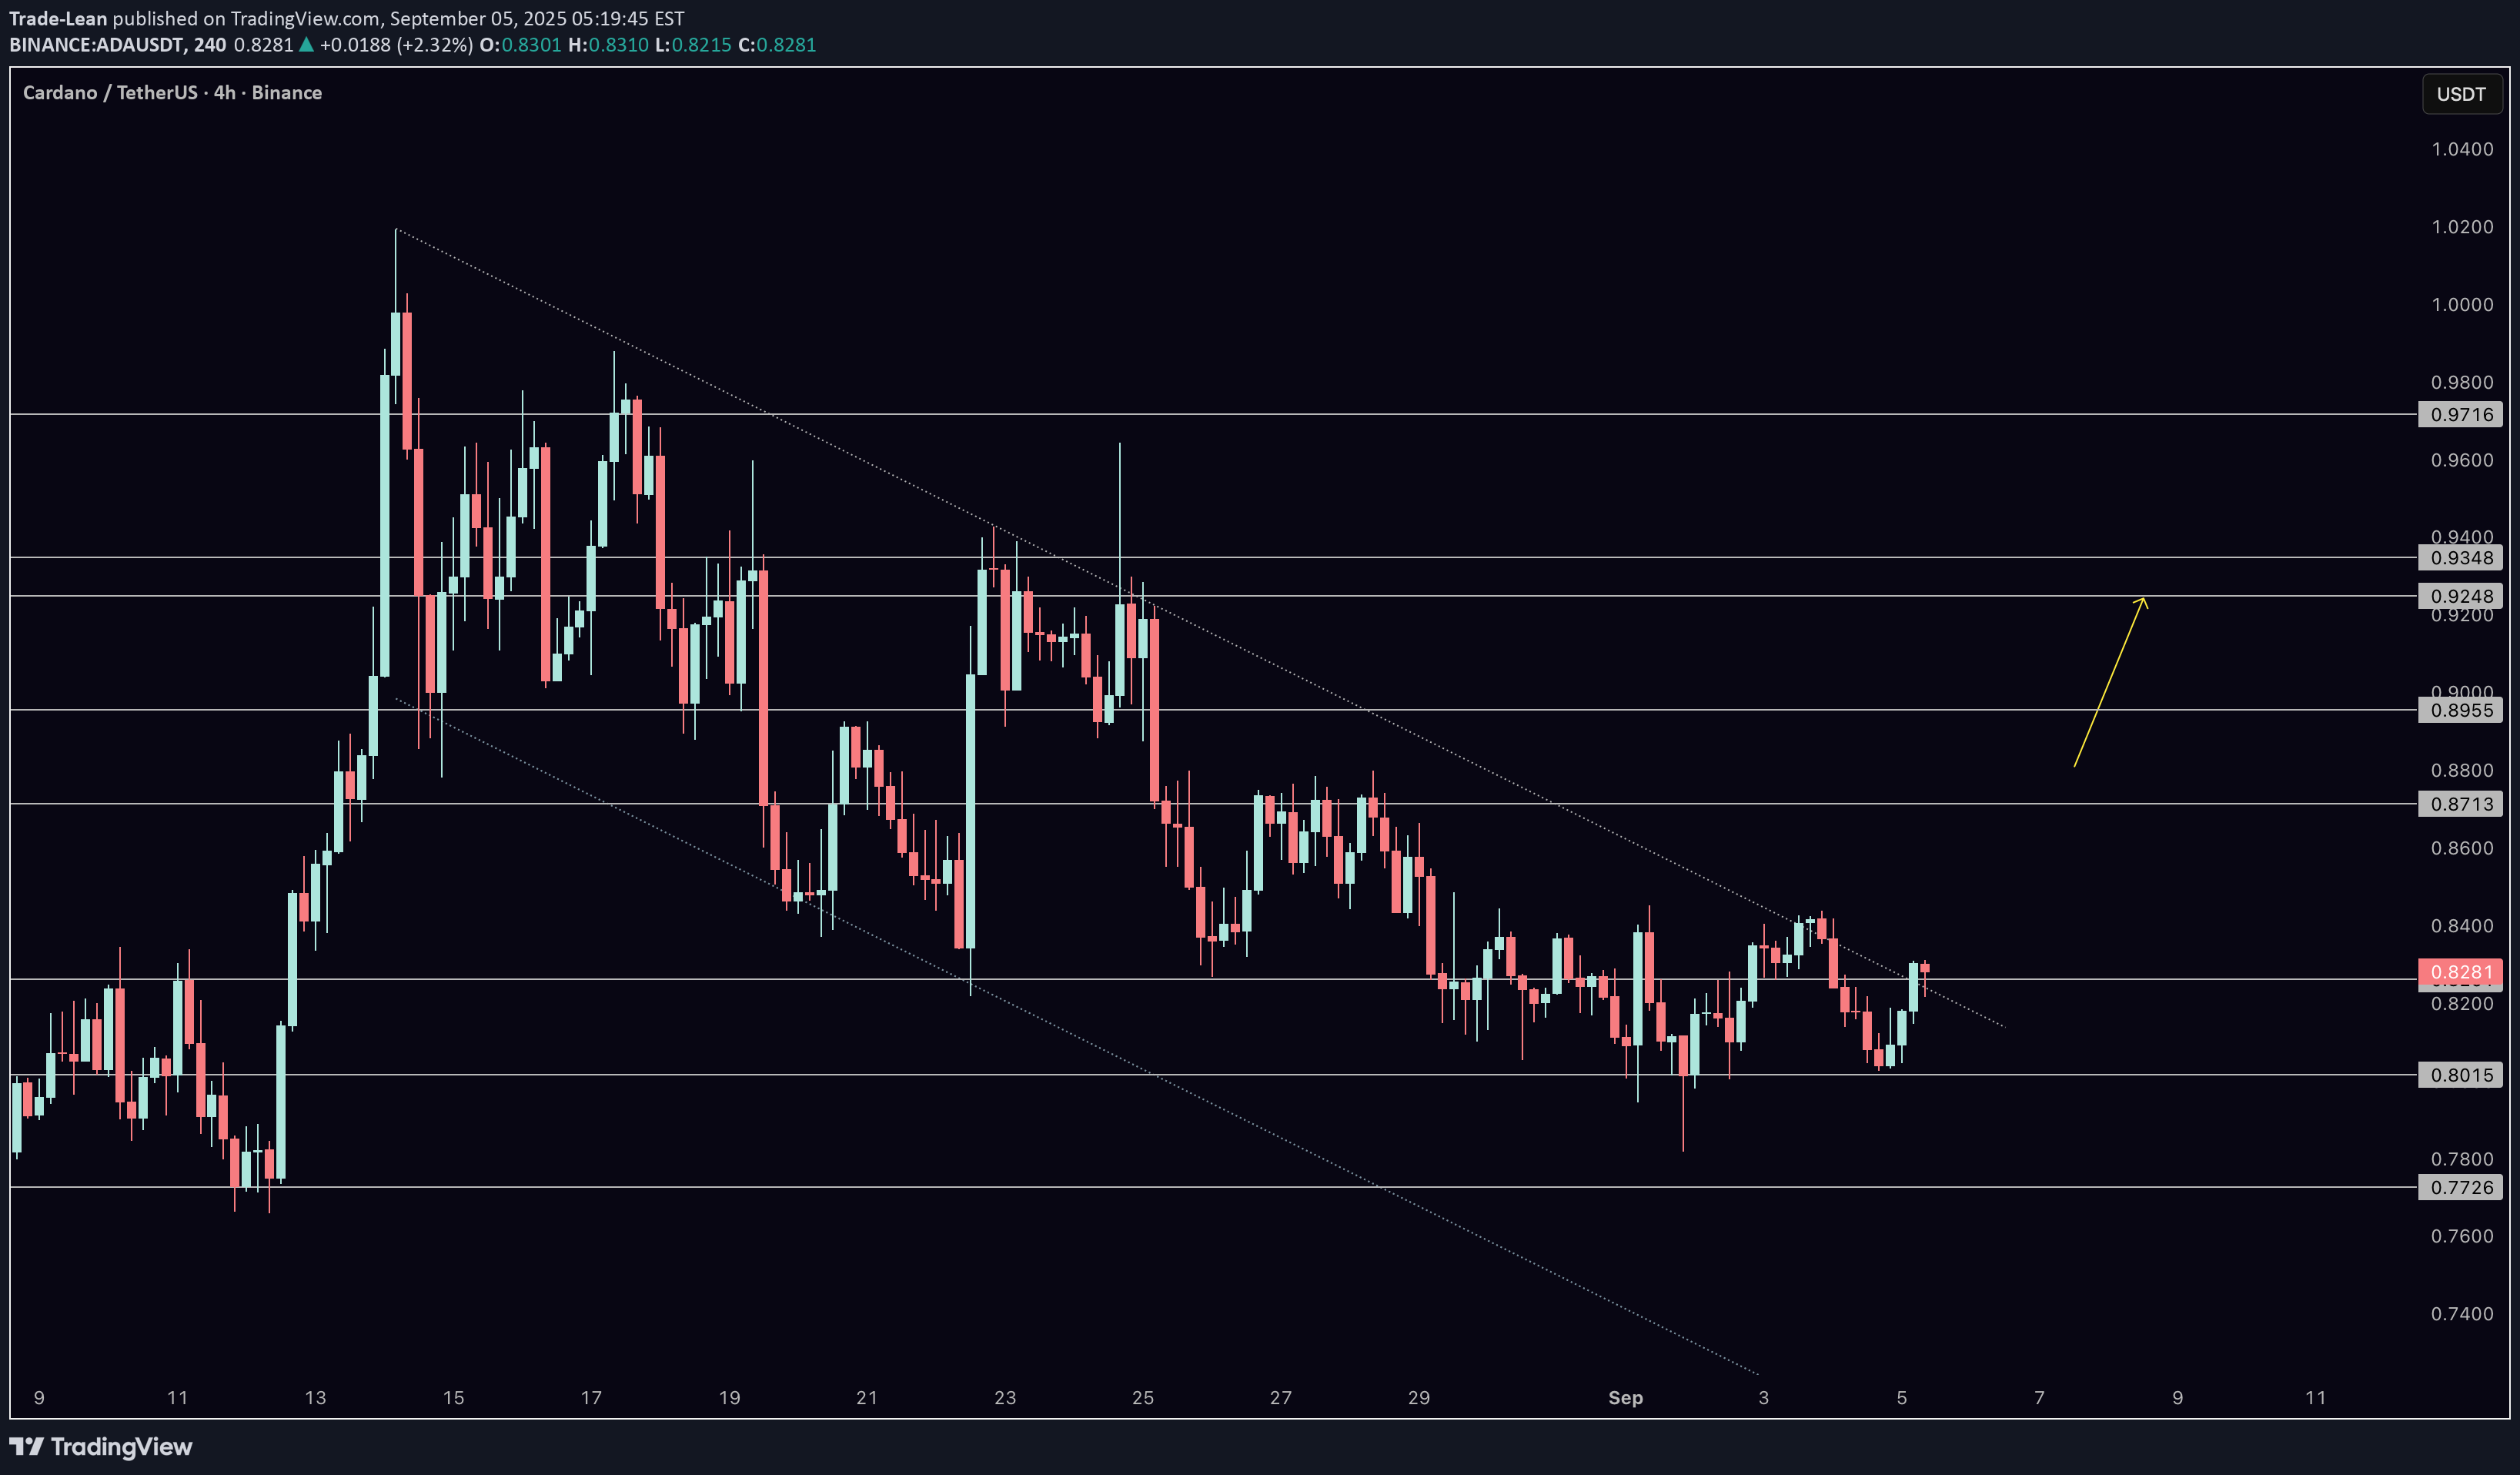
Cardano (ADA) is trading around $0.82–$0.83 on the 4H chart, holding above its key support but still capped under resistance. In today’s video, I focus only on the short-term price structure: support at $0.8157–$0.8014, deeper levels at $0.7724 and $0.7620, and resistance at $0.8484, $0.8710, and $0.9347. A breakout above $0.8710 would be a key step for ADA to confirm recovery momentum. The mid-term bias remains for more upside, but ADA must prove strength step by step. With Bitcoin showing bullish signals this morning and today’s NFP release increasing volatility, ADA’s reaction at these levels will define whether bulls can take control or if we see another retest of support.
Trade-Lean
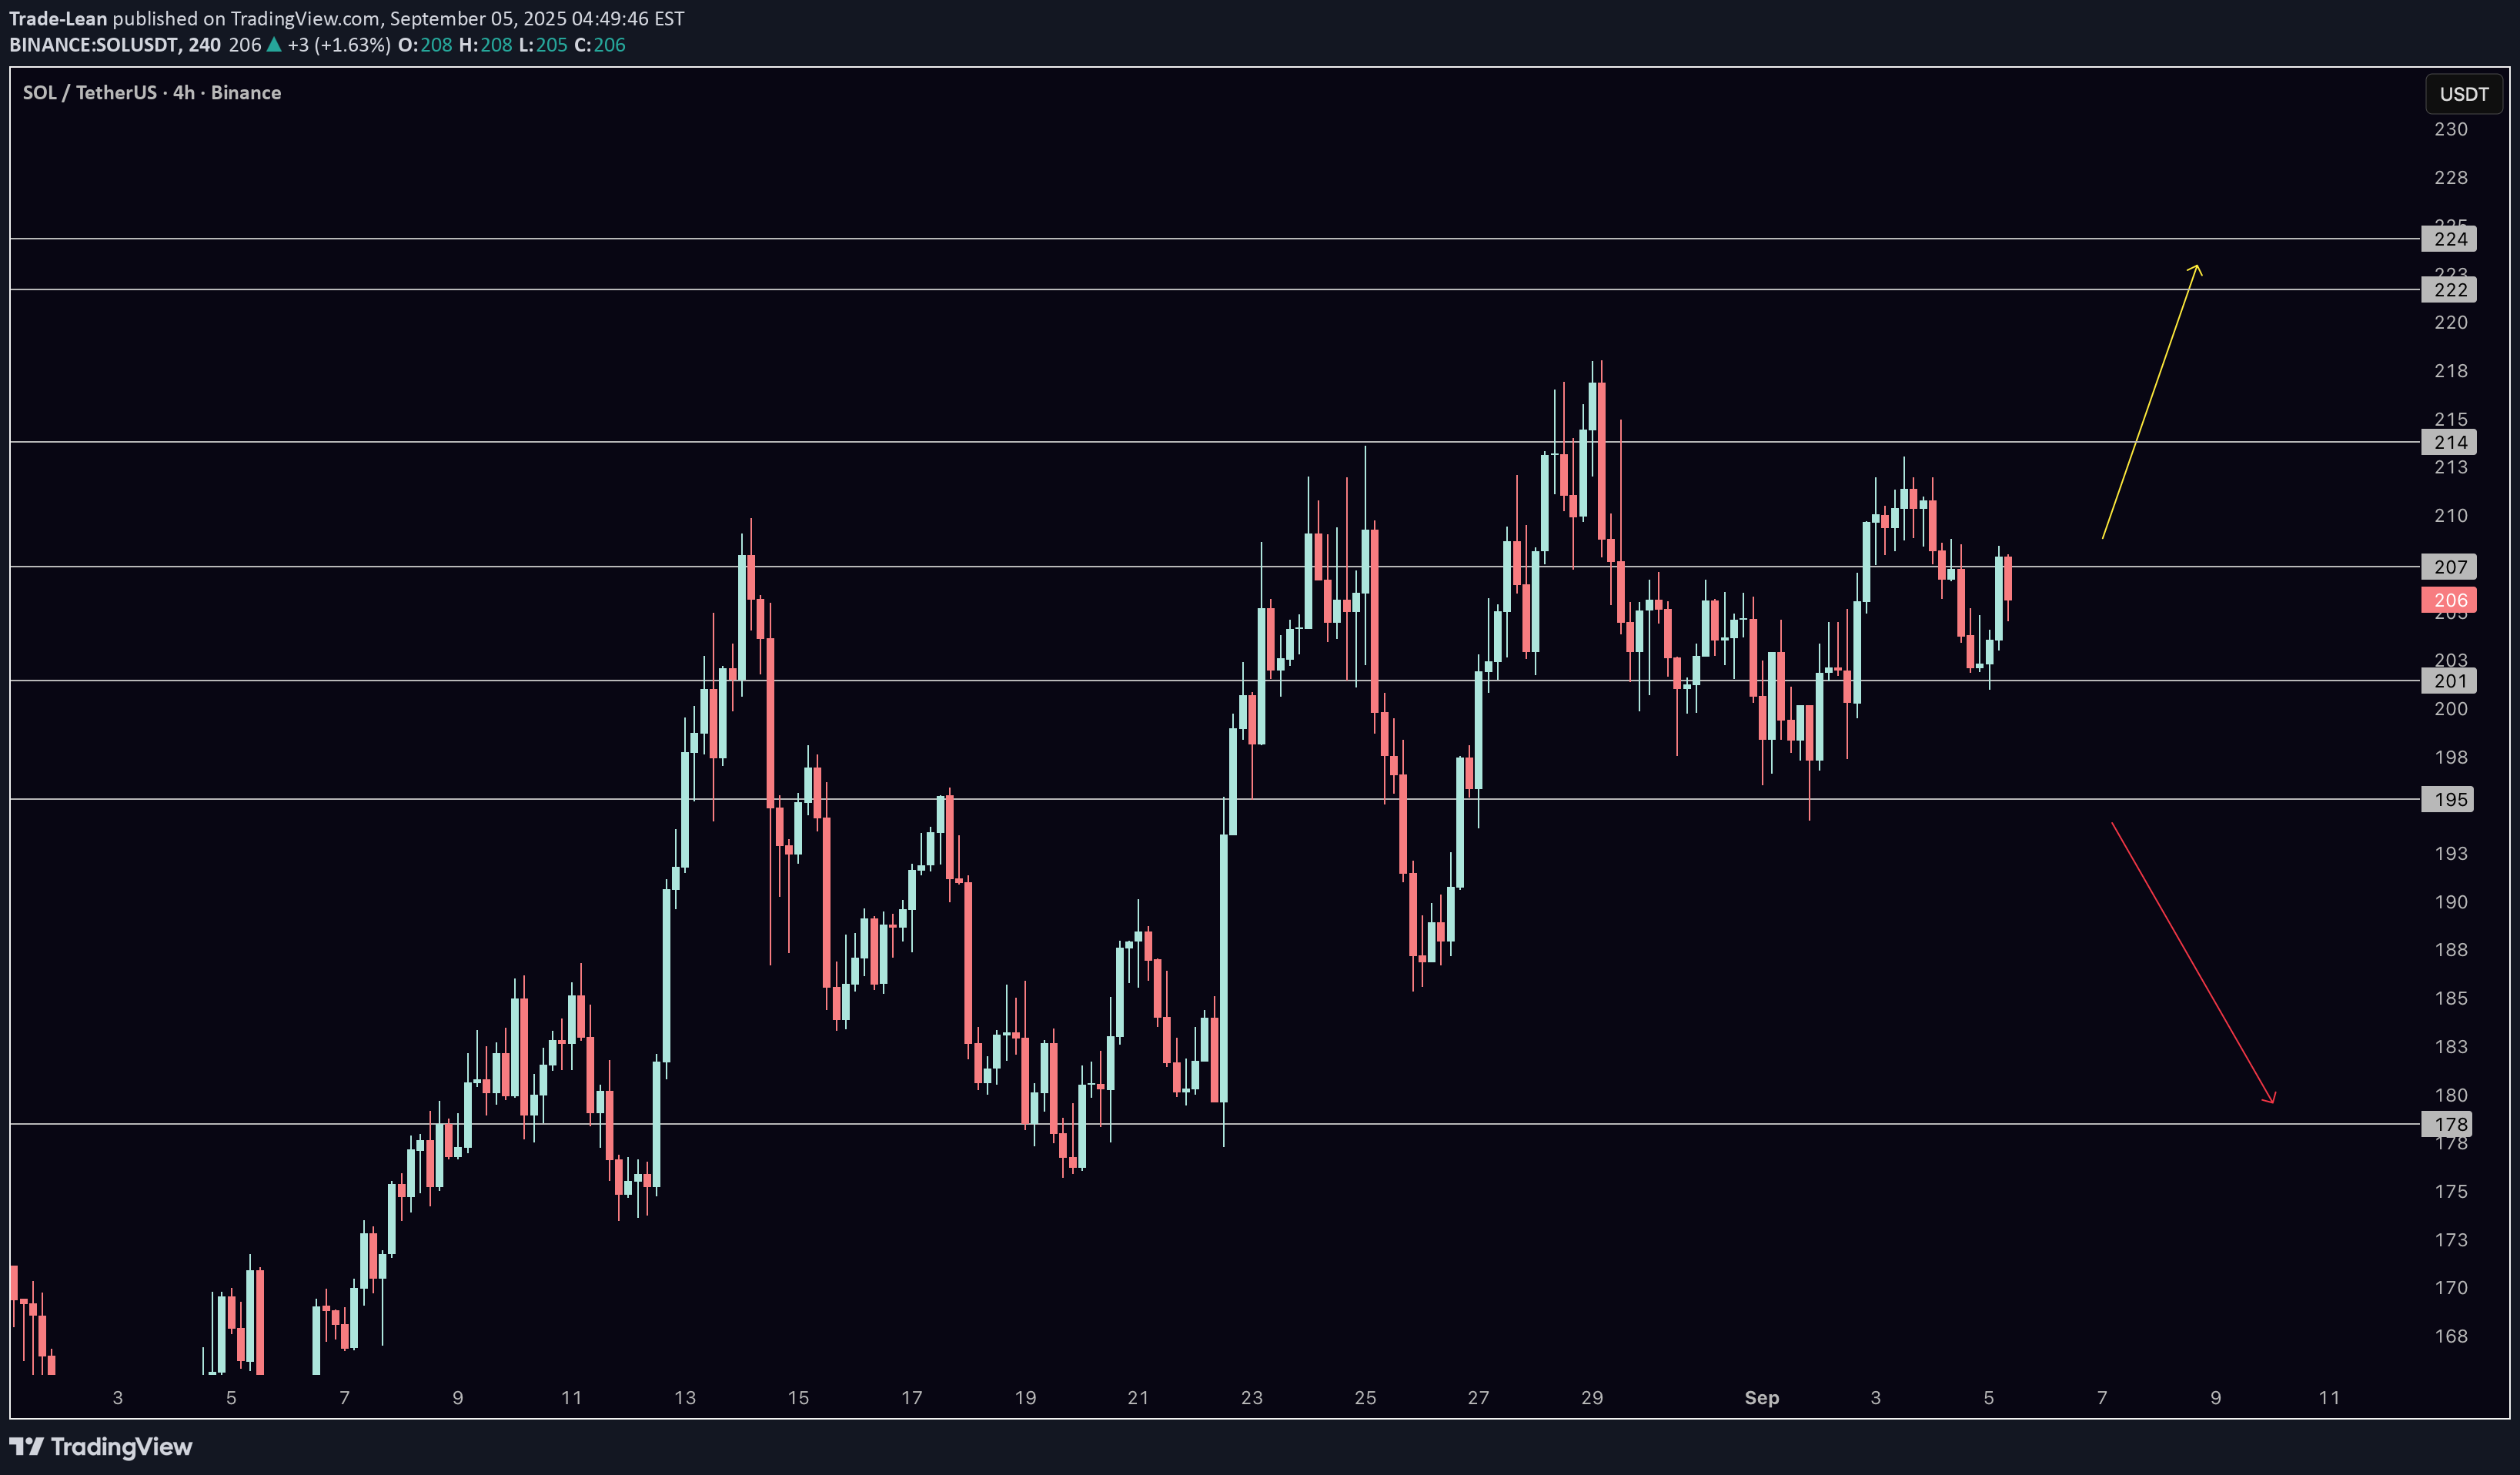
Solana (SOL) is trading around $207 on the 4-hour chart, just under the key $212 pivot zone. In this video, we focus on today’s Solana/USDT analysis and walk through the levels that matter most: $207 and $212 as the pivots, $222–$224 as the next resistance, and $234 as the higher target if bulls stay in control. On the downside, support sits at $205, $201, $195, and the deeper defense at $178. With Bitcoin showing bullishness and the U.S. Non-Farm Payrolls report released today, volatility is high across markets. In this Solana update, I explain how NFP, Bitcoin’s strength, and these intraday levels fit together to shape the next moves.
Trade-Lean
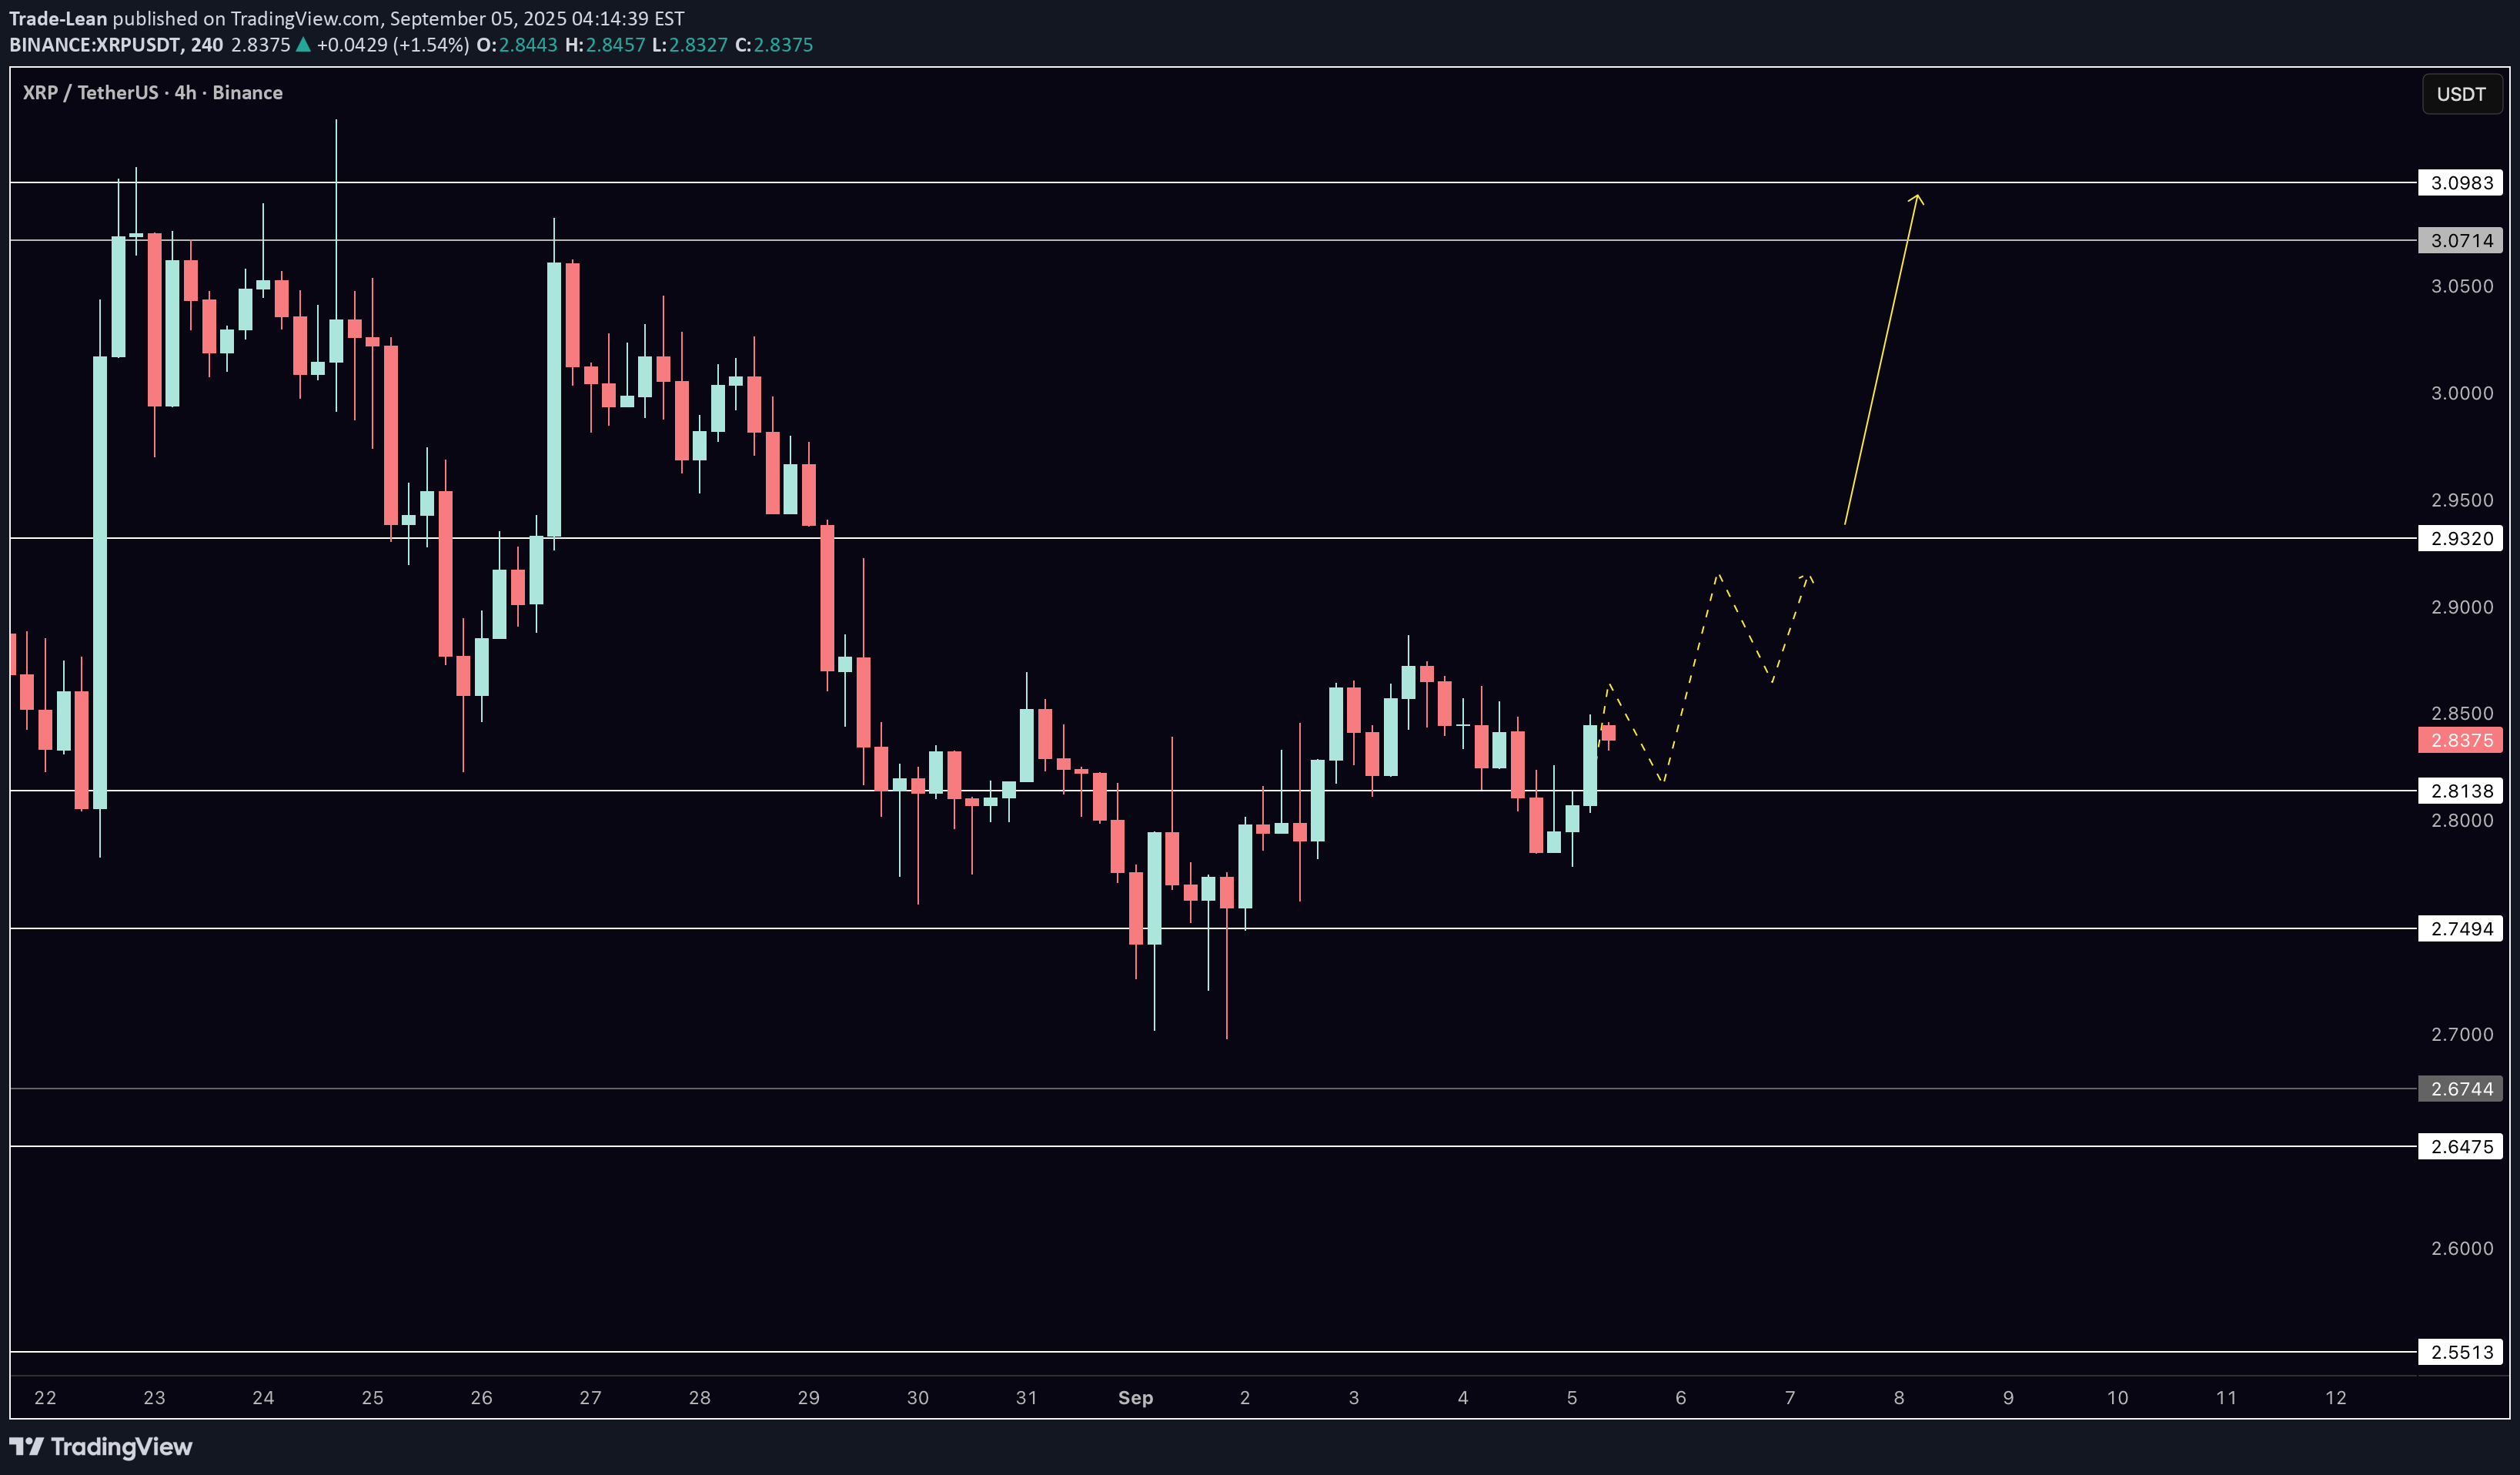
In today’s XRP update, we analyze the 4-hour chart as price consolidates just under key resistance. After defending $2.75, buyers have managed to push XRP back toward $2.87 and $2.93. These are the levels that will decide whether momentum shifts in favor of the bulls. If $2.93 is reclaimed, the path opens toward $3.09 and possibly higher. On the downside, supports remain at $2.81 and $2.75, with deeper zones at $2.67 and $2.65 if selling pressure increases. This update also comes on a major day for global markets, with the U.S. Non-Farm Payrolls release driving volatility across assets. Bitcoin has already shown bullish attempts on the 4-hour chart, which I covered in detail earlier today on the channel. The big question now is whether XRP can align with that strength by breaking its own resistance barriers.
Trade-Lean
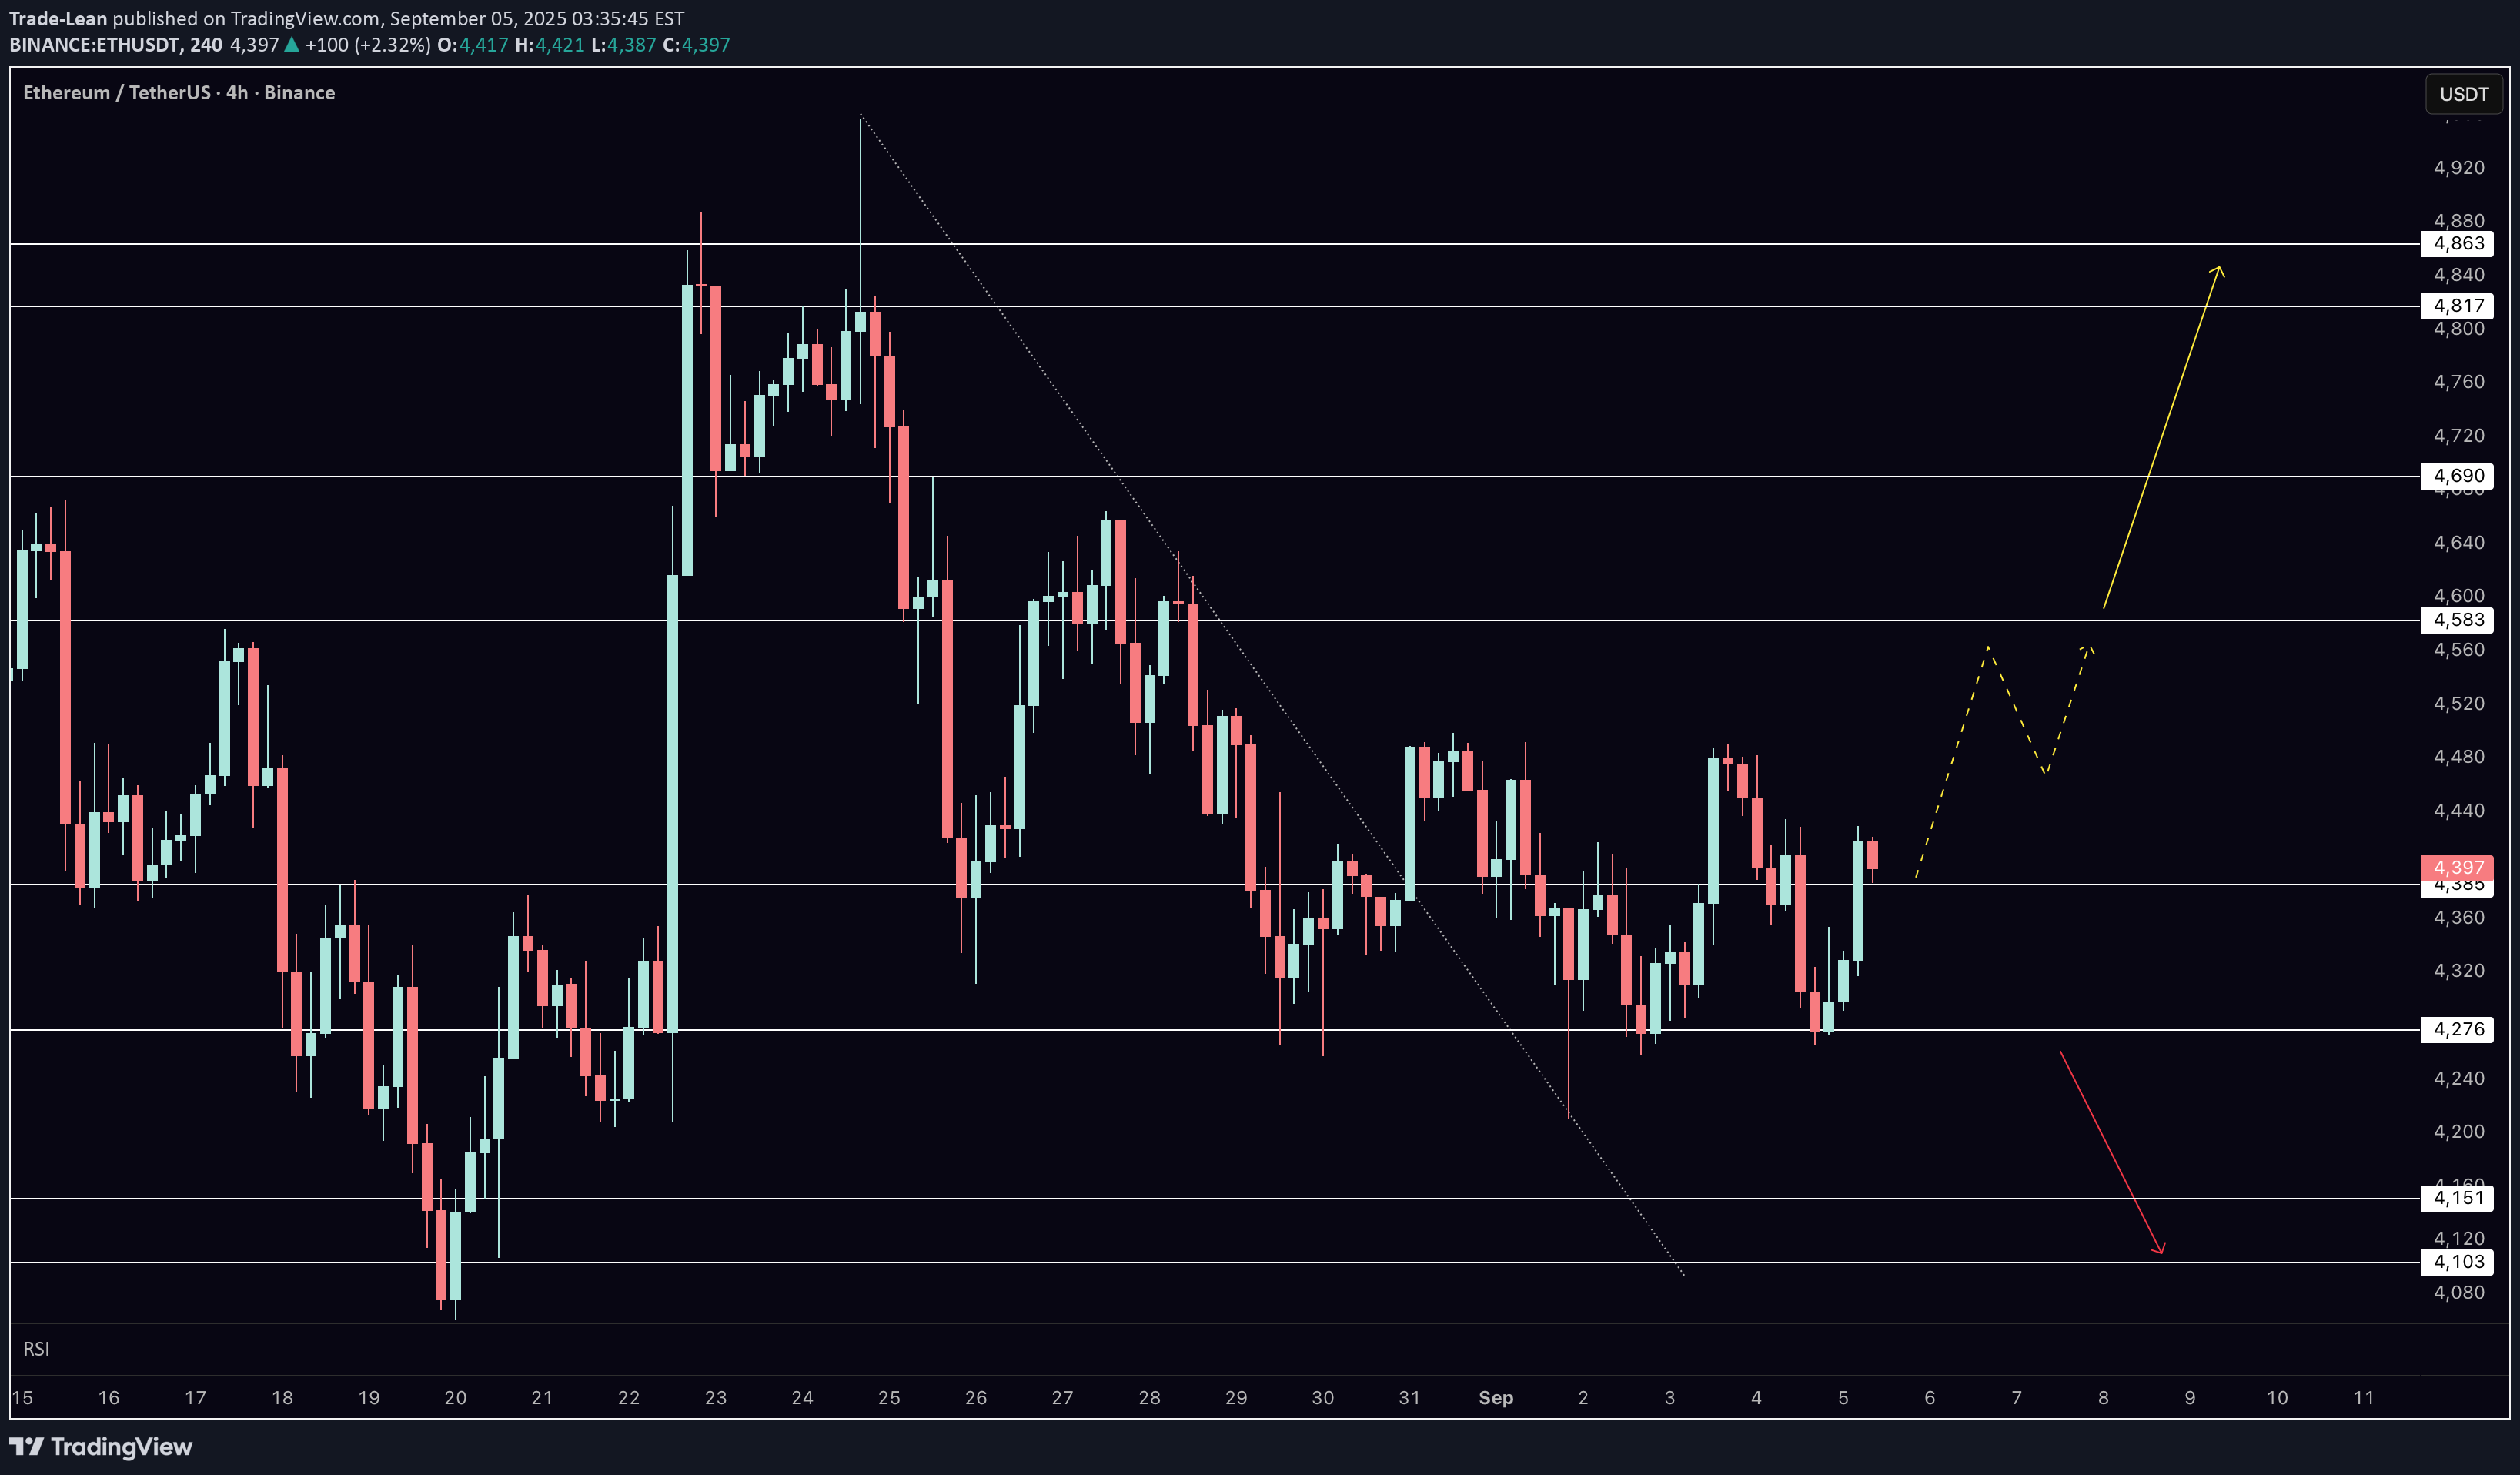
Ethereum is trading right at key resistance on the 4-hour chart, and today’s price action could set the tone for the next major move. After defending support at $4,276, ETH has bounced back into the $4,383 level, where buyers and sellers are now battling for control. In this video, I break down the short-term roadmap, explain the critical support and resistance levels, and outline the scenarios that could unfold depending on today’s reaction. With the U.S. NFP release adding volatility across markets and Bitcoin showing fresh bullish momentum, Ethereum is at a decisive moment. A confirmed breakout above resistance would open the path toward $4,582, $4,689, and $4,862, while failure to hold support shifts focus back to $4,148 and $4,103. Watch closely — the coming sessions are likely to provide clarity on whether ETH is ready to extend higher.
Trade-Lean
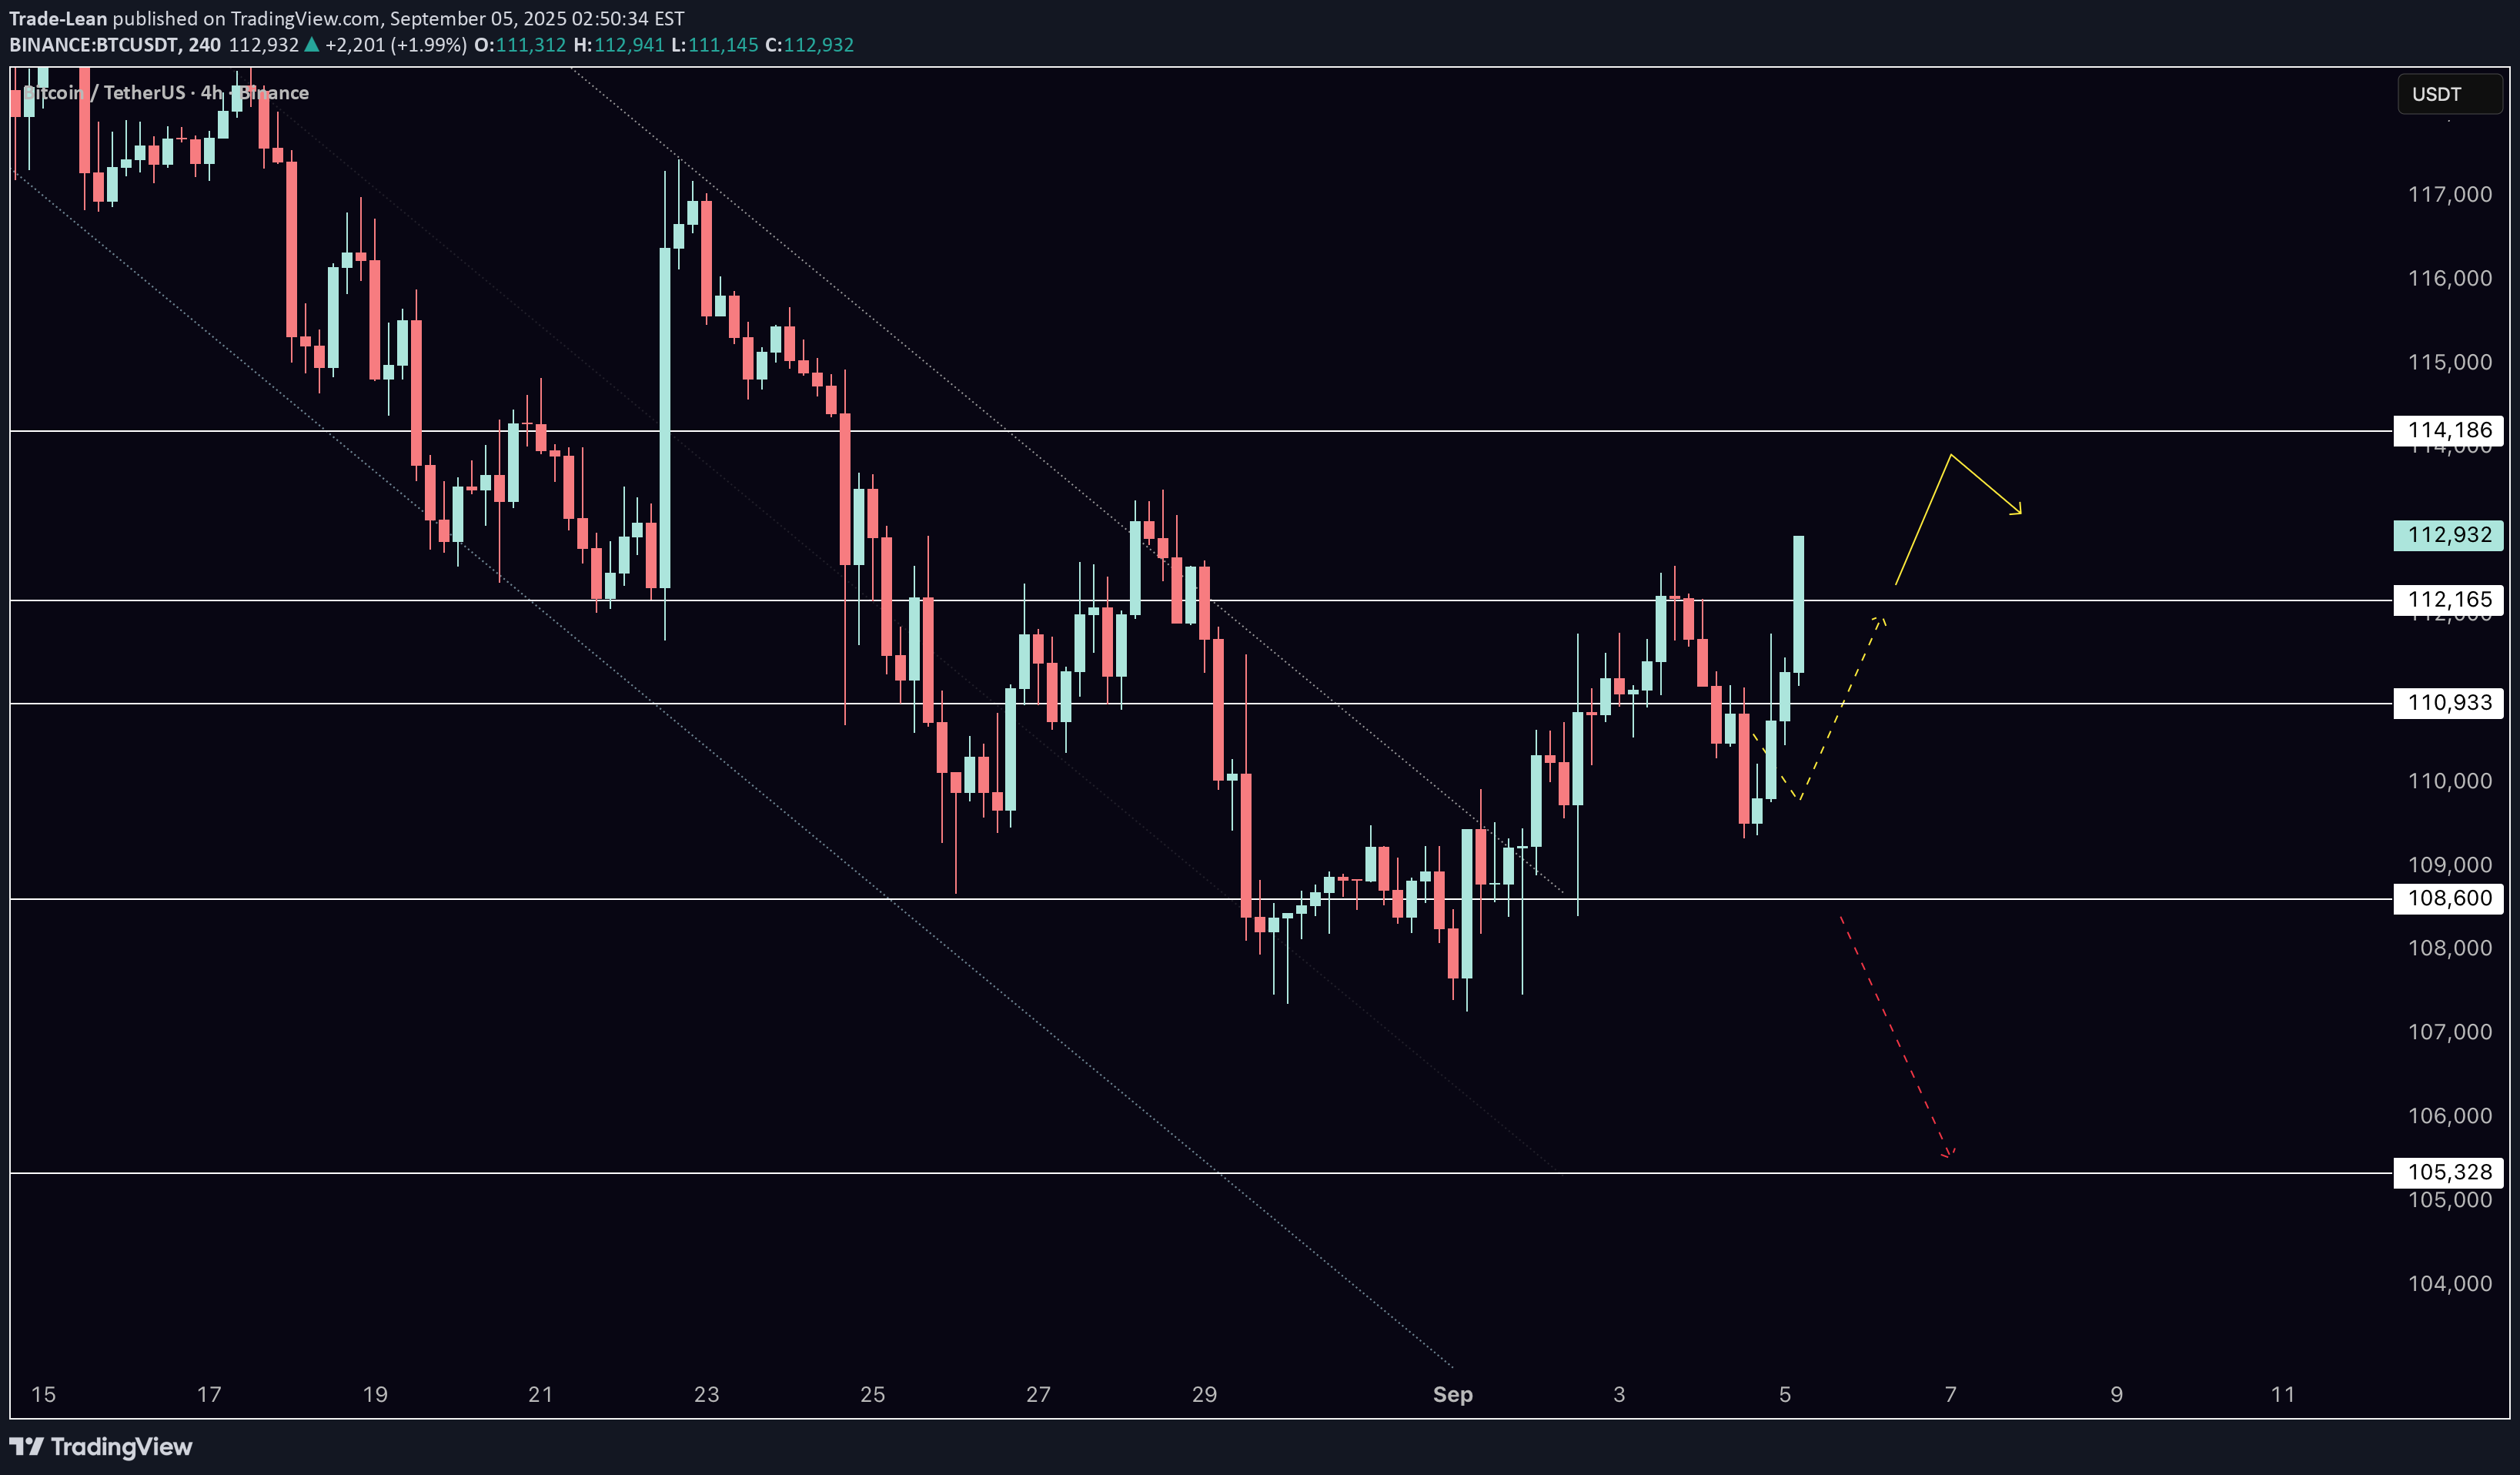
Bitcoin is testing a critical breakout above $112,168 as markets prepare for tomorrow’s Non-Farm Payrolls report. The 4-hour chart has shown positive momentum, with BTC clearing resistance at $110,918 and pushing toward $112,856. If bulls can hold above $112K, the roadmap opens to $114,189 and $116,072. But if Bitcoin loses momentum, supports sit at $110,918, $108,592, and the deeper zone near $105,320. The jobs report could be the catalyst that decides Bitcoin’s next big move. Consensus is around 75,000 jobs, just above last month’s 73,000. A weaker report could boost risk assets like Bitcoin as traders price in more Fed cuts. But a stronger print could cool risk sentiment and pressure BTC back into support. Either way, volatility is coming, and these levels will be key.
Trade-Lean
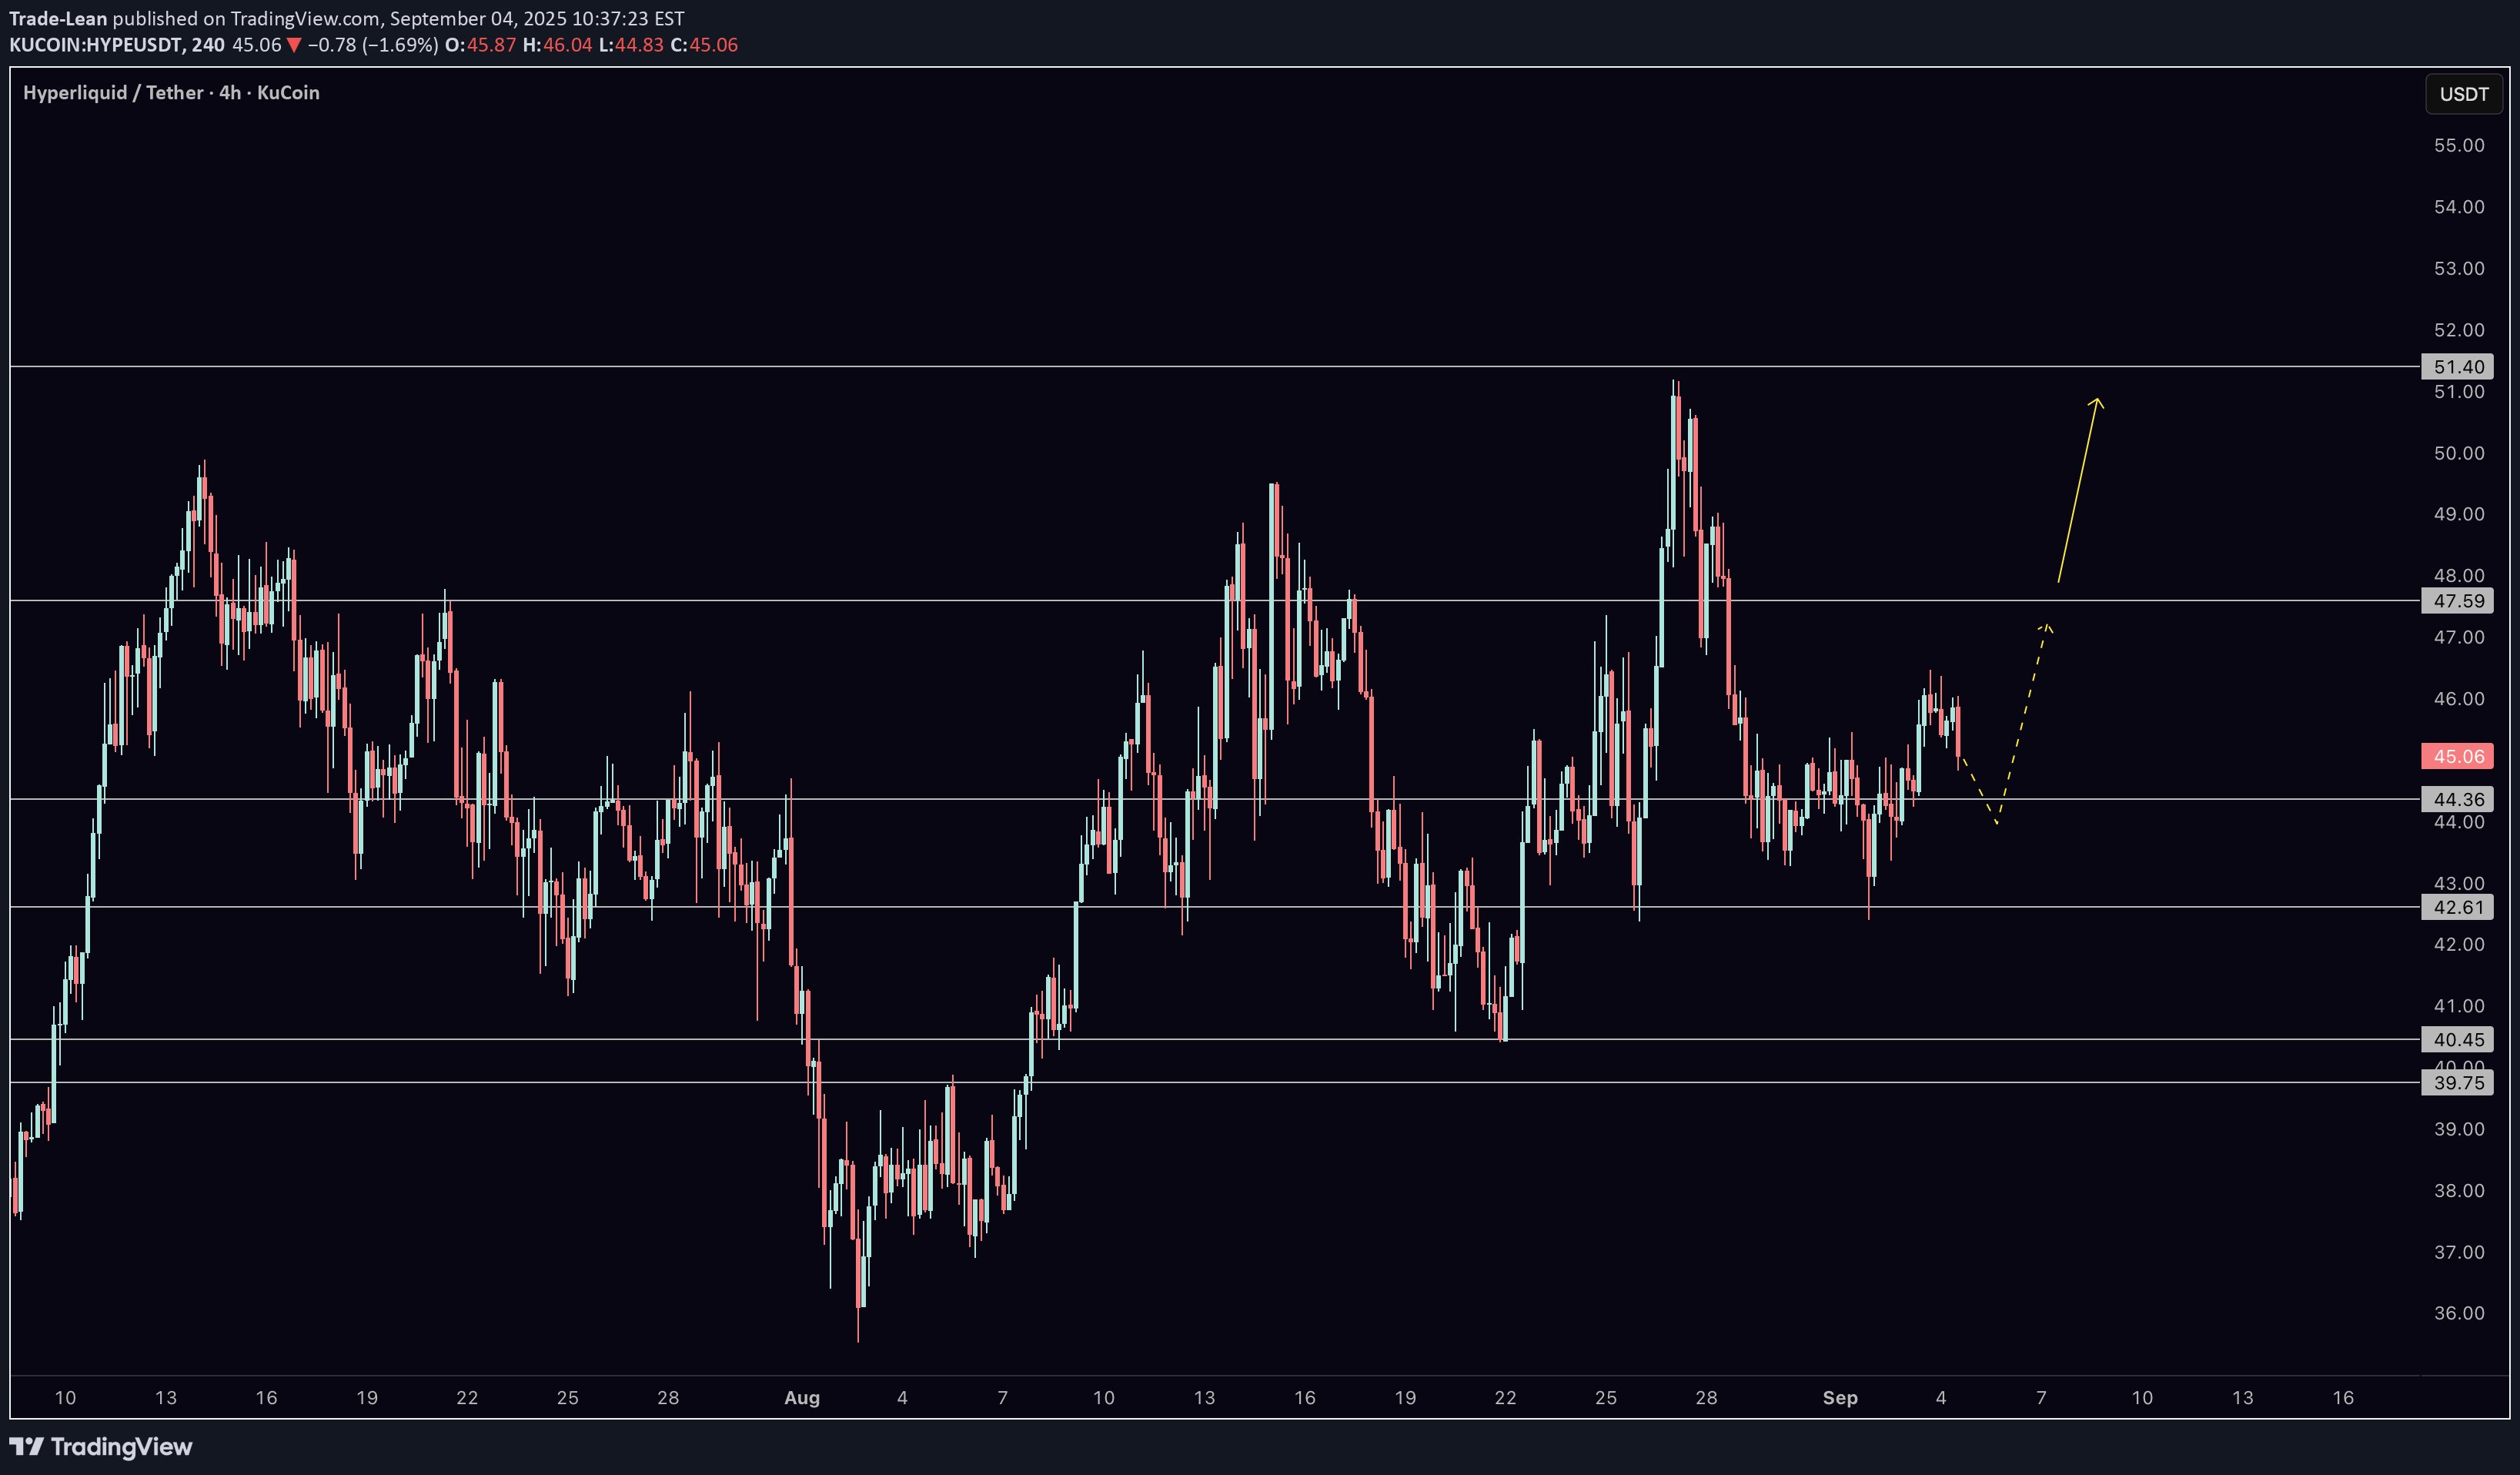
Hype continues to consolidate near the 45.95 resistance on the 4-hour chart. In this update, I break down the short-term roadmap with clear resistance and support levels. A breakout above 45.95 could open the way to 47.57, 49.32, and even 52.14 in the coming sessions. On the downside, supports to watch are 44.32, 42.58, and 40.49. The broader structure remains constructive above 38.27, and my bias continues to be for more upside as long as that foundation holds. Watch these levels closely as they will define the next move for Hype.
Trade-Lean
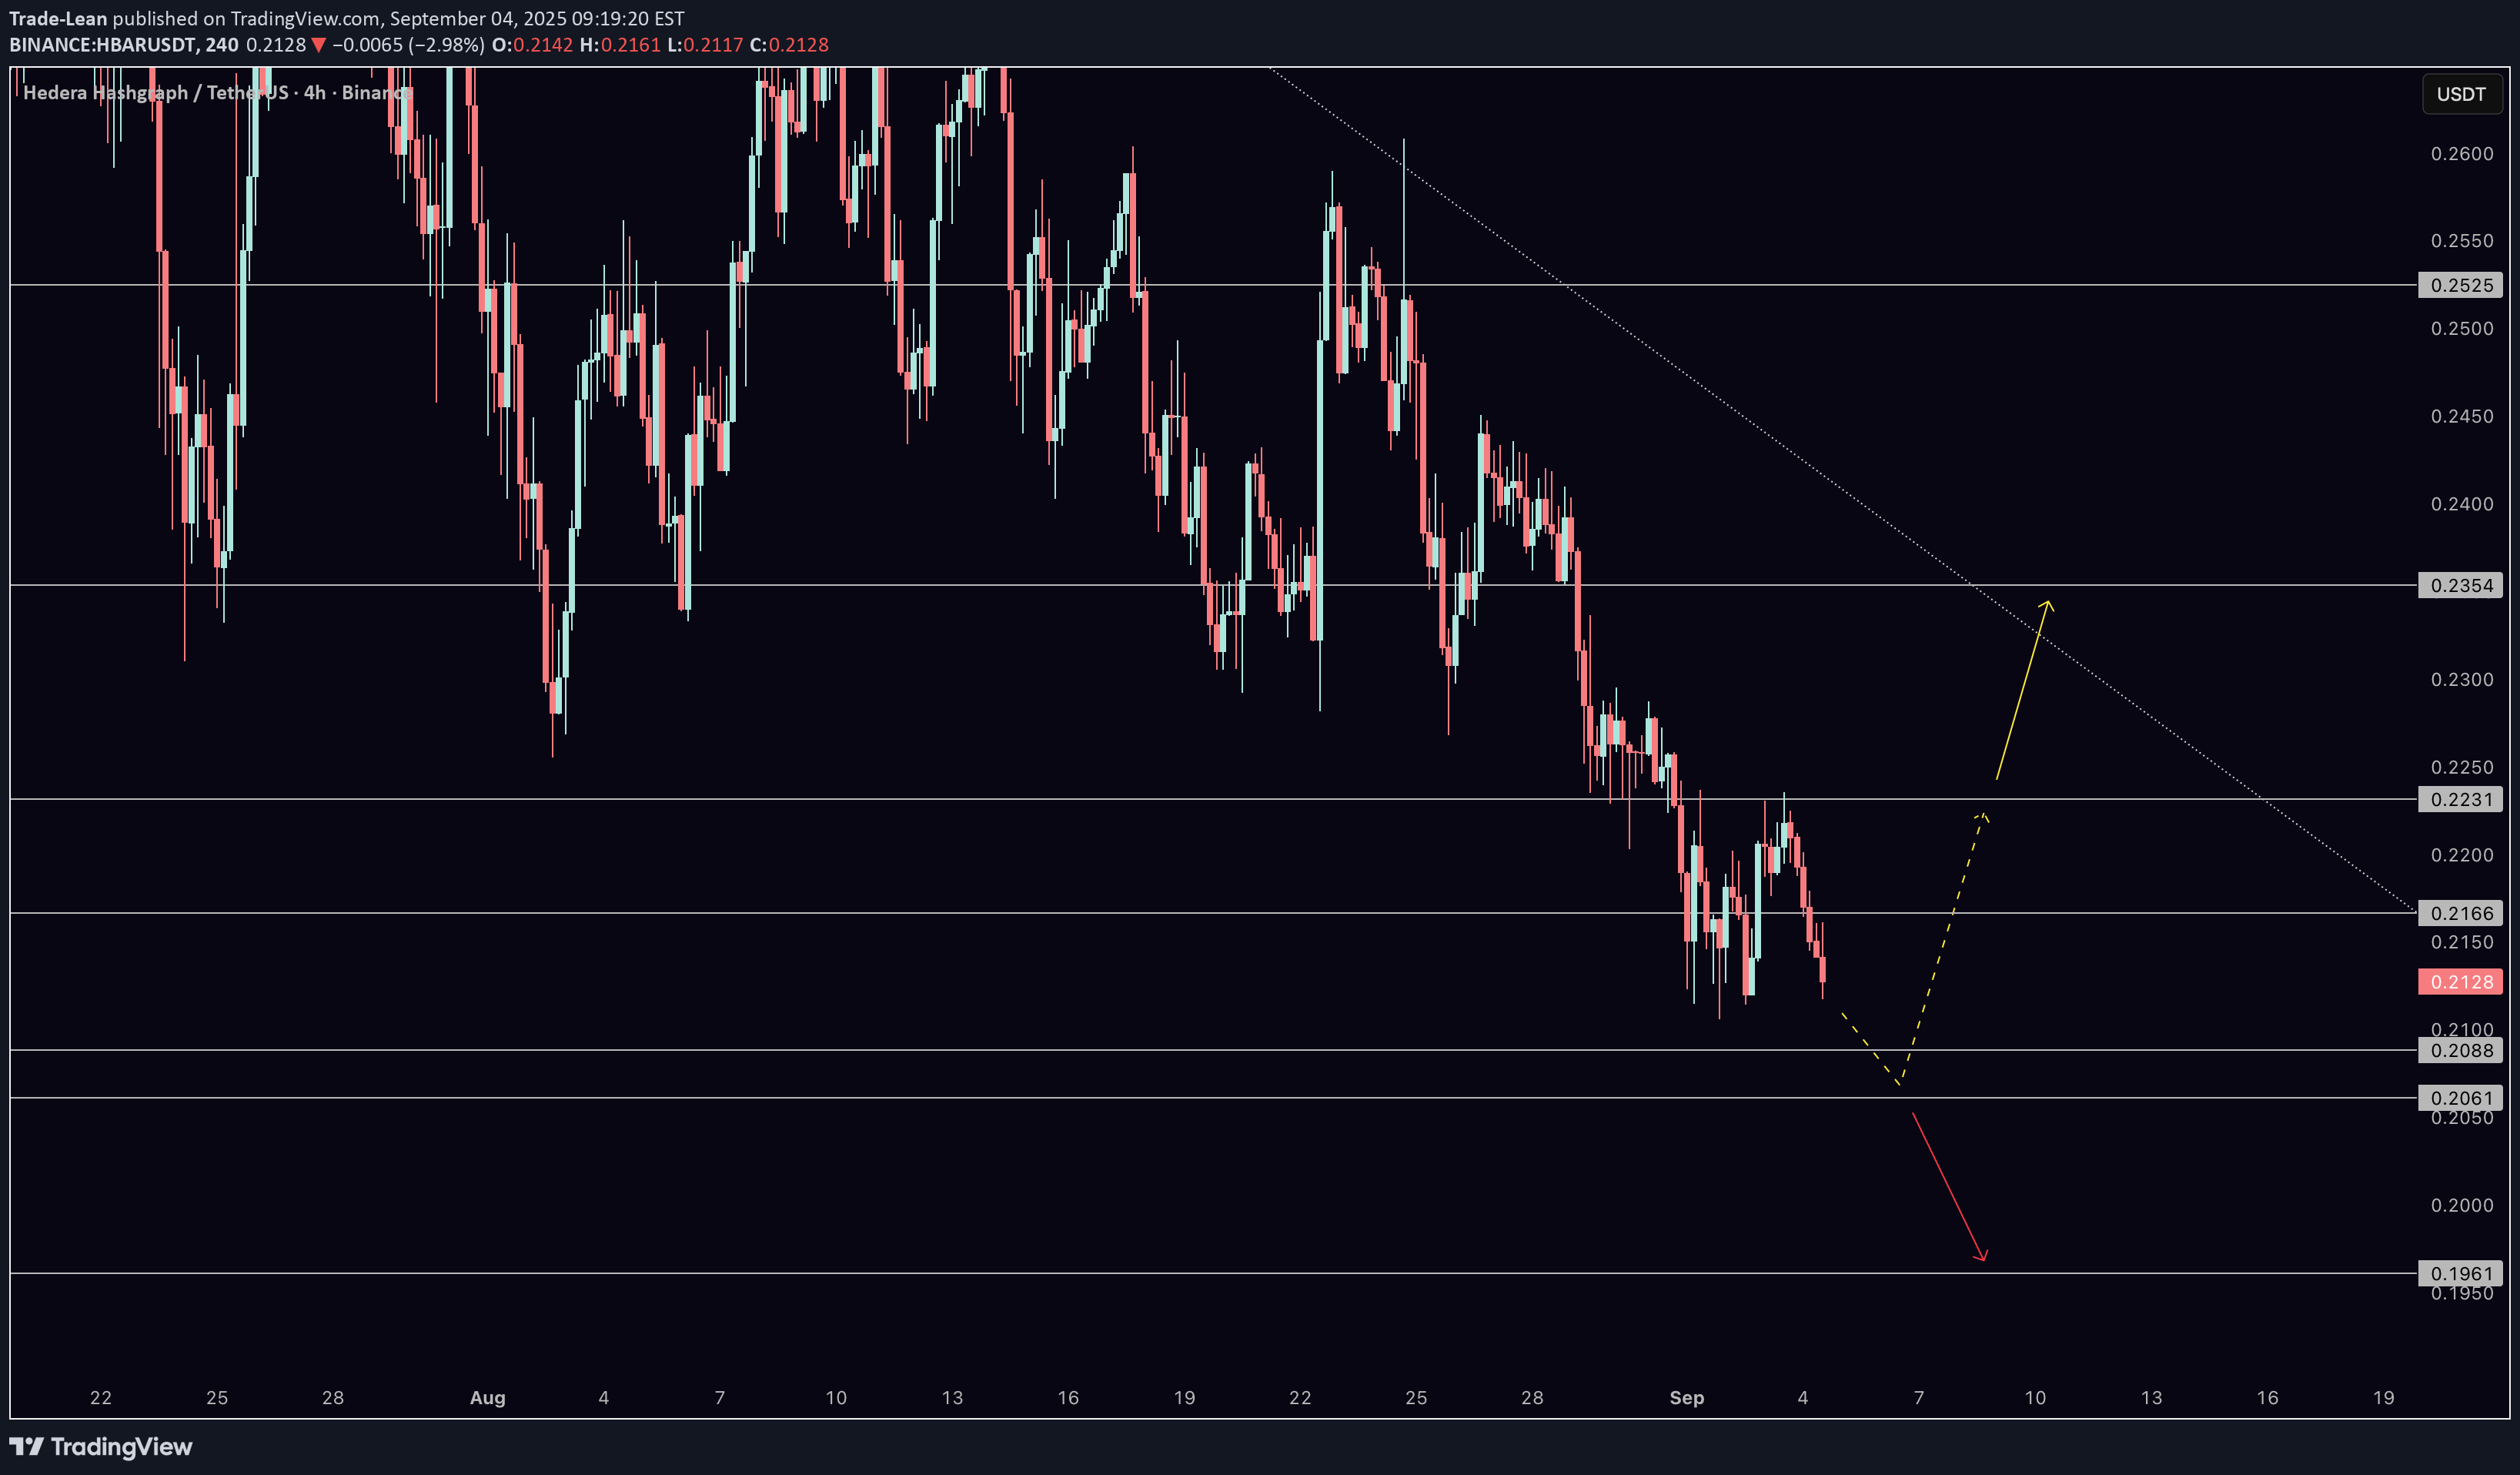
Hedera HBAR is approaching a key decision point on the 4-hour chart. In this update, I outline the critical support and resistance levels that will determine whether bulls can push toward $0.23 and beyond. My bias mid-term remains for upside, but price must reclaim levels step by step before momentum can fully shift. We also look at how Bitcoin’s resistance battle at $112,190 connects to HBAR’s outlook. If BTC sustains recovery, HBAR has room to extend toward $0.24–$0.25. If not, downside levels at $0.20 and $0.19 become the key defense lines. Watch this analysis to see what to expect next.
Disclaimer
Any content and materials included in Sahmeto's website and official communication channels are a compilation of personal opinions and analyses and are not binding. They do not constitute any recommendation for buying, selling, entering or exiting the stock market and cryptocurrency market. Also, all news and analyses included in the website and channels are merely republished information from official and unofficial domestic and foreign sources, and it is obvious that users of the said content are responsible for following up and ensuring the authenticity and accuracy of the materials. Therefore, while disclaiming responsibility, it is declared that the responsibility for any decision-making, action, and potential profit and loss in the capital market and cryptocurrency market lies with the trader.