
This_Guhy
@t_This_Guhy

What symbols does the trader recommend buying?
Purchase History
پیام های تریدر
Filter
This_Guhy
وحشت مردم بازگشت؛ آیا بیت کوین دوباره به منطقه امن خود رسیده است؟
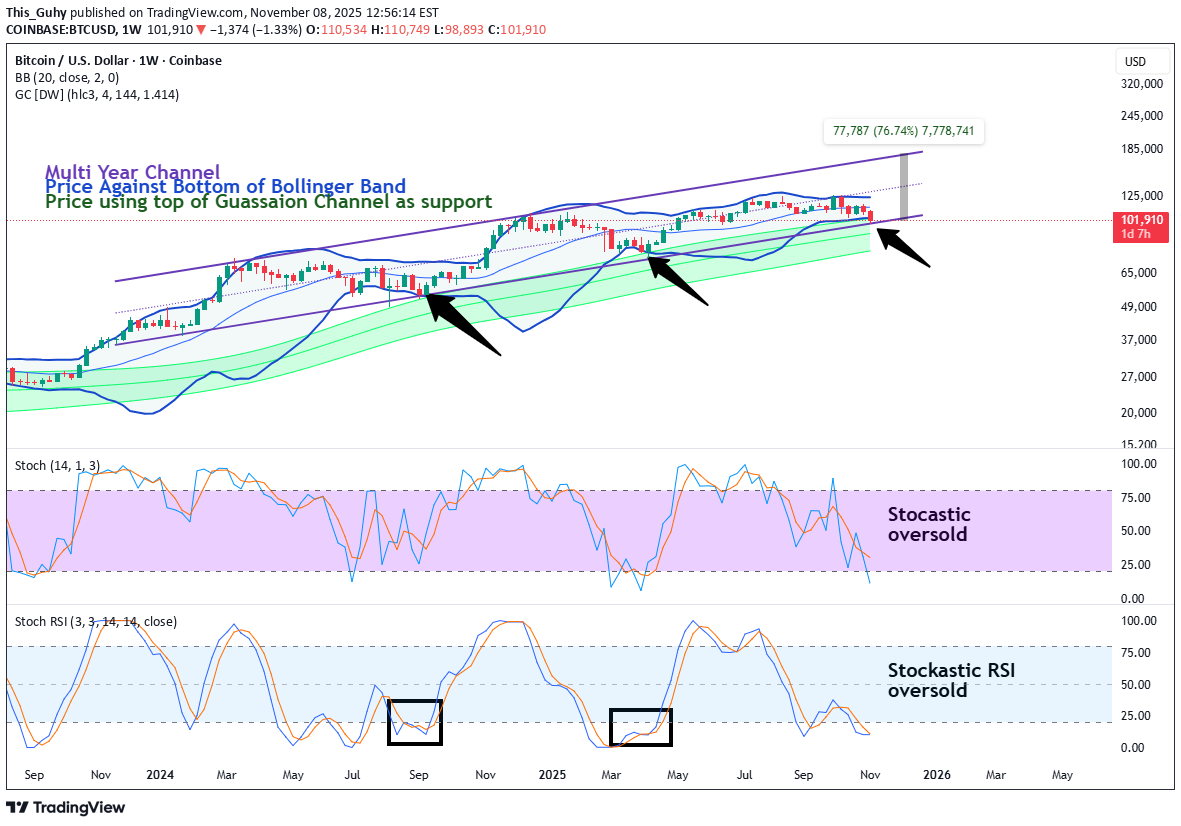
Bitcoin has been channeling up for about a year pretty consistently. The basic technical supports are still working. Price hits the weekly Bollinger band bottom, wicks through, builds structure and reverses to a new high. Price has also been bouncing off the top of the weekly gaussian channel. That's very optimistic as well. So, these ideas main point is the "Trend is your friend until the end." What has really changed? Global liquidity is still going up. The various fiat currencies are being debased. Anti-fiat hedges like silver and gold are making all-time highs. In a bull market you buy the dip and sell the rip. This is the dip. The rip is over 70% away at $175k. None of this means get reckless. We still have trendlines on lower time frames and lots of potential chop that can occur. There isn't a clear reversal pattern yet. BTC could make a inverted head and shoulders, a double bottom, all sorts of potential nonsense. And lets be upfront, the channel could break down. Price could go from the top of the Gaussian channel to the bottom, etc. But so far my bias is continuation. Entries are going to be sought out on the daily and 3 day charts. Alts showed a lot of strength recently. Others.d/bitcoin looks very bullish here at support. I expect it to chop up the next year quite well. Others/eth has a double bottom. Bitcoin is stabilized. Alts are basing out against bitcoin and eth. Finally. This is a great time to go long. Have a strategy. Layer a portfolio. All that stuff I can't actually advise you to do because I am not a financial advisor. I just share why I'm personally going long on crypto.
This_Guhy
Gold at major targets; stall and retrace likely
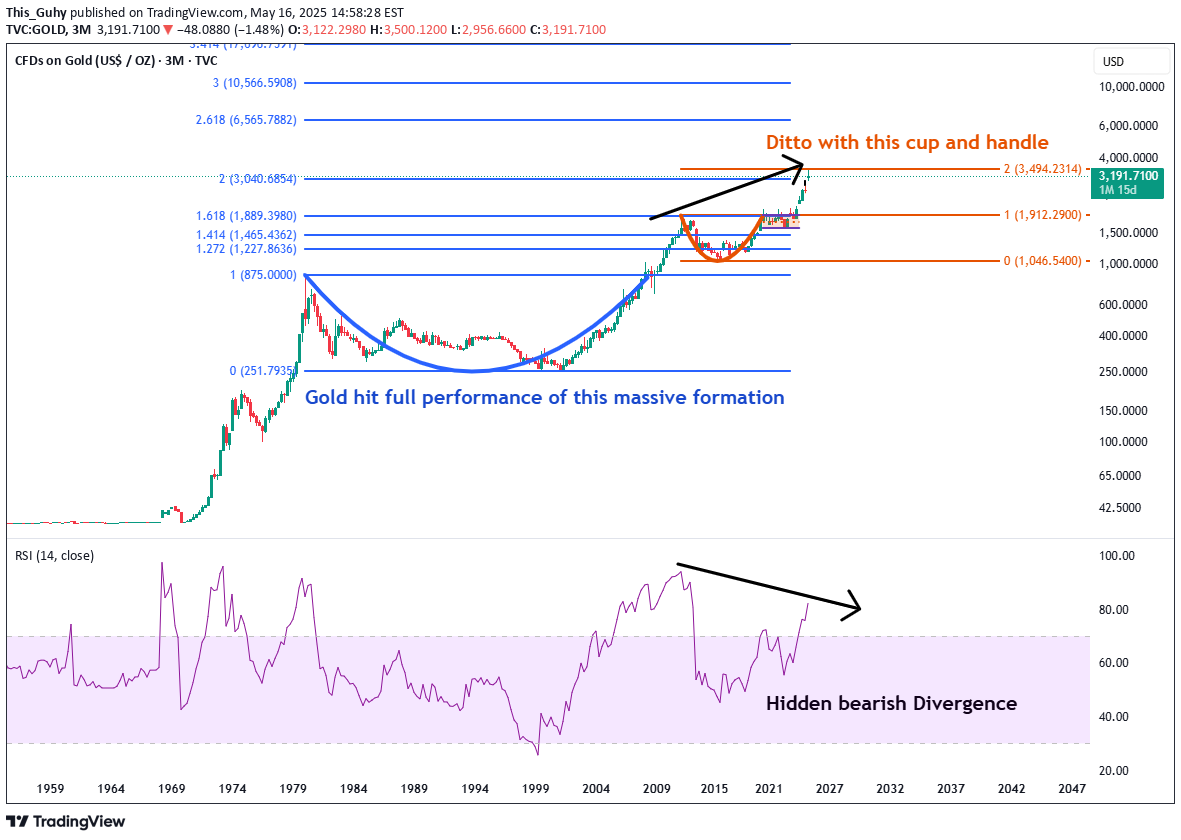
This is relatively simple post idea. We have two formation. One is a multi-decade pattern in blue and one is a muti year pattern in orange. Simple fib draws show both have reached full performance. We can also see that the RSI is in the process of setting a lower high. This reenforces my bias that Gold will be having a very serious pause right now. Just how intense remains to be seen. But a retrace to retest the previous cup and handle support as resistance would be a very normal movement for support and resistance traders. that would be a ~40% pull back from here. Very painful for people looking for momentum. Provisionally I am keeping this draw on the GoldSilver ratio. Whether this means Gold will fall faster than silver or gold and silver diverge remains to be seen. It also doesn't help that the news cycle has picked up on the gold move way too late. Of course.
This_Guhy
DXY Descending Triangle predicts Bitcoin Rally

Introduction The simplest and most powerful long term relationship or indicator we have for the price of bitcoin is the DXY (the dollar index against a basket of other main currencies comprised of US trade partners). Therefore long term chart formations in the DXY can help crypto traders or investors make very profitable long term moves. Those that ignore this inverse relationship do so at their peril. Current analysis A pain view of the top chart shows two fat pairs of arrows that show when bitcoin went down and DXY went up. It also has two skinny arrows that show when DXY falls Bitcoin rises. Clear and irrefutable. What is up for debate right now is if the descending triangle I note is valid. There are several good DXY ideas out there right now but none seem to have taken this wider view: tradingview.com/symbols/TVC-DXY/ideas/ DXY Zoom In Everything is basically on the daily chart. DXY is actually at its 4th lower high and this current high is stalling right at the previous support of the double top of April to June, 2024. The indicators show clear hidden bearish divergence. For those that need a review, here is the simple divergence primer: Normal Divergence (Trend Reversal) Bearish: Higher highs on price action but lower highs on the indicator Bullish: Lower lows on price action but higher lows on the indicator Hidden (Trend Continuation) Bearish: Lower high on the price action and higher highs on the indicator Bullish: Higher low on the price action and a lower low on the indicator Hidden bearish divergence suggests the downtrend will continue and DXY will continue to fall. Weekly DXY Guess what? The weekly DXY looks like hell as well. This rising trend line was previously acting as support and is now acting as resistance. Conclusion I see no reason why the powerful and clear inverse relationship between dxy and bitcoin should not continue. Basically everything in the “anti-fiat” or “weak dollar” categories should act predictably while this descending triangle plays itself out. This trade or posture doesn’t require fancy indicators or complex theory. Just basic charting supported by some minimalistic indicators to add a bit of richness to the technical analysis and fundamental relationship between Bitcoin and the DXY. I am long crypto in one form or another. I have a coupe of rotations planed out for the next year. Wish me luck. Please see linked ideas for some other ideas that inform my current thinking.A couple of weeks have passed since I published this idea and we can see from the chart below that bitcoin has clearly gotten above its previous resistance line and DXY is clearly reversing at its resistance line. Moreover Bitcoin is now in its third week with candle bodies above the previous resistance line. Looking more and more promising for crypto and BTC specifically.Bitcoin continues its second month going sidewats under the 1.212 fib level. I assume that there will be a quick move up. Hopefully bitcoin wont stall to long at the 1.414 level and we can see it reach the 1.618 or 2.0 level shortly. The 2.0 level is of course the least likely and if we reach that target I will be cashing out.
This_Guhy
Bitcoin Monthly chart about to be fully bullish

Introduction Bitcoin has been winding up above its previous top for many months. If you check the chart habitually or have been in an altcoin that has been bleeding out while bitcoin has been going sideways this has been a very painful time for you. Somethings got to give very soon. Indicators The most important indicators for this chart are going to be the weekly and monthly Stop and Reverse Indicator. These are desiged to approach price action from a previous high or low and when price action hits the SAR the next Sar begins from the previous high or low. For example, when the price action rises to hit a SAR that is above it the next SAR appears beneath it at the value of the previous low. It then will approach the price action based on its formula. From Wikipedia the concept draws on the idea that "time is the enemy". Thus, unless a security can continue to generate more profits over time, it should be liquidated. The indicator generally works only in trending markets, and creates "whipsaws" during ranging or, sideways phases. Therefore, Wilder recommends first establishing the direction or change in direction of the trend through the use of parabolic SAR, and then using a different indicator such as the Average Directional Index to determine the strength of the trend. Right now price has been going sideways and the Monthly SAR is beneath price action. Given the total context this is bullish. The Weekly SAR is above price action. So price is being compressed between two different indicators that have been programed potentially into countless of bots and algos to determine bias. Countless other traders have alerts that will signal when the monthly or weekly SAR are touched by price action so they can reassess the charts. I have simplified the ADX to just the DI+ and the DI-. My linked idea will show I called the end of the bull market down to the week it ended. Since the bear market ended we don't see anything to concerning with the DI +/-. We are not in bear territory and our bias is still bullish. As price goes sideways and up I expect to see an upswing in DI+ and downside to DI- In a macro bull on the bullish time frame you actually add to your positions when the weekly time frames are bearish. We can see price action is currently bearish on the weekly time frame as the DI- is above the DI+. This is when you buy if you have "strong hands" Price Action Large moves require structure and they require wind up. If you have been focused on the daily or weekly charts you might have missed the fact that bitcoin has clearly been creating structure on top of its previous high . So long as it continues to do so the bias is more upside. Price can wind up below a previous high before legging upward or downward. But so long as it closes above the previous high we continue to set a higher high. What to look for Its quite simple. We are looking for price action to, on a monthly basis, stay above the blue box and continue to go sideways and then up. We are also looking for the weekly SAR to flip and then both monthly and weekly SAR will be bullish. From there the next major target is for bitcoin to roughly double at the 2.0 Fib level around 125K. Anything above the 2.618 fib level for the next market cycle top is too greedy for me. Of course, if bitcoin closes a monthly chart below the blue box, of hits the monthly SAR and flips that to bearish then this idea is negated.
This_Guhy
Fantom Inverse head & shoulders to reclaim last six month losses

Good afternoon Lads, The last six months have been very painful. I have been buying more and more crypto but my account goes lower and lower as things find their bottoms. But my total stack of crypto in terms of unit of account has gone up. There hasn't been much to post. But now I have a reversal structure in the shape of an inverted head and shoulders. So far this pattern has developed over around 70 days and its pretty close to the neckline. This is basic charting and Elliot wave theory. Price had an initial uptrend. This creates an opportunity for profit taking and a pull back. We can see that in the ABC correction. We have completed a reversal pattern around what use to be previous resistance (the black triangle). In short order we should see the price of fantom double. That is almost cute compared to what we are looking for in the long run. Here is a Fibonacci extension our current impulse and correction. Hitting 1.618 and 2.618 targets is standard long term targeting. That is an 11x then a 90x if you have strong hands Those targets become cute themselves when you look even further out. In a year, when things seem to have gone absolutely crazy and crypto and the world has lost its mind I expect to see fantom up there over 700x. I expect massive and vicious pull backs on the way centered on the 0.618 and 0.786 levels. But that won't matter to me. I will have reached my financial goals way before then. 54 weeks are left in the cycle. The longer we go sideways after the halvening the better I see the upside being.So far I am quite pleased with how this inverse head and shoulders has played out. It seems in short order a consolidation will be completing and price action will go on its next leg up. We can see price consolidated at the inverse head and shoulders 1.272 fib level and has created a diamond continuation pattern (unconfirmed, yet to break out). my strong assumption is we will see more upside and stalls at the 1.618 ($0.85) and 2.0 ($1.1) fib levels.
This_Guhy
Bitcoin Hidden Bullish Divergence Post Halving: Hold or Buy

The Bitcoin halvening puts the price action of bitcoin on a four year cycle that so far has resulted in a higher high each cycle. Until that changes the best money to be made is by incorporation that periodicity into your trading plan and figuring out when to buy, sell, and hold. In a bull market you are suppose to "buy the dip, and sell the rip." But not all dips are equal, a nd one thing that sets dips apart is divergence. Divergence Primer Normal Divergence (Trend Reversal) Bearish: Higher highs on price action but lower highs on the indicator Bullish: Lower lows on price action but higher lows on the indicator Hidden (Trend Continuation) Bearish: Lower high on the price action and higher highs on the indicator Bullish: Higher low on the price action and a lower low on the indicator We clearly see that we have some hidden bullish divergence. We can also clearly see that the RSI is "oversold" just 65 days after the bitcoin halvening. Historically this is a great time to buy. A look at the 2016-2017 bull market shows buying hidden bullish divergence and/or when the RSI got to over-sold on the daily chart was a outstandingly simple but profitable time to put in some buys. Those price levels were NEVER reached again on a retrace. Without exaggeration and irony after this pull back bitcoin may never return to this price again, give or take a day or so for a base to be put in. At this point, the only reason I can see to sell bitcoin is to buy alts that look good or because you have some bills that you must needs pay to remain solvent. But of course, I am not a financial advisor and even if I was, I am not your financial advisor. My best call in a long time has been my FTM trade. FTMBTC recently itself just had the RSI go to over-sold and it looks like price action is turning previous wedge resistance into support. I have currently moved up the risk curve and am in a small cap coin that is out of the top 100 in market cap. So far its been painful but in the long run I think the rotation will pay off.
This_Guhy
Bitcoin Hidden Bullish Divergence Points to Impulse

Introduction This is a birds eye view post. We have had the usual stall and consolidation after the halvening and things have started to get lively. Due to all of the tokenomics of bitcoin, with the havlvening, its periodicity, and so on the move is going to be impulsive and sustained. The charts reflect that. Important Indicator considerations A MACD crossing the signal line above zero is generally bullish. A chart displaying some divergences helps predict a MACD cross will be sustained. This is basic pattern recognition. We have hidden bullish divergence, which suggest we will have trend continuation. The timing on the pattern is perfect. Divergence primer Normal Divergence (Trend Reversal) Bearish: Higher highs on price action but lower highs on the indicator Bullish: Lower lows on price action but higher lows on the indicator Hidden (Trend Continuation) Bearish: Lower high on the price action and higher highs on the indicator Bullish: Higher low on the price action and a lower low on the indicator My plan I have moved into low cap alts. Those provide me outsize gains similar to playing the top 10 with margin but without the risk of being liquidated. My peace of mind is so much more stable up the risk curve so long as I won’t get liquidated. I have some rotations planned out and based on my how my account is doing I now have to start paying attention to the 2% Depth data on coin market cap to make sure I don’t have liquidity issues. I am also taking quite a risk because I am not sure some of these projects won’t become the next Luna or FTX token that goes to zero. There is zero percent chance I hold those bags through a bear market. For example, here is KAVA. I expect a quick move out of this triangle to the 0.618 retracement level. 4.6x for a 120-150 day move Very similar to my fantom trade. I of course was NOT able to nail the high but it was close enough.
This_Guhy
Solana Battle Plan Update 3: Price to reverse at Local High

This is my 4th idea looking at Solana with Ethereum as a pattern, benchmark, or comparison. I used this pattern to identify downside targets and potential reversals and now I am using it to call a local high. This is basic and fundamental charting. Both charts show a 5 impulse Elliot Wave to the upside. With such a clear pattern and impulsive move we don’t see a continuation pattern yet. We Solana does not show an ascending triangle, a cup and handle, or even a symmetrical triangle. Without a continuation pattern we must suspect price will stall at a previous support. Seeing where price flipping support to resistance and vise versa at key levels is one of the basics that can take years to master. That previous support is the bear trap that was created at the beginning of the bear market. We can see on the right where it played out with Ethereum and I strongly suspect we are seeing the initial stages of that reversal in Solana. Of course, there are some key differences in the two charts. We can see that when we look at other indicators. I don’t want this idea to become unmanageable so I will just look at one of the basics, the Monthly Bollinger Band. It is pretty clear that looking at the Bollinger Band it looks like Solana did a much better job than Ethereum. Solana has pushed its head above the monthly Bollinger band to reach the previous bull trap whereas Ethereum didn’t even reach the baseline. But either way, price being out of the monthly Bollinger band or near the middle with weekly bearish divergence at previous support still suggests reversal. I do hope to see the lower limit of the monthly BB to snug up and flatten off to indicate a local low is in when I see Solana double bottom. Solana Against Bitcoin, Ethereum and BNB Solana also looks like it is in a dreadful position against Bitcoin. The zone of resistance is drawn, in part, due to the MACD oscillaton below zero and the amount of sideways action we needed to have that happen. The bearish similarities with Solana and trading pairs continues with Ethereum. BNB has a bit of a different set up. It does not have a clear bull trap like SOL has against BTC and ETH. Rather it had a descending triangle top and a return move to the support of the triangle. Price has returned to the base of the descending triangle and I think with the indicators so overbought we would assume another pull back. Conclusion and my plan Solana looks like it has hit a local high against USD, BTC, BNB and ETH. There are so many temptations to get out of Solana into a different larger, less volatile token that I don’t see most day or swing traders holding onto Solan for long. Especially margin traders. Timing the shortside can be a wee bit tricky but it can be done. I am staying away from that. I suspect that Solana will be setting a higher low W pattern. If it does, I will basically be rotating everything I can into it as I expect it will be making a higher high. AS the main chart shows that higher high would be about 100x from the low. If it sets an equal low, then I will suspect it will roughly return to an all-time high. That would be about 25X. That is decent enough for crypto but in all honesty if Solana sets a lower low, I will be looking for a different token to rotate into. Right now, my biggest crypto bag continues to be Fantom as I really like the Big W pattern it is in.I still think this will be a W pattern. This is a unique chart. The fibs are on the standard scale but the chart is on the log scale. The retracement hit the 0.786 level and now I think it will zig zag down. I am looking to buy around $15 and below.The W pattern I was hoping for and therefor the second low I wanted to buy never materialized. I was quite taken by surprise while this went to all time high. There were some other trades I was in so it isn't like I have sat this whole cycle out but this has been a tremendous rally. Way more bullish than BTC and ETH were in the 2018-19 bull market. If this is a V shaped recovery I would expect to see SOL moving ultimately to about $2,000 after a stall at $6,00 based on the fibs below. The orange draw is a fib extension and the black draw is a fib retracement and there is a lot of confluence at about $2,0000
This_Guhy
BTC Monthly IchiMoki Cloud and On Balance Volume look Amazing

BTC Monthly IchiMoki Cloud and On Balance Volume look Amazing Introduction I have been waiting to do this idea for over a year and it seems that the moment is finally pregnant. When I saw the W pattern I did some testing and concluded that the 1.618 would be a likely target. If the situation became properly bearish the reversal could possible take out the low of the W. Many harmonic and cypher patterns, upon reaching some intermediate targets, reverse to take out the W patterns. In this case we see that the price has found support on the previous ATH, consolidated, and continued it’s march upward. As such, the new target is now the 2.618 of the previous W pattern, with a suspected considerable consolidation at the 2 level. In other words, a move to about $390,000 with a major stall at $125,000 In a perfect world we would find price stalling within a golden pocket of 5% of the fib target. I cannot be that precise right now. Indicators Ichimoku Cloud I am by no means a cloud master or a sky walker. But I can recognize patterns and to me the pattern here is clear. The bitcoin price has returned to the cloud after a significant draw down and is in the process of powering through. It has taken out the conversion line and is facing the base line as resistance. I would hope to the vast majority of readers that it seems clear that the base line is going to be flipped and we should expect a breakout to the upside. The blue boxes on our chart show the previous examples of price interacting with the base line, conversion line, and the cloud proper and it seems clear that this situation is familiar to the previous two occurrences. If we look at the W pattern we can see price stalled at the base line and there was strong profit taking above it. There is a minority chance that we are in a similar position. I would say it is less than 10%. One of the main reasons why I believe such is the volatility in from 2018 to June 2019 was too high relative to the 2014-2016 bear market. I find that low volatility bear markets occur when smart money is buying very discreetly, trying to absorb supply as gently as possible without moving up the price much. The wild swings of the W pattern do not support that notion. All that is fine. We have to adjust to the reality we see. This bear market has been lower volatility. So I suspect a more protracted move to the upside with a slower start. On Balance Volume with SMAs To speak to all of the meme speaking zoomers out there, the On Balance Volume with SMAs is low key one of my favorite indicators, fr fr ong no cap. (If you have a suspicion, then YES, I am at the age when I use slang to embarrass my kids and the next generation for my own amusement). I kinda missed the April Fools Pump of 2019 and most of the ride up looking for a pull back. In order to make sure I did not do that again I looked for something I had missed. I suspected I had a missing tool I had neglected to put into my tool box. And I looked back on various time frames I saw an amazing tool in the OBV with SMAs. I have been using it on higher time frames to help verify bias ever since. Almost all of TA is founded in two basic analysis: Price action and volume action. Falling or rising volume often confirm or negate price action patterns. Having bearish or bullish crosses on OBV SMAs help confirm the volume action that verifies the chart formations. And even more simply, the OBV SMAs help verify tipping points in buying and selling pressure. When the OBV SMAs are staked bullish (OBV over the 10SMA which is over the 20) then buying pressure has obviously been bullish and the bias is towards upside. If the OBV is below the 10 SMA and that is below the 20 SMA the bias is basically bearish. Once you get that down you can add some complexity and divergence to figure out when you are in absorption or distribution. Right now the OBV SMA situation is clearly bullish. The bias is long What this all means I am biased bullish as far as cryptocurrencies are concerned. My previous ideas detail why I am avoiding the Ethereum ecosystem in favor of other layer 1 currencies but I still suspect it will experience some middling upside. As for me, I am using my pull back strategy to try and get good prices as we go up and to force myself to not buy highs but to rather buy dips. I have my preferred alts right now and I have a few that I am waiting for to see how they handle their patterns. My linked ideas on fantom and link will show some pretty good calls. My largest bag is in fantom, and I wish it had more liquidity. But I would rather build a position in fantom over time and get outsized gains rather than dumping more money easily into a higher market cap coin. You do you. Free chart Price landed on the monthly 100 EMA perfectly. I have a strong suspicion that the next bear market will reach the 200 EMA. The chart below shows that we don’t even have a 200 monthly EMA yet. We only have about 170-ish periods. But in the next bear market I will be there, posting my buy the dip ideas and only getting a hand full of views because everyone is to bearish to believe the bottom is in.
This_Guhy
Bitcoin’s NVT and On Balance Volume turn Bullish

There are a lot of trading and investing strategies and many of them involve trying to avoid top and bottoms and just get into the meat of the move. The most powerful impulses at reduce increase gains/time. These strategies do not try to do the heavy lifting of buying the bottom or potential reversals. To such an end on bitcoin I have cobbled together a strategy founded on a core tenant of economics, the Quantity Theory of Money. Almost ever modern economic failure as been at the abuse of this economic theory, but that is nether here nor there. Quantity theory of money Here is the Explain Like I am 5 (ELI5): All other things being equal if a system prints more money the price of good and services goes up. Also, if transaction speed up then the prices go up as well. Also, All other things being equal if the money supply goes down then prices go down. If transaction speeds slows down then price goes down. So, if you have the power to influence any of the following variables in the next section you can basically make yourself rich at will, given a little patience. More complicated version (which is still a simplified version) en.wikipedia.org/wiki/Quantity_theory_of_money M*V(t)=P(t)*T M is the total amount of money in circulation on average in an economy during the period, say a year. V(t) is the transactions velocity of money, that is the average frequency across all transactions with which a unit of money is spent. This reflects availability of financial institutions, economic variables, and choices made as to how fast people turn over their money. P(t) is the price level associated with transactions for the economy during the period, T is an index of the real value of aggregate transactions. How The NVT Works with the Quantity Theory of Money Bitcoin is a payment system, called bitcoin, and the currency of the bitcoin network is also called bitcoin. When someone buys bitcoin they are buying currency of that network to use that currency network at a later point in time. The question is when to buy the currency and when to spend. This version of the NVT is very useful as it can help us determine when the currency is relatively cheap. When the NVT is in the green the assumption is that M*V(t) is low. Since we know that M increases at a steady rate in the bitcoin network we know that price being in the green is mostly a function of velocity. There is a lot of debate in economics about the extent that M and T can be manipulated, and just how far. Some people assume that velocity is fixed. With as much data as we have now, that assumption is moronic. Anyway, we look to buy when velocity is low and spend when velocity is fast. NVT Conclusion History has shown that when the NVT begins to touch the red zone that price action begins to heat up. Velocity is increasing and continues to increase until bitcoin is so hot that most people cannot afford to buy it, or resist the temptation of selling it. The current indicator action suggest rapid increases in price are coming for the next 500-700 days. On Balance Volume The on Balance Volume can be a great tool within itself, but there is some difficulty in using it with bitcoin, because the supply of bitcoin is always increasing. This is why indicators on top of indicators can be so useful. We can clearly see that when OBV is below the 100 SMA that bitcoin is in a bear market and when price finally closes above we are in a bull market. Of course, crypto bull markets are plagued by 50-70% pull backs but technically they are bull markets all the same. (And one more reason to have a pull back strategy). When the OBV passes below the 100 SMA it is a sign of continued sell pressure. In other words, it is already a bit late to be selling. When the OBV passes above the 100 SMA it is a sign that the selling pressure is letting off and the market is about to shift its overall momentum. This is especially true over higher time frames like the weekly or monthly. Conclusion I think it is clear we are in a crypto bull market that is picking up steam. On January 15th of this year I posted the idea Four Simple Reasons Bitcoin Bear Market Ended This Week when prices were at $20.8k and prices have not returned to that level. (I tried to link the idea but it showed over them main chart.) That idea used many of the same indicators that this idea is using. I am not in bitcoin. O have, as they say, moved up the risk curve into lower market cap project I favor now. I hope they run early and I can rotate out of them into other projects. I don’t think I will be able to sell the very top of this crypto market. But I do think I will be able to sell high after being in the impulse of the move and then buy back at much lower prices. Rince and repeat every halving cycle.
Disclaimer
Any content and materials included in Sahmeto's website and official communication channels are a compilation of personal opinions and analyses and are not binding. They do not constitute any recommendation for buying, selling, entering or exiting the stock market and cryptocurrency market. Also, all news and analyses included in the website and channels are merely republished information from official and unofficial domestic and foreign sources, and it is obvious that users of the said content are responsible for following up and ensuring the authenticity and accuracy of the materials. Therefore, while disclaiming responsibility, it is declared that the responsibility for any decision-making, action, and potential profit and loss in the capital market and cryptocurrency market lies with the trader.