
Thewiningtrades000
@t_Thewiningtrades000

What symbols does the trader recommend buying?
Purchase History
پیام های تریدر
Filter
Signal Type
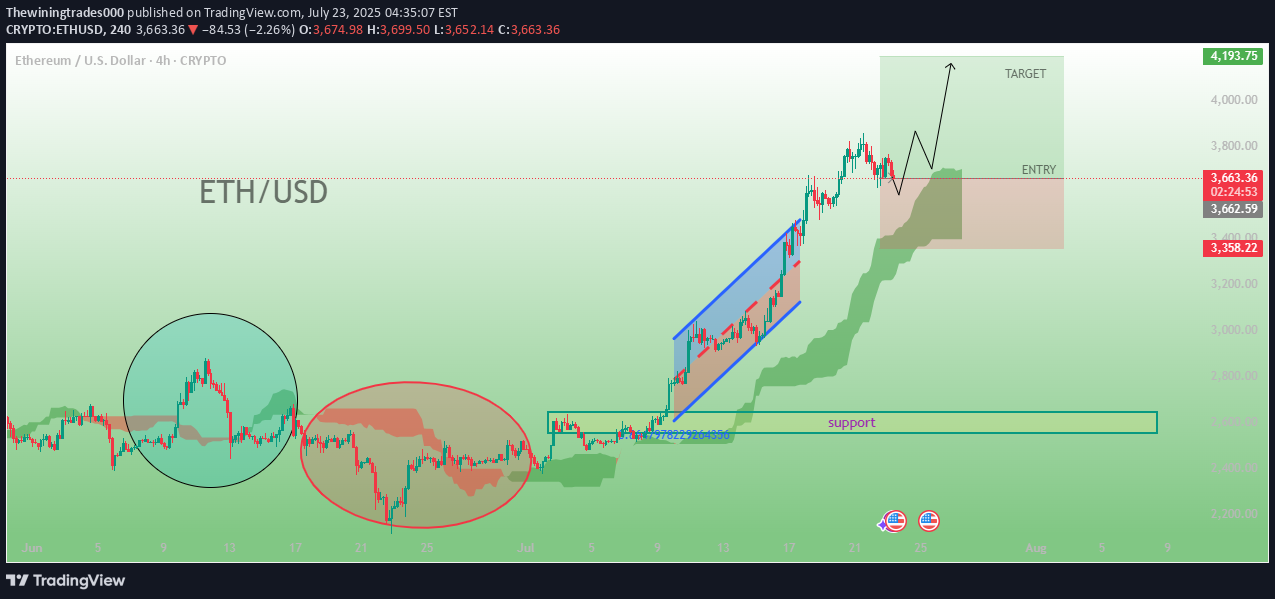
A green shaded area called the Ichimoku Cloud (or Kumo), indicating support/resistance zones and trend direction. Price is currently trading above the cloud, suggesting a bullish trend. Two Circled Zones: Blue Circle (left): Shows a local top or resistance area, possibly indicating a failed breakout or reversal. Red Circle (middle): Indicates a consolidation zone or accumulation phase, where price moved sideways. Green Box (right side): Marked with: ENTRY: The price range considered as a potential buying zone. TARGET: The projected upside target for the trade. STOP-LOSS: Implied below the green box, marked in red (around $3,358.22). Upward Arrow and Price Projection: Suggests an anticipated bullish breakout after some consolidation. Support Zone: Highlighted horizontally near the bottom of the consolidation zone, labeled "support". --- 🔹 Price and Time Data: Current Price: ~$3,658.96 (shown in the buy/sell box). Date on Chart: Highlighted around Mon 14 Jul 25 (8:00). Tabs and Tools: Multiple TradingView tabs open, suggesting active monitoring or analysis of other crypto pairs or instruments. --- 🔹 Interpretation: This is a bullish analysis with: A buy/entry zone between ~$3,500–$3,700. A target zone above ~$4,000. A stop-loss zone around ~$3,358. The user appears to be forecasting a continuation of the uptrend, based on technical indicators and past price behavior.
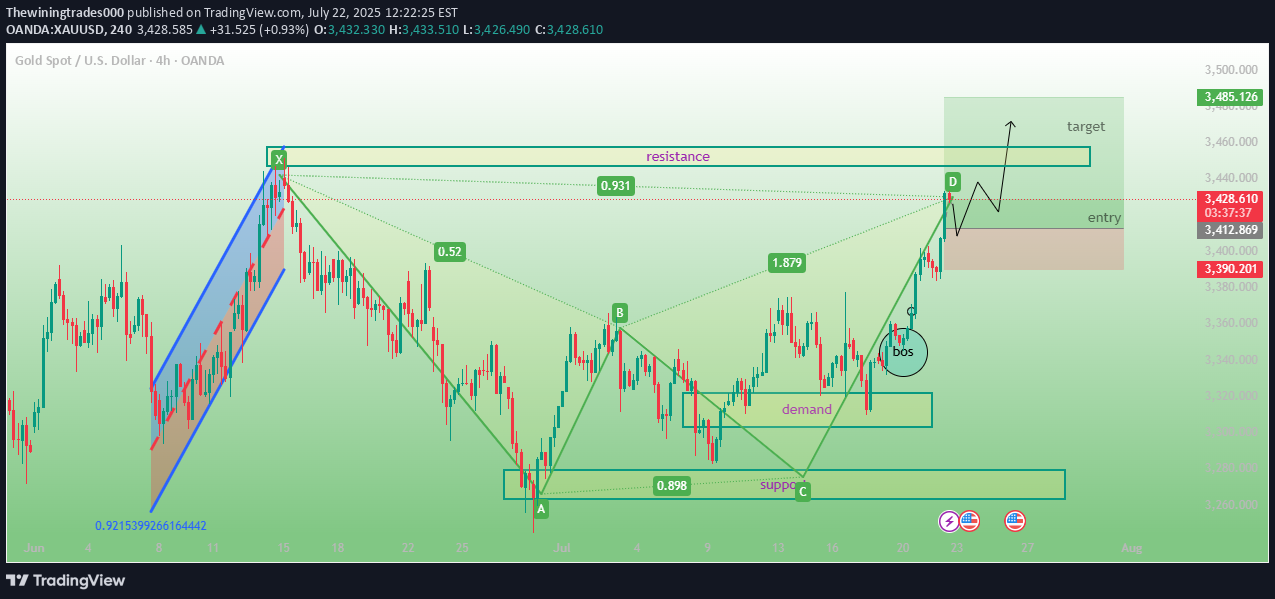
Harmonic Pattern Identified: Appears to be a Bullish Gartley or Bat pattern (labeled with X-A-B-C-D points) Completion of the pattern is at point D, signaling a potential buy entry Key Zones: Demand Zone: Marked where price previously showed strong buying interest. Support Zone: Below point C – represents a potential bounce area. Resistance Zone: Just below the target area; might act as a short-term obstacle. Break of Structure (bos): Noted in a circle, showing a bullish shift in market structure. --- 📊 Trade Setup Entry Zone: Highlighted in pink/red near point D. Target Zone: Highlighted in green above resistance (~3,485.126). Stop-loss Zone (implied): Likely below the demand zone or point C. Expected Price Movement: An upward arrow indicates anticipation of a bullish move from the entry to the target zone. --- 📚 Indicators/Tools Used Harmonic pattern drawing tool Support/resistance boxes Price labeling (e.g., 0.931, 1.679 – possibly Fibonacci ratios) Candlestick chart (no indicators like RSI or MACD are visible) --- 🔍 Analysis Summary This is a bullish setup based on harmonic and structure analysis. The trader expects the price to rise from the current level (~3,427) toward the resistance and target zone (~3,485). Entry is planned at the D-point after confirming a structure break (BOS). Risk is defined below the demand zone.300 pips runing guys wait for all
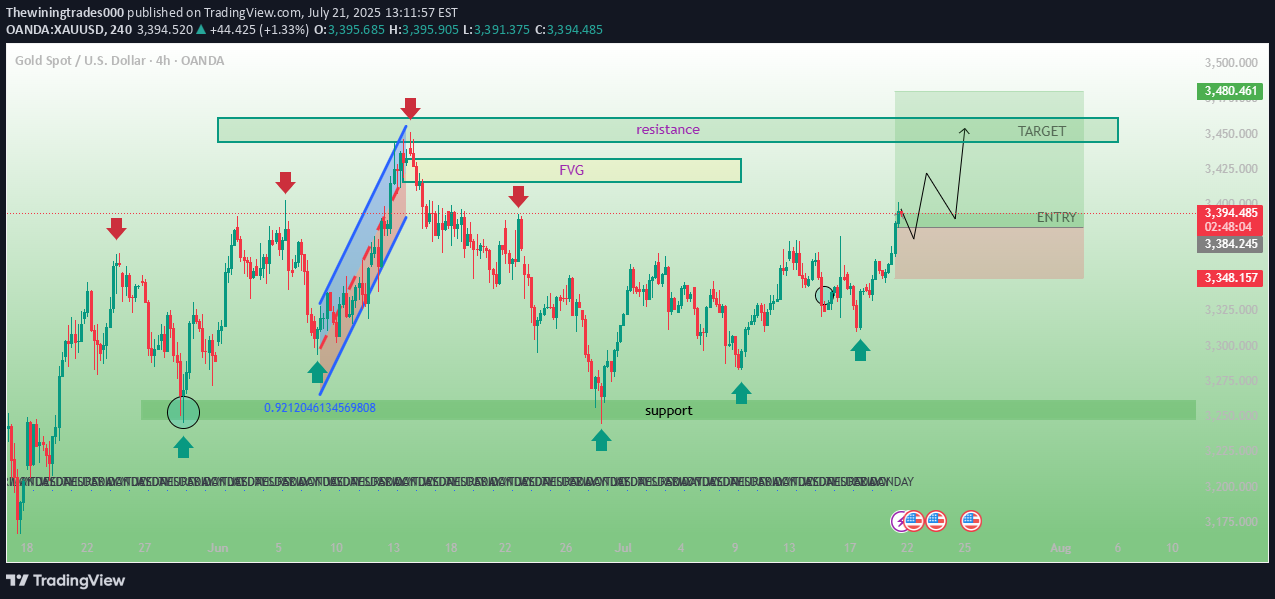
Support Zone (Green Box at the bottom): Marked as a buying area, where price bounced multiple times (shown by blue arrows). Resistance Zone (Green Box at the top): A significant supply zone where price previously reversed (shown by red arrows). Fair Value Gap (FVG): Highlighted box area — a gap or imbalance likely targeted for price correction. 2. Trend/Pattern: A previous sharp upward movement is highlighted with a blue rising channel, followed by a retracement. A bullish market structure seems to be forming with higher lows, aiming for a new high. Price Prediction Path: A black projected line indicates expected price action — a minor dip into the Entry Zone, then a push toward the Target Zone. 3. Trade Setup: ENTRY: Marked in a green box just above support (~3,384 area). TARGET: A higher green box (~3,460 area) above resistance. Stop-Loss Zone: Below the entry zone (~3,348), marked in red — the invalidation point for the bullish setup. --- 📅 Timestamp The vertical dotted line is aligned with Mon 14 Jul '25 21:00, probably marking a significant breakout or FVG event. --- 🔧 Indicators & Tools Standard tools like: Trendlines Horizontal support/resistance Box regions (support, resistance, FVG) Arrows (marking price reactions) Price label tags and fib values --- This is a bullish trade setup on the XAUUSD 4H chart, expecting a retracement to an entry zone followed by a push to a higher target. The chart combines key levels, market structure, and liquidity zones (FVG) in planning the tradalmost target hit 450 pips runing guys wait for target hitcompelte target 600 pips guys
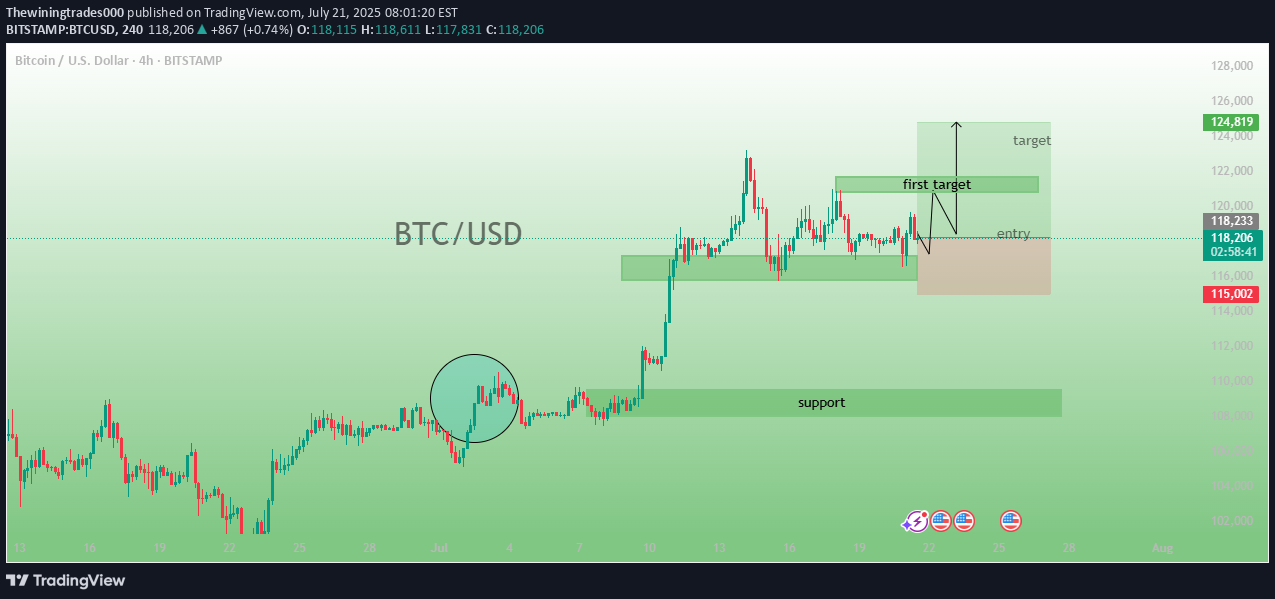
Chart Analysis: The chart uses several trading tools and annotations: 📌 Key Annotations and Areas: 1. Entry Zone (Green box around $118,000): This is the suggested area for a long (buy) trade entry. Price is currently in or near this entry zone. 2. First Target (Green box near $120,000): This is the initial profit-taking area where traders might close part of their position. 3. Final Target (Green box near $124,819): The final target area, possibly the end goal of the trade setup. 4. Stop-Loss Zone (Red area near $115,002): Below the entry zone, where the trade should be exited if price moves against the setup. 5. Support Zone (Green area below the chart, near $108,092): A historical area of price support that might act as a bounce point if price drops. 6. Highlighted Circle (on a past price action): Possibly marks a key market structure break or liquidity sweep. 7. Labels on Chart: “BTC/USD” at the center. "entry", "first target", "target", and "support" to mark important zones. --- 🔧 Technical Indicators and Tools: Ichimoku (values shown above): A popular trend-following indicator. Various overlays and labels from a custom strategy/script, possibly showing FVG (Fair Value Gap), OB (Order Block), etc. Drawing tools: Rectangle zones, text labels, and arrows are used for clarity.
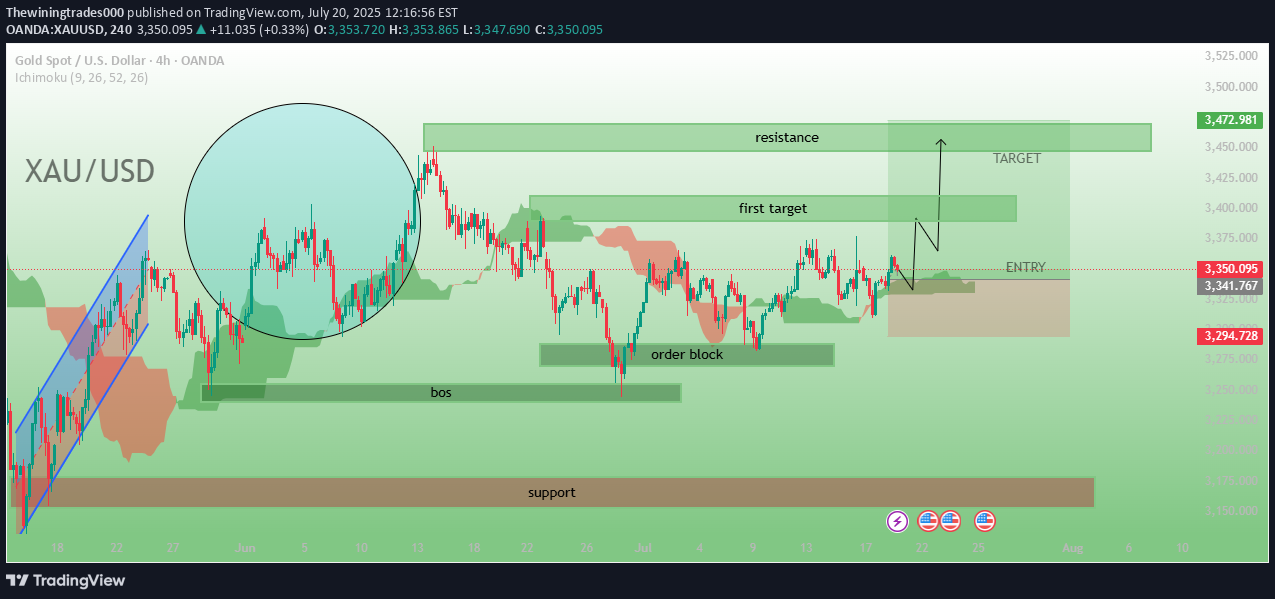
1. Blue Uptrend Channel (Left Side): Indicates a previously strong upward trend that has since been broken. 2. Large Blue Circle: Highlights a price consolidation or correction phase after the uptrend. Possibly showing market indecision or a sideways range. 3. Green Rectangles: Support & Resistance Zones: Support (bottom of chart) Resistance (top green box) Order Block and Box marked: Zones where institutional buying/selling may have occurred. First Target and TARGET: Potential bullish targets. 4. Price Prediction Arrow (Right Side): Suggests a bullish move from the entry zone up to the first target, then to the final TARGET zone. Shows expected price path. 5. Current Price Level: Approximately 3,386.835 with a small upward movement of +3.200 (0.09%). 6. Horizontal Levels: Several prices marked on the right (e.g., 3,505.099, 3,341.207, 3,318.786, 3,278.728) likely represent key price zones. --- Other Elements Chart Tools Panel (Left Side): Tools for drawing, indicators, and other charting functions. Tabs: Multiple browser tabs open at the top, mostly related to ETH/USDT and market charts. Bottom Bar: Shows taskbar with browsers (Firefox, Edge, Chrome), and time/date as 10:13 AM, July 20, 2025. --- Interpretation The chart suggests a technical analysis of a potential bullish setup for XAU/USD. The trader appears to be planning a long (buy) position with targets based on resistance levels, following a support bounce or order block entry.250 pips runing wait for 3400
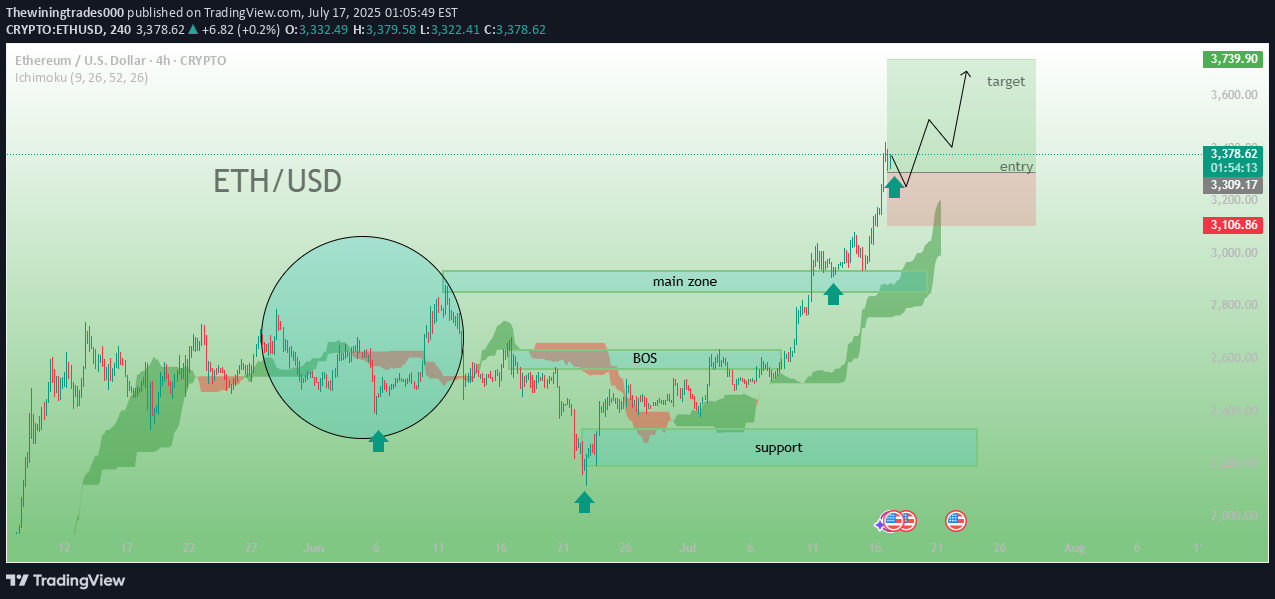
The chart clearly depicts a bullish structure with a breakout from a consolidation phase. Price is trading well above the Ichimoku Cloud, indicating strong bullish momentum. 🟦 Key Zones Marked 1. Support Zone (bottom blue box): Identified where price found demand and reversed upwards. Acts as a demand zone and base of the recent rally. 2. Main Zone (mid blue box): Previously a consolidation/resistance zone, now flipped as support. Price broke structure (BOS) here and retested it, confirming strength. 3. Entry & Target (top red/green box): This is a long trade setup: Entry: Marked on pullback to the breakout zone. Target: A bullish projection after confirming support and structure. 🔄 BOS – Break of Structure A BOS is highlighted, confirming a change from bearish/consolidation to bullish structure. Signals smart money or institutional interest pushing price higher. --- 🧠 Strategic Insight The setup uses a smart money concept: price moves from support, breaks resistance, retests, and continues upward. The Ichimoku Cloud confirms: Bullish sentiment as price is above cloud. Leading span is green, supporting bullish continuation. --- 🛠️ Trade Plan (Based on Chart) Entry: On minor pullback into marked “entry” zone. Stop Loss: Likely below the “main zone” or cloud support. Target: As shown in green zone; aiming for higher highs after breakout. ---1100 pips runing wait for more6000 pips target hit guys target reached
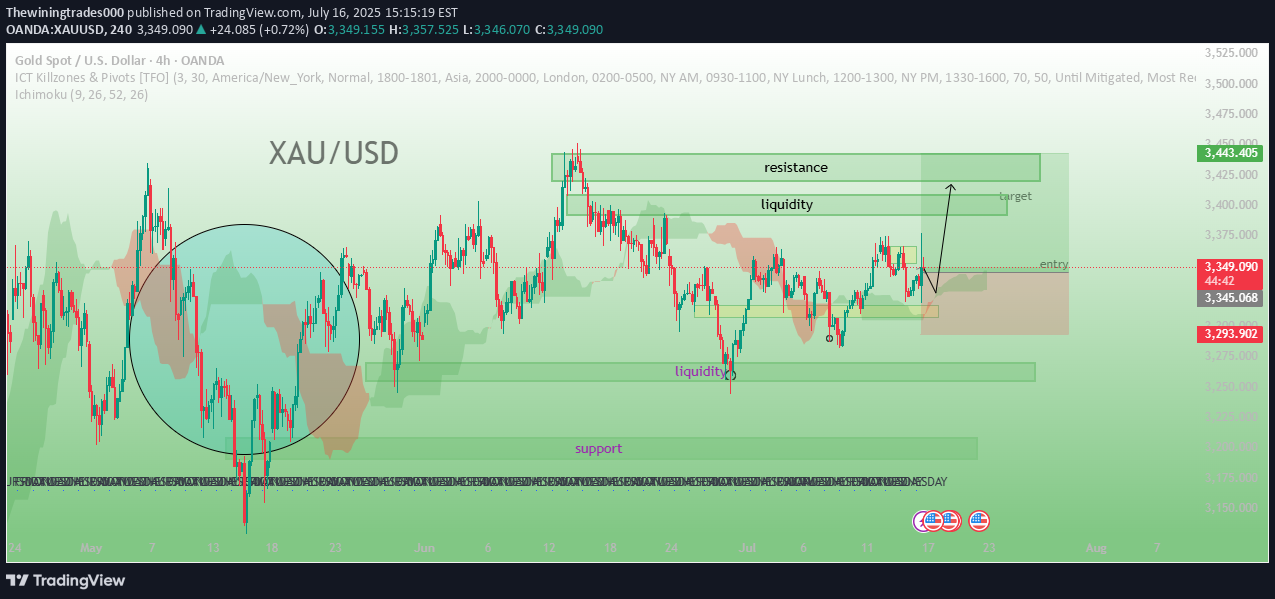
The price is showing a bullish shift after reacting from a liquidity sweep below a support zone. The market created equal highs and liquidity pockets above the current level, suggesting a bullish target. --- 🧩 Key Zones Identified: 🟫 Entry Zone (Highlighted in Beige): Price Range: Approx. $3,329 – $3,347 This is a demand zone or Order Block, where a bullish reaction is expected. The current price is within or just above this zone, indicating a valid buy setup. 💧 Liquidity Zones: Sell-side liquidity: Swept below ~$3,293 (marked as "liquidity") Buy-side liquidity: Exists above the $3,380–$3,443 range These liquidity levels act as magnet zones for price, especially in SMC trading. 🔼 Target Zone: Resistance / Liquidity target: Around $3,443.685 This aligns with an inefficiency, possible OB, and liquidity cluster—ideal for take profit. --- ☁️ Ichimoku Cloud Indicator: The chart uses Ichimoku (settings: 9, 26, 52, 26) Price is approaching the cloud's top, indicating a potential bullish breakout if price maintains strength. --- 📉 Support & Risk Area: Marked below at $3,293.902 A break below this area may invalidate the trade setup (stop-loss region) --- 📌 Trade Plan Based on Chart: ElementValue BiasBullish Entry Zone$3,329 – $3,347 Target Zone$3,443.685 Stop LossBelow $3,293 RationaleLiquidity sweep + OB Tools UsedIchimoku + SMC concepts600 pips guys 3320 to 3370 haha soon 3380 our last target is coming soon
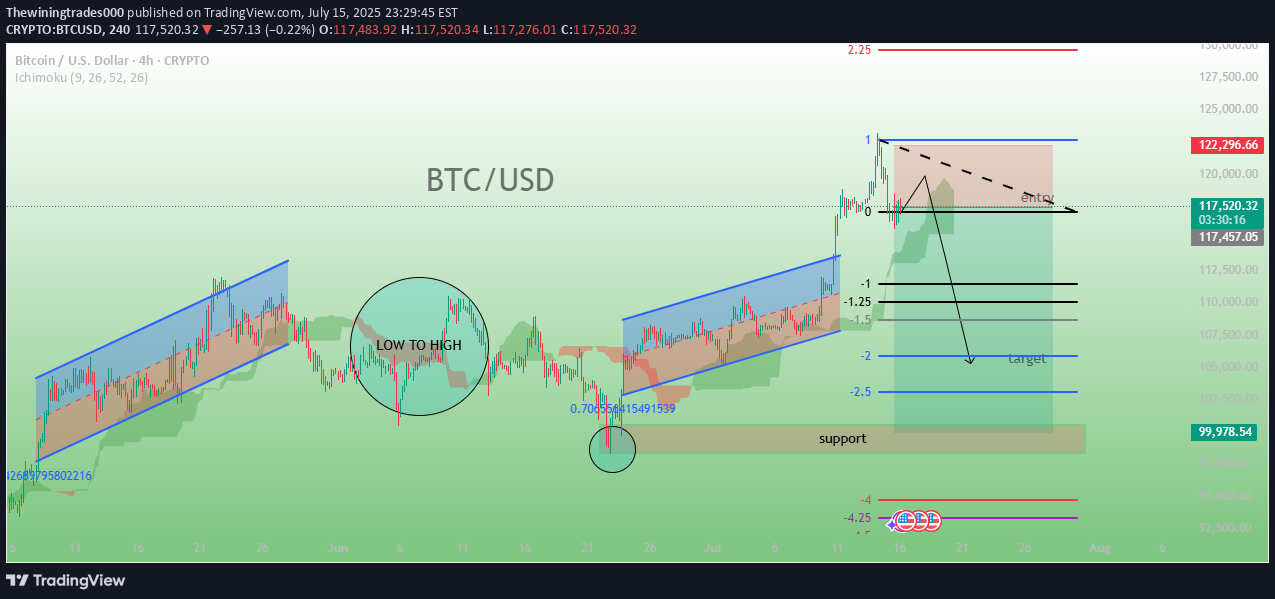
1. Previous Price Action (Left Side) A significant accumulation phase is marked with a large green circle. This area likely represents a demand zone or a liquidity grab. Following this phase, price rallies upward, entering a rising channel or parallel trend structure (highlighted in blue). 2. Channel Structure (Middle) Price respects the channel and continues higher, making higher highs and higher lows. Eventually, it breaks out strongly above the channel — a classic market expansion or premium pricing zone after accumulation and trend formation. 3. Premium Zone and Reversal Setup (Right Side) At the top, a sell zone / imbalance area is highlighted in red/pink. The market reaches an entry zone marked with a dashed line inside this premium area. This is where a short position (sell) is anticipated. 4. Projected Price Path A black arrow forecasts a move downward: Entry → retrace downward Targets labeled: -1.25, -1.5, -2.0, and so on (standard SMC/Fibonacci extensions) Final target near 99,978.54, suggesting a bearish outlook. 5. Support Area A green support zone is marked near the lower Fibonacci levels. Suggests price might react here or reverse. --- 🔹 Technical Strategy Highlighted Entry: After a premium zone grab / liquidity sweep. Bias: Bearish after upward liquidity has been taken. Tools Used: Fibonacci levels Channel analysis Support zones Market structure shifts --- 🔹 Conclusion This is a classic SMC-style bearish setup: Price grabs liquidity above highs (premium zone), Enters sell zone, Short trade anticipated targeting support/fib levels.
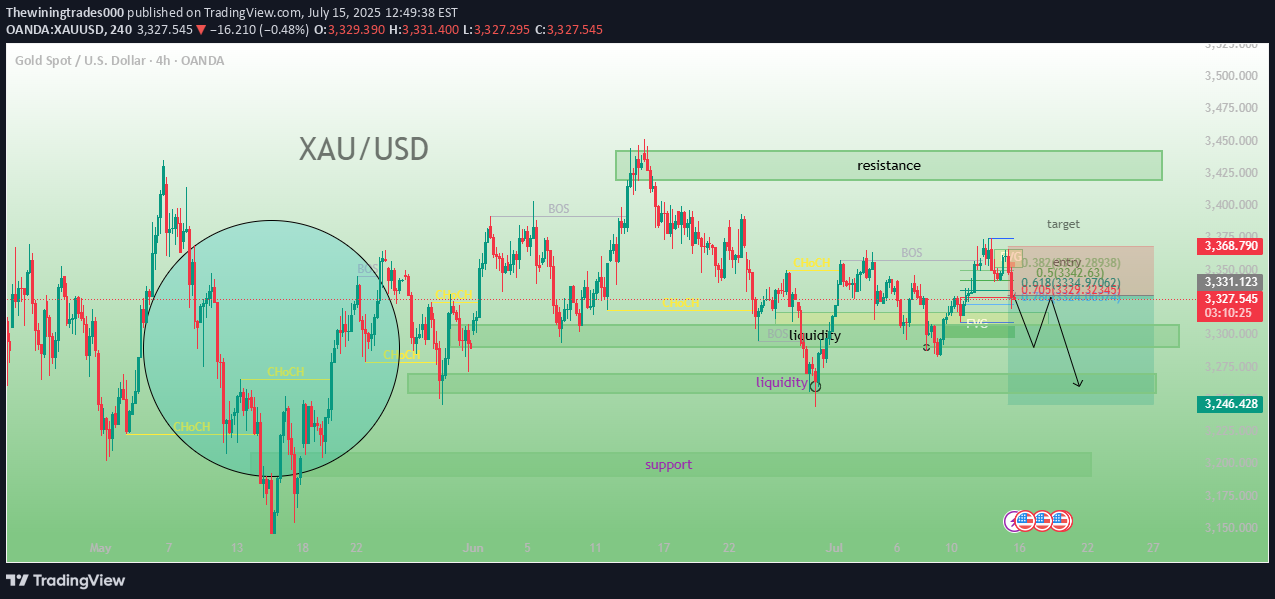
Smart Money Concepts (SMC) Highlights: 1. CHoCH (Change of Character): Marked on the left within the large blue circle, showing a transition from bulish to bearish structure. Suggests a shift in market sentiment or control from buyer to sellers. 2. BOS (Break of Structure): Multiple BOS labels indicate key structure breaks, confirming continuation patterns. Notable BOS toward the middle of the chart indicates bearish continuation. 3. Liquidity Zones: Several liquidity areas marked beneath key support levels, indicating potential liquidity grabs (stop hunts) before price reversal. 4. OB (Order Block): Implied near the current price zone, suggesting institutional interest. Price is revisiting this zone, hinting at a potential sell setup. --- 📉 Bearish Setup in Play: A resistance zone is identified at the top (~1,340+ level). Target area is marked lower (~1,346), suggesting a short trade setup from the current price zone. Price is expected to: 1. Tap into the resistance zone or the nearby order block. 2. Reverse from there. 3. Drop into the demand/support zone below. --- 📏 Fibonacci Confluence: A Fibonacci retracement appears to be drawn with confluence near resistance, enhancing the credibility of the short setup. Strong rejection expected from the golden pocket (0.618–0.705 zone). --- 🧱 Support & Resistance Levels: Resistance Zone: ~1340–1345 Target Zone: ~1346 Support Zone: Marked at the bottom of the chart, aligning with previous liquidity grabs. --- 🎯 Conclusion – Pro View: This chart reflects a smart money-based bearish trade setup: After sweeping liquidity and tapping into a premium price zone, the expectation is for price to reject the resistance area and move downward, targeting a key support level. The analysis combines structural breaks (BOS/CHoCH), liquidity sweeps, Fibonacci confluence, and order blocks—all typical of institutional trading logic.
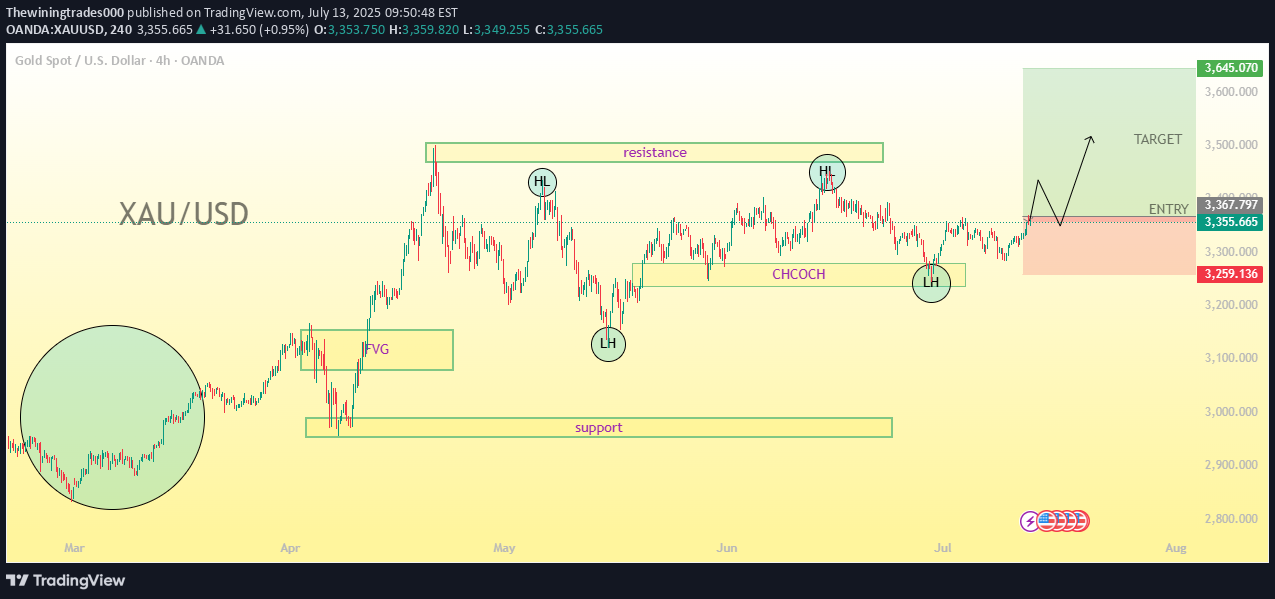
Resistance is identified at the top, marked by an earlier Higher High (HH), where the price has recently failed to break above. Support is noted lower down, where the price has previously formed a Lower High (LH), showing potential demand levels for a bounce. The chart is indicating a CHoCH (Change of Character), signaling a possible reversal or continuation of price movement. 2. Market Imbalance: There’s a Fair Value Gap (FVG) highlighted, indicating a market inefficiency where the price may retrace to fill this gap before moving in the intended direction. 3. Trade Setup: The entry is proposed after the price breaks through the Resistance, confirming bullish momentum. Target is placed at the next resistance zone around 3,645.070, with a potential risk-to-reward ratio indicating a favorable setup if the price continues in the expected direction. The Stop Loss (SL) is placed just below the Support level, around 3,350.000. 4. Timeframe: The analysis is based on the 4-hour chart, which gives a medium-term view for entering trades, balancing short-term fluctuations with the broader trend. This setup suggests a bullish trend continuation after a breakout above the resistance, supported by the FVG and favorable risk management principles.
Disclaimer
Any content and materials included in Sahmeto's website and official communication channels are a compilation of personal opinions and analyses and are not binding. They do not constitute any recommendation for buying, selling, entering or exiting the stock market and cryptocurrency market. Also, all news and analyses included in the website and channels are merely republished information from official and unofficial domestic and foreign sources, and it is obvious that users of the said content are responsible for following up and ensuring the authenticity and accuracy of the materials. Therefore, while disclaiming responsibility, it is declared that the responsibility for any decision-making, action, and potential profit and loss in the capital market and cryptocurrency market lies with the trader.