Technical analysis by Thewiningtrades000 about Symbol BTC: Buy recommendation (7/21/2025)

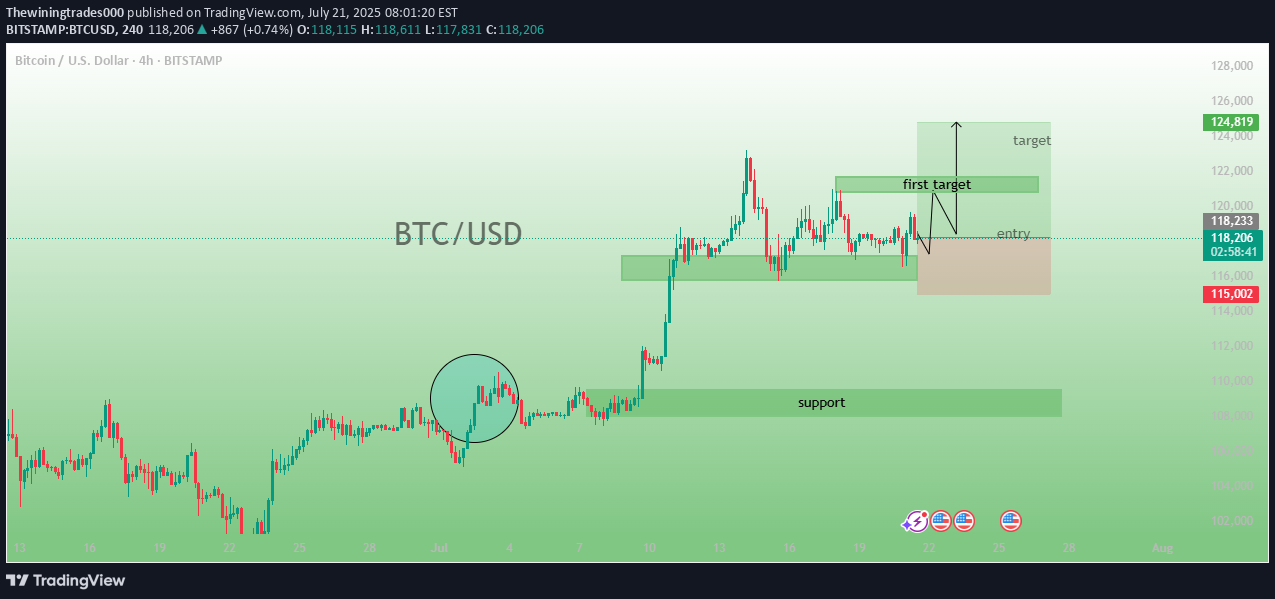
Chart Analysis: The chart uses several trading tools and annotations: 📌 Key Annotations and Areas: 1. Entry Zone (Green box around $118,000): This is the suggested area for a long (buy) trade entry. Price is currently in or near this entry zone. 2. First Target (Green box near $120,000): This is the initial profit-taking area where traders might close part of their position. 3. Final Target (Green box near $124,819): The final target area, possibly the end goal of the trade setup. 4. Stop-Loss Zone (Red area near $115,002): Below the entry zone, where the trade should be exited if price moves against the setup. 5. Support Zone (Green area below the chart, near $108,092): A historical area of price support that might act as a bounce point if price drops. 6. Highlighted Circle (on a past price action): Possibly marks a key market structure break or liquidity sweep. 7. Labels on Chart: “BTC/USD” at the center. "entry", "first target", "target", and "support" to mark important zones. --- 🔧 Technical Indicators and Tools: Ichimoku (values shown above): A popular trend-following indicator. Various overlays and labels from a custom strategy/script, possibly showing FVG (Fair Value Gap), OB (Order Block), etc. Drawing tools: Rectangle zones, text labels, and arrows are used for clarity.
