Technical analysis by Thewiningtrades000 about Symbol PAXG: Buy recommendation (7/21/2025)

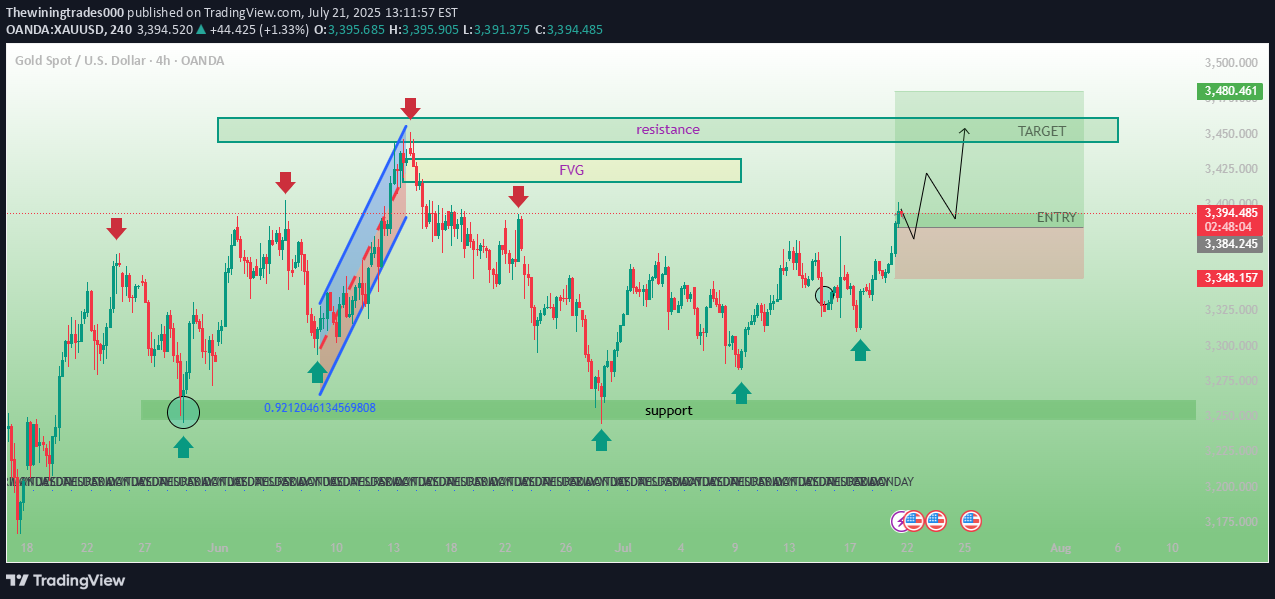
Support Zone (Green Box at the bottom): Marked as a buying area, where price bounced multiple times (shown by blue arrows). Resistance Zone (Green Box at the top): A significant supply zone where price previously reversed (shown by red arrows). Fair Value Gap (FVG): Highlighted box area — a gap or imbalance likely targeted for price correction. 2. Trend/Pattern: A previous sharp upward movement is highlighted with a blue rising channel, followed by a retracement. A bullish market structure seems to be forming with higher lows, aiming for a new high. Price Prediction Path: A black projected line indicates expected price action — a minor dip into the Entry Zone, then a push toward the Target Zone. 3. Trade Setup: ENTRY: Marked in a green box just above support (~3,384 area). TARGET: A higher green box (~3,460 area) above resistance. Stop-Loss Zone: Below the entry zone (~3,348), marked in red — the invalidation point for the bullish setup. --- 📅 Timestamp The vertical dotted line is aligned with Mon 14 Jul '25 21:00, probably marking a significant breakout or FVG event. --- 🔧 Indicators & Tools Standard tools like: Trendlines Horizontal support/resistance Box regions (support, resistance, FVG) Arrows (marking price reactions) Price label tags and fib values --- This is a bullish trade setup on the XAUUSD 4H chart, expecting a retracement to an entry zone followed by a push to a higher target. The chart combines key levels, market structure, and liquidity zones (FVG) in planning the tradalmost target hit 450 pips runing guys wait for target hitcompelte target 600 pips guys
